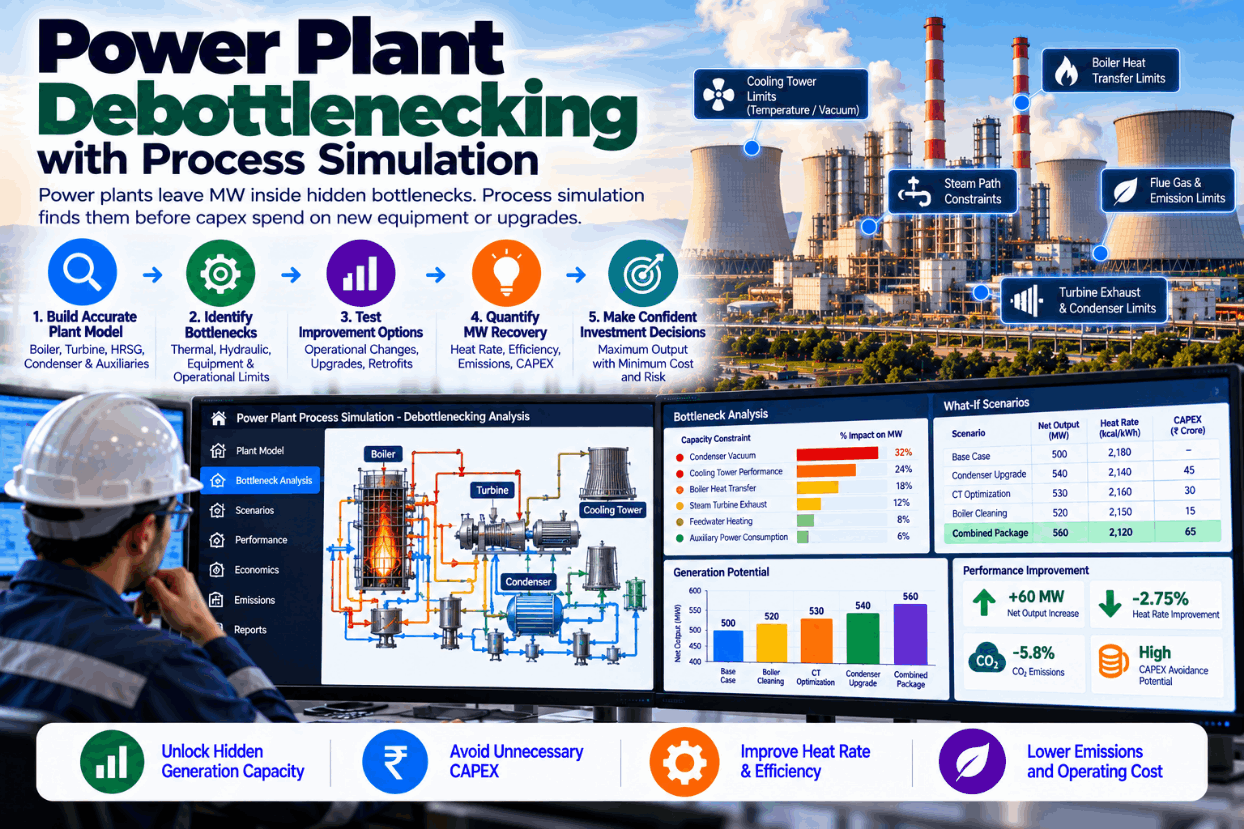
Many power plants cannot reach their rated output when it matters most. On a hot afternoon, an induced draft fan runs out of margin. With harder coal, the mills cannot keep up. With a fouled condenser, backpressure limits load. Each limit is a bottleneck, and each costs megawatts at the most valuable times. The common response is to propose new equipment. Process simulation often shows a cheaper path: find the real constraint, understand why it binds and fix the cause, sometimes without capital at all. This guide explains typical bottlenecks, how simulation finds them, how to rank recovery options and how to avoid spending capital on the wrong fix. To see a debottlenecking study, book a short walkthrough.
Power Plant Debottlenecking With Process Simulation: Find Hidden MW Before You Spend Capex
Every constraint on output found, explained and ranked, so megawatts are recovered by fixing the real cause, often before any new equipment is bought.
Why Plants Lose Megawatts to Hidden Bottlenecks
Plants are designed with margins, but those margins are eroded over time. Air heater leakage adds gas flow to the ID fans. Coal from a new source is harder to grind. Condenser tubes foul. Pumps wear. Each change is small, but together they can leave a unit unable to reach rated output, especially in hot weather when cooling is poorest and demand is highest.
The gap between average and best performance is well documented. An EIA analysis cites a 2010 NETL assessment finding efficiency gaps of 1.8% to 4.2% between average and 90th percentile coal units. Capacity limits follow the same pattern: much of the lost output is not a design shortfall but accumulated degradation and unfavourable operating conditions.
The first step is to find which constraint actually limits output, and why. We can review your unit’s capacity history on a call.
Where Capacity Is Usually Lost
Most capacity limits in thermal plants come from a familiar list. Each has a signature in the data.
| System | Limit | How it shows | Common root cause |
|---|---|---|---|
| Induced draft fans | Fan at maximum damper or speed | Output capped as ambient rises | Air heater leakage, air in-leakage, fouling |
| Forced and primary air fans | Air flow limit | Oxygen falls at high load | Fan wear, duct leaks, air heater problems |
| Coal mills | Grinding capacity | Mill amps and differential at limit | Harder or wetter coal, mill wear |
| Condenser | Backpressure limit | Load reduced on hot days | Fouling, air ingress, cooling water limits |
| Feedwater system | Flow or pressure limit | Pump at maximum speed | Pump wear, recirculation valve leakage |
| Superheater and reheater | Metal or steam temperature | Spray flows at maximum | Slagging, burner tilt limits |
| Coal and ash handling | Throughput limit | Bunker levels falling at full load | Conveyor, feeder or ash system capacity |
Often more than one constraint is close to binding. Fixing the first reveals the second. That is why a debottlenecking study ranks all constraints, not just the obvious one. See a ranked constraint list in a demo.
How Simulation Finds the Real Constraint
Debottlenecking with simulation follows a clear method.
Historian data from periods when output was limited.
Match the plant model to current performance and degradation.
Raise load in the model and see which limit is reached first.
Trace why it binds: design, degradation or conditions.
Simulate repairs, operating changes and upgrades.
Order fixes by MW recovered, cost and time.
The key step is explaining the limit. An ID fan at its maximum may look like a fan problem, but the model may show that air heater leakage has added significant gas flow. Repairing air heater seals may then recover the margin at a fraction of the cost of a new fan.
Simulation also shows what happens after the first fix. Lifting the fan constraint may expose the condenser as the next limit on hot days. Knowing the sequence avoids spending on one fix only to find another constraint immediately behind it.
Our engineers run this method with your performance team so the findings are trusted internally.
Ranking Constraints by Megawatts Lost
Once constraints are understood, rank them by the output they cost under realistic conditions.
Illustrative figures. The first two constraints account for most of the lost output, and both have causes that may be fixed without new equipment.
Rank on realistic conditions, not design ones.
Seasonality changes the order. In winter, mill capacity may be the first limit because coal is wetter; in summer, fans and condensers take over as air and water warm. A study should rank constraints for each season that matters to the market.
The ranking should consider when each constraint binds. A limit that binds only on the hottest days is worth less than one that binds every evening peak. Weighting by hours and price turns megawatts into money.
The ranking becomes the basis for a recovery plan with owners and dates, tracked in the same way as heat rate actions. That tracking is part of the capacity roadmap.
Fix the Cause or Buy New Equipment?
The central question in debottlenecking is whether to restore existing capacity or add new capacity.
- Repair air heater seals to cut gas flow
- Clean condensers and fix air ingress
- Restore mill internals and classifier settings
- Repair pumps and recirculation valves
- Usually lower cost and faster
- Often done in scheduled outages
- Larger or additional fans
- Additional mills or mill upgrades
- Cooling system expansion
- New pumps or drives
- Higher cost and longer lead time
- Sometimes the only lasting answer
Operating changes belong in the comparison as well. Adjusting excess air, mill combinations or cooling water pump staging can sometimes recover part of the margin at no cost at all, while repairs are being planned, parts ordered and outage windows agreed with the grid operator.
Simulation lets both paths be compared on the same basis. Sometimes restoring the cause recovers most of the lost output and new equipment is unnecessary. Sometimes the model shows that even a fully restored system cannot meet the target, and investment is justified. Either way, the decision rests on numbers.
Where new equipment is needed, the model also helps size it correctly, avoiding both undersized and oversized purchases. Ask our team about sizing studies.
Putting a Value on Recovered Capacity
Here is how recovered megawatts translate into value. The figures are illustrative.
Illustrative. Multiply by your margin or capacity price in the hours when the constraint binds.
Timing of the fix also matters: a repair done before summer captures a full season of value, while the same repair done after summer waits a year to pay back.
The value is often higher than the energy alone suggests, because constraints bind at peak times when prices or capacity payments are highest. Some markets also penalize failure to deliver declared capacity, adding avoided penalties to the case.
The same analysis shows the value of each option, so repair and replacement can be compared directly. We present it that way in every capacity study.
Debottlenecking Study Checklist
Use this checklist to plan a debottlenecking study.
Verifying results after each fix builds the evidence for the next investment decision. We include verification in every study plan.
Why Debottlenecking Studies Pay
Debottlenecking studies are usually small compared with the decisions they inform.
The heat rate side benefit is often overlooked. Air heater leakage repairs cut fan power; condenser cleaning improves vacuum; mill restoration improves combustion. The same work that recovers capacity usually recovers efficiency too.
A short study on your most limited unit is the fastest way to see the value. Book one with our advisors.
How iFactory Delivers Debottlenecking Studies
Limits found from historian data and the model.
Degradation and conditions behind each limit explained.
Repairs, operating changes and upgrades simulated.
MW recovered weighted by hours and prices.
Equipment sized on modelled need.
Results confirmed after each fix.
It works with your historian, performance data and maintenance plans. Bring your most limited unit and we will show its constraint picture in a session.
Find the Megawatts Hiding in Your Unit
Share data from periods when output was limited. We calibrate a model, rank every constraint by MW lost and compare repair and upgrade options before your next outage or capex request.
Simulation shows ID fan margin, not mills, limits output above 485 MW in summer. Air heater leakage adds 9% to gas flow.
A Summer Constraint Explained
This exchange shows how a station manager might use iFactory before summer.
iFactory ships as a pre-configured NVIDIA AI server, racked and ready with the capacity analysis and debottlenecking models loaded. Rack it, plug in power and Ethernet, and the AI is live on your network. Our scope covers sensors and data connections across boilers, fans, mills, turbines and cooling systems, DCS, PLC/SCADA, historian and ERP integration, cabling and network setup, operator and quality team training, and 24×7 remote monitoring.
Server installed, DCS and historian links live, historical operating, performance and maintenance data loaded.
Models calibrated on your own unit data, then run in advisory mode on one unit with your operations and performance engineers reviewing every output.
Rollout to the agreed units under your change management, operator and engineer training, and 24×7 remote monitoring in place.
Software, server and integration come as one package. For pricing on your units, contact our sales team.
Frequently Asked Questions
Finding and removing the constraints that stop a unit reaching its rated or target output, such as fan, mill, condenser or pump limits, ideally by fixing their causes.
ID fan capacity, air flow, mill grinding capacity, condenser backpressure, feedwater pump limits, steam temperature limits and coal or ash handling throughput.
A calibrated model shows which limit is reached first as load rises, explains why it binds and tests repairs and upgrades before any money is spent.
No. Often restoring the cause, such as repairing air heater seals or cleaning a condenser, recovers most of the lost output. Simulation shows when new equipment is truly needed.
By megawatts recovered, weighted by the hours and prices when each constraint binds, against cost and time to implement.
A first study on one unit typically takes weeks once data is available. Plan it with our engineers.
Recover Your Lost Megawatts Before Buying New Equipment
iFactory finds every constraint on your unit’s output, explains why it binds and ranks the fixes, so capacity comes back at the lowest cost and capital goes only where it is needed.
Illustrative. Constraints are ranked so the cheapest recovery comes first.