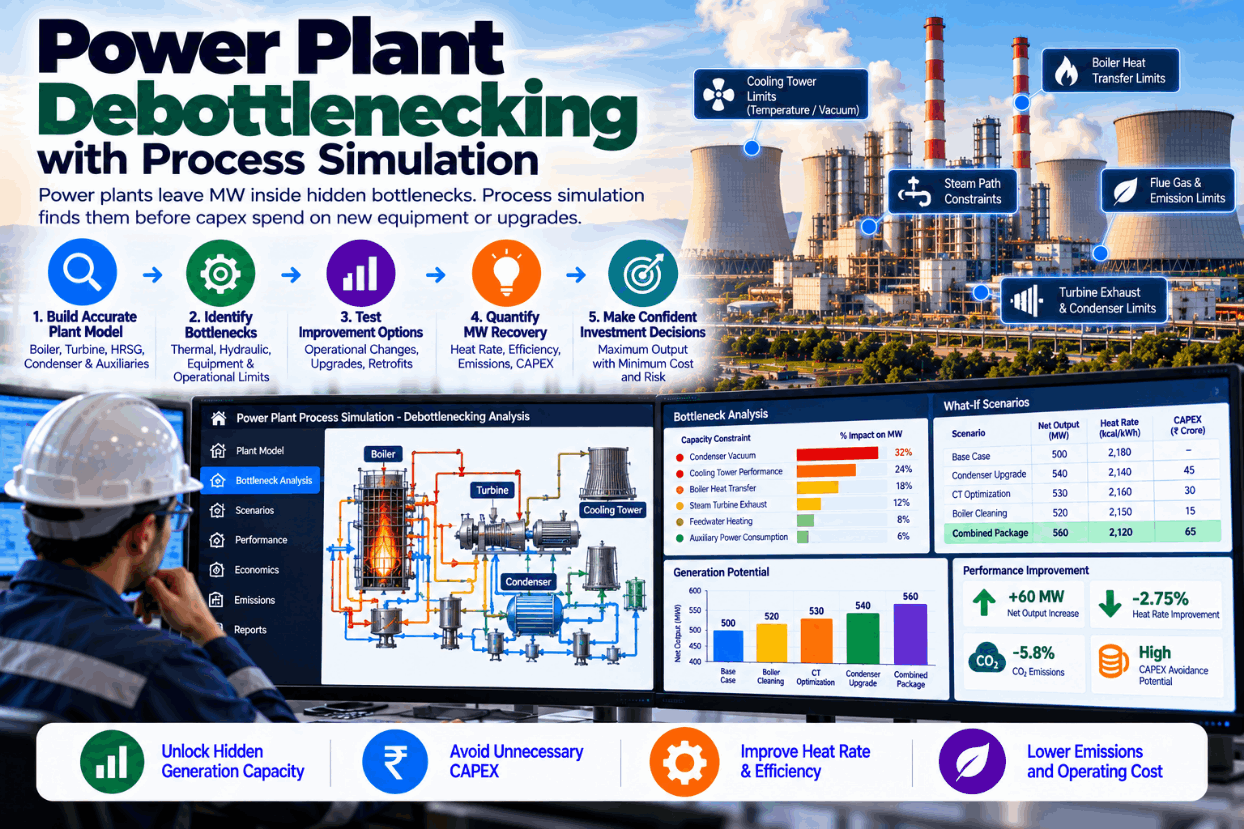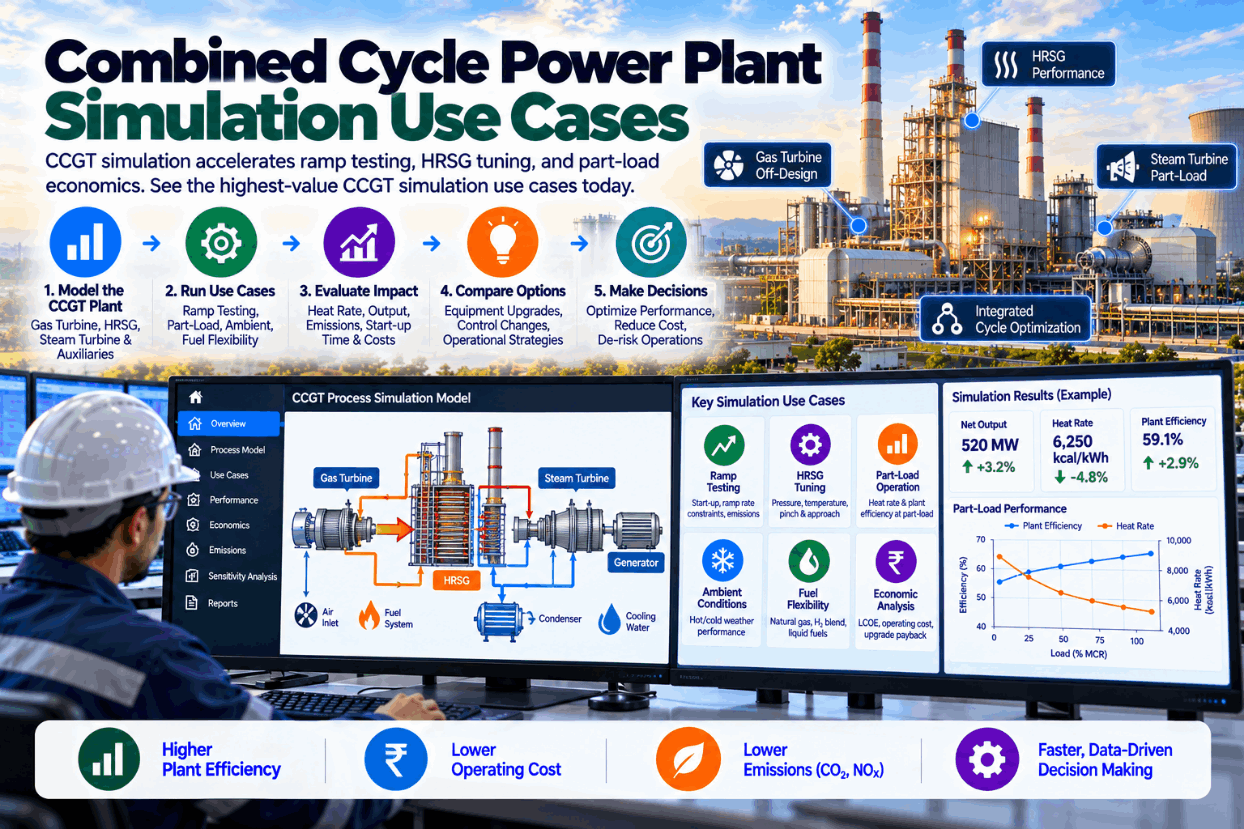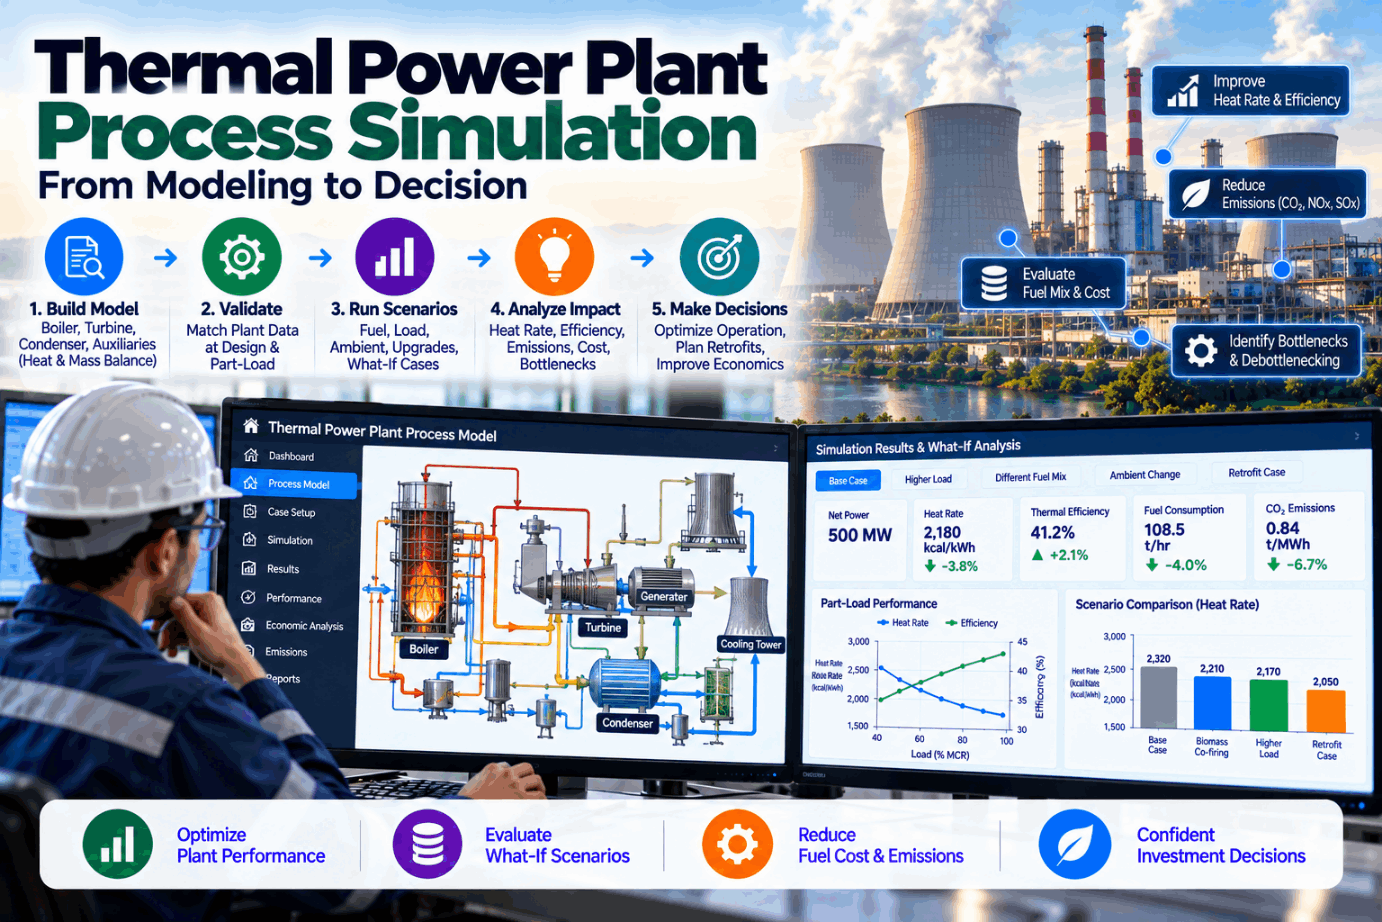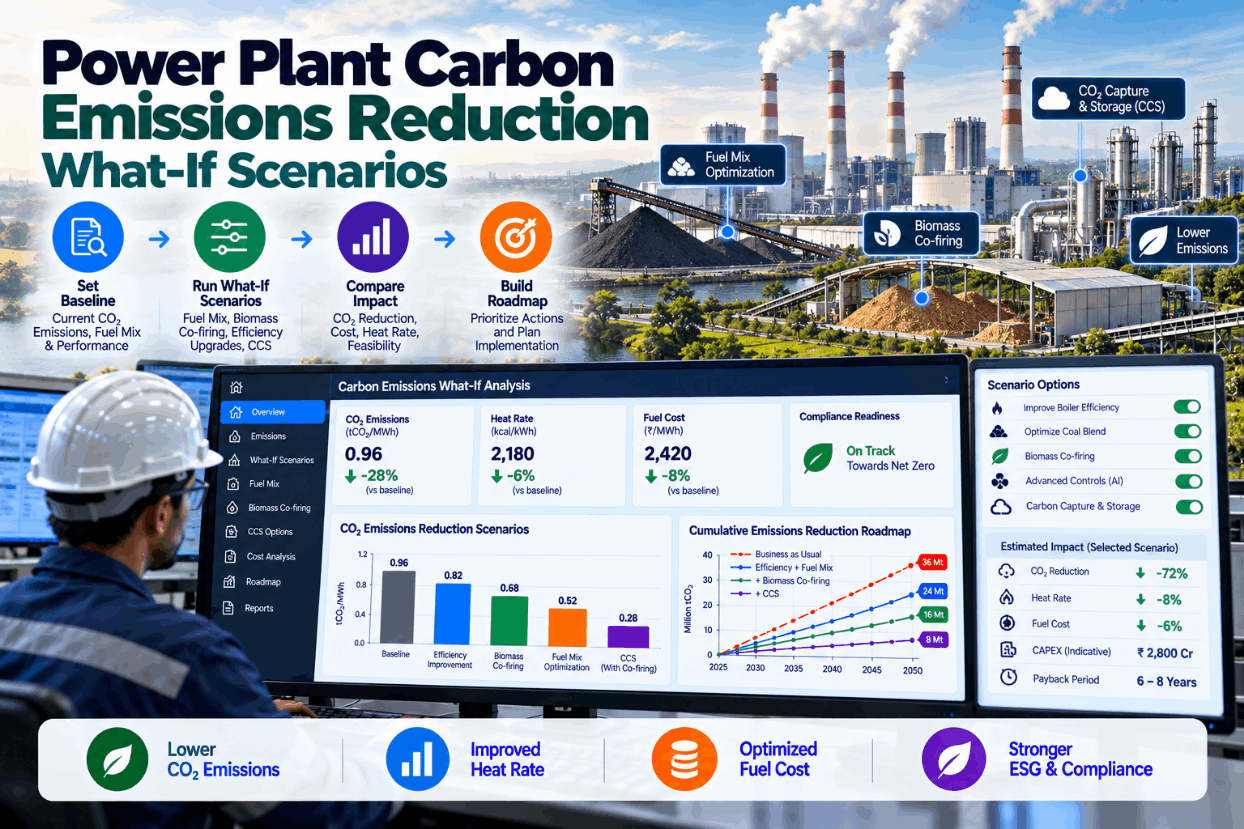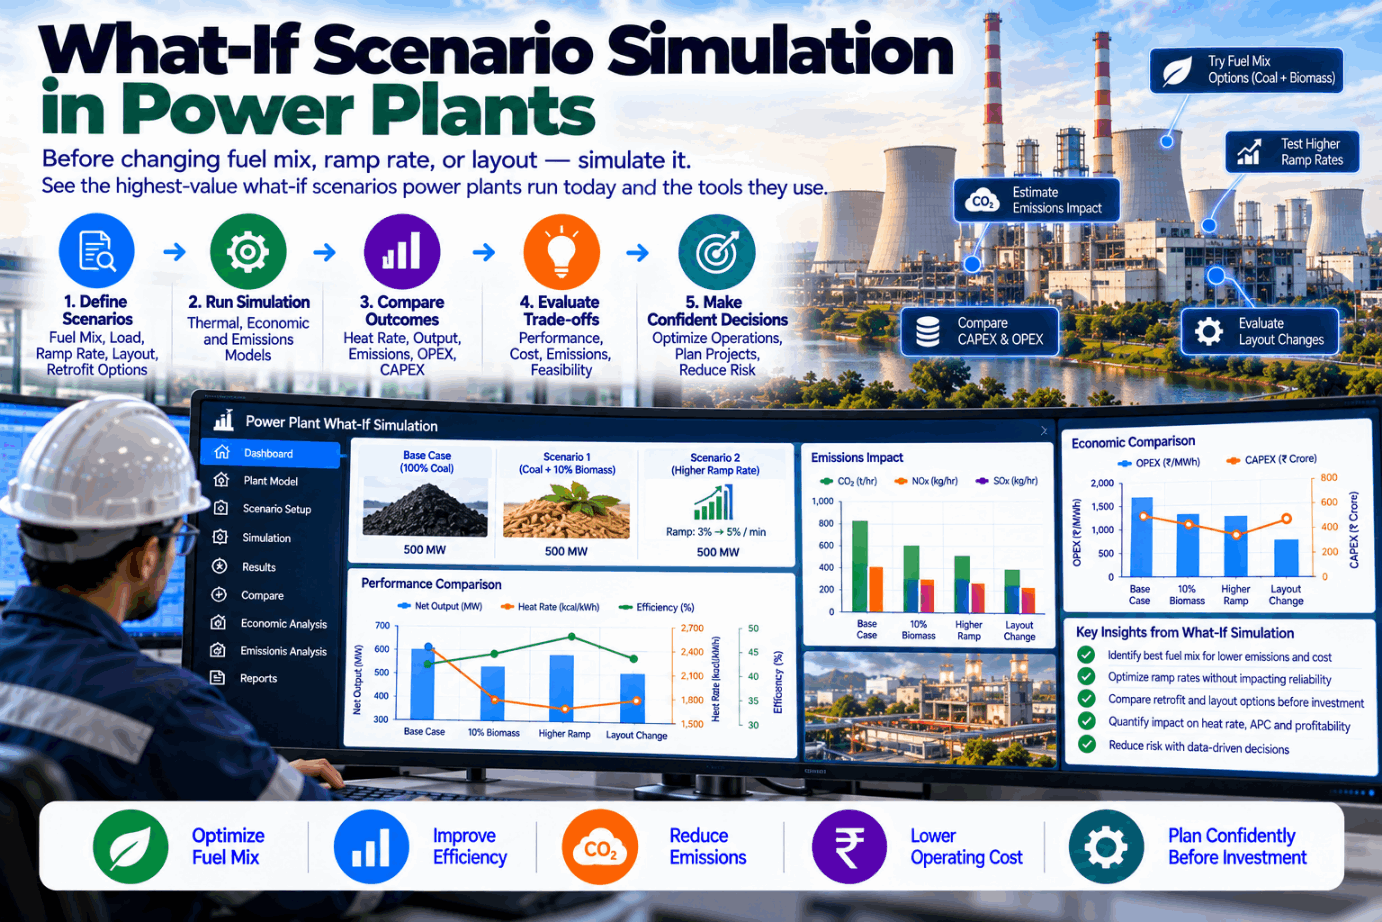
Power plants face a steady stream of changes: a new coal source, a faster ramp requirement from the grid, a summer with warmer cooling water, a mill out for overhaul, a proposal to rearrange equipment. Each change has consequences for output, efficiency, emissions and equipment life. Trying them on the plant is slow and risky. What-if scenario simulation tests them on a calibrated model first, so the plant changes only when the answer is known. This guide covers the highest-value scenarios power plants run, how scenario simulation works, how to compare results fairly, how to govern assumptions and how to turn scenarios into decisions. To see what-if scenarios on your plant, book a short walkthrough.
What-If Scenario Simulation in Power Plants: Test Fuel, Ramp and Layout Changes Before You Make Them
Calibrated plant models run proposed changes and show their effect on output, heat rate, emissions and limits, so decisions rest on evidence instead of trials.
Why Plants Need to Test Changes Before Making Them
Every change to fuel, operation or equipment is a small experiment on a very expensive machine. Plants traditionally learn by doing: try the new coal, watch what happens, adjust. That works for small changes but is slow, costly and sometimes risky for large ones. A trial that causes slagging, a ramp that trips the unit or an upgrade that delivers less than promised can cost far more than a study.
The pace of change is rising. Biomass co-firing mandates, such as India’s move to 7% from FY 2025-26, change fuel behaviour. Grid operators ask for faster ramps and lower minimum loads. Hotter summers push cooling systems to their limits. Each of these is a what-if question that a calibrated model can answer before the plant is touched.
Scenario simulation turns those experiments into calculations. We can discuss the questions you face on a call.
The Scenarios Power Plants Run Most
These scenario families cover most operating and planning questions.
Effect of new coals, blends or biomass on efficiency, mills, slagging and emissions.
Whether faster ramps or lower minimum load are achievable within limits.
Output and efficiency with a mill, pump, fan or heater unavailable.
Output and heat rate in hot weather or with warm cooling water.
Effect of delaying or advancing work on performance and risk.
Expected gains from new equipment or rearranged systems.
A plant typically starts with the scenarios that recur, such as fuel and availability questions, and builds a library that operators and planners reuse. See a scenario library in a demo.
How Scenario Simulation Works
A credible scenario rests on a calibrated model and explicit assumptions.
Calibrated model matching current plant performance.
State exactly what changes and what stays fixed.
Fuel properties, ambient, equipment condition and limits.
Simulate at the relevant loads and conditions.
Flag any constraint reached: temperatures, stresses, emissions, equipment.
Results side by side with the baseline and other scenarios.
Equipment condition belongs in the assumptions too. A scenario run with design-condition mills or a clean condenser will overstate what the plant can do today. The calibrated model carries current degradation, so results reflect the plant as it is.
The baseline is the foundation. A scenario that starts from a model that does not match the plant will give confident but wrong answers. Calibrating the model to current performance, and stating how closely it matches, is the first step of every study.
Limits matter as much as outputs. A scenario that shows a gain in heat rate but pushes superheater metal temperatures or mill capacity to their limits is not a free gain. Good scenario tools flag these constraints automatically.
Explicit assumptions make scenarios easy to rerun when inputs change. Our engineers document them with every study.
Comparing Scenarios Fairly
Scenario results are most useful side by side, on the same basis. Here is an illustrative comparison for a coal unit.
| Scenario | Change | Effect | Limit reached |
|---|---|---|---|
| 1 | 20% washed coal in blend | Heat rate −1.2%, mill power down | None |
| 2 | 7% biomass by heat input | Heat rate +0.4%, fossil CO2 down | Mill capacity at full load on two mills |
| 3 | Summer cooling water, 4 °C warmer | Output −14 MW at full load | Condenser backpressure |
| 4 | Ramp rate raised to 3% per minute | Heat rate +0.6% during ramps | Mill response below 55% load |
| 5 | One mill out of service | Output −38 MW | Remaining mill capacity |
Combining scenarios is often revealing. Summer cooling limits and a mill outage together may cost far more than the two effects added separately, because the unit loses the margin that normally absorbs one of them.
All values are illustrative. Two features make such a comparison trustworthy: every scenario starts from the same calibrated baseline, and each shows the limit it reaches, not just its headline effect.
Results can also be priced, turning heat rate and output changes into cost and revenue, which makes scenarios easy to compare with other decisions. That view is part of every scenario report.
Spreadsheets Versus Calibrated Models
Many plants run what-if questions in spreadsheets. They are fast and familiar but have clear limits.
- Quick for simple, single-variable questions
- Based on rules of thumb and fixed factors
- Miss interactions between systems
- Rarely check equipment limits
- Hard to audit or reuse
- Accuracy unknown
- Handles complex, multi-variable changes
- Based on thermodynamics and plant data
- Captures interactions across the cycle
- Flags limits automatically
- Assumptions recorded and reusable
- Accuracy stated against plant data
Interactions are the main reason. A new coal changes boiler efficiency, mill power, fan power, steam temperatures and emissions all at once. A spreadsheet usually captures one or two of these; a model captures them together and shows the net result.
Spreadsheets remain useful for quick checks. But for decisions with real money or risk attached, such as a new fuel contract, a grid code commitment or an upgrade, the calibrated model is worth the extra effort.
Once a model exists, running a new scenario often takes hours rather than weeks. Ask our team for typical turnaround times.
Governing Assumptions and Results
Scenario results are only as trustworthy as the process around them. This checklist keeps them honest.
Comparing predictions with what actually happened after a change is the best way to build trust in the model. We report that comparison in every study follow-up.
From Scenario to Decision
Scenarios are only useful if they lead to decisions. A simple framework helps.
State the decision, the options and who will decide.
Test each option on the calibrated model.
Compare effects, limits, costs and risks.
Choose an option and plan any trial or implementation.
Where needed, confirm on the plant with close monitoring.
Compare actual results with the scenario and refine the model.
Scenarios should also be run at the loads the plant actually spends time at, not only at full load, because many units now run long hours at part load.
Uncertain inputs should be run as ranges, such as best, expected and worst coal quality, so decisions account for risk rather than a single optimistic case.
The trial step is often much shorter after a good scenario study, because the team knows what to expect and where the limits lie. In some cases, such as a hot-weather output forecast, no trial is needed at all.
Recording decisions with their scenarios builds a history that makes future questions faster to answer. See a decision record in a session.
What Scenario Simulation Is Worth
The value of scenario simulation lies in better decisions and avoided mistakes.
A single avoided mistake, such as a coal contract that would have caused slagging or a ramp commitment the unit could not meet, can pay for a scenario capability many times over. The recurring value comes from faster, better everyday decisions.
A pilot on your most pressing question is the quickest way to see the value. Book one with our advisors.
How iFactory Delivers What-If Scenario Simulation
Baseline matched to your current plant.
Reusable fuel, ramp, outage and ambient scenarios.
Temperatures, stresses, emissions and capacities flagged.
Every scenario compared on one basis.
Effects turned into cost and revenue.
Predictions compared with actual outcomes.
It works with your plant data and existing engineering tools. Bring your current question and we will run it in a workshop.
Answer Your Most Pressing What-If Question First
Bring a live question: a new coal, a ramp commitment, a summer limit or an upgrade. We calibrate a model of your unit and run the scenarios with limits and costs shown.
Simulation shows metal temperature margins held on unit 2, but mill response limits the ramp below 55% load. Heat rate penalty during ramps 0.6%.
A Ramp Commitment Tested First
This exchange shows how an operations manager might use iFactory before a grid commitment.
iFactory ships as a pre-configured NVIDIA AI server, racked and ready with the scenario simulation models loaded. Rack it, plug in power and Ethernet, and the AI is live on your network. Our scope covers sensors and data connections across boilers, turbines, fuel and cooling systems, DCS, PLC/SCADA, historian and ERP integration, cabling and network setup, operator and quality team training, and 24×7 remote monitoring.
Server installed, DCS and historian links live, historical operating, performance and maintenance data loaded.
Models calibrated on your own unit data, then run in advisory mode on one unit with your operations and performance engineers reviewing every output.
Rollout to the agreed units under your change management, operator and engineer training, and 24×7 remote monitoring in place.
Software, server and integration come as one package. For pricing on your units, contact our sales team.
Frequently Asked Questions
Running proposed changes, such as a new fuel, faster ramps or an equipment outage, on a calibrated plant model to see their effect on output, efficiency, emissions and limits before making them.
Fuel mix and co-firing, ramp rate and minimum load, equipment out of service, hot weather and cooling limits, maintenance timing and upgrade or layout changes.
Spreadsheets suit simple questions but miss interactions and rarely check limits. Calibrated models capture the whole cycle and flag constraints.
Accuracy depends on calibration. A good study states how closely the model matches the plant and compares predictions with actual outcomes after changes.
Once a calibrated model exists, many scenarios can be run in hours. Building and calibrating the first model usually takes weeks.
Start with one live question and one unit, then build a scenario library over time. Plan it with our engineers.
Know the Answer Before You Change the Plant
iFactory runs your what-if questions on a calibrated model of your plant, flags every limit and prices every result, so fuel, flexibility and investment decisions rest on evidence.
Illustrative. Each scenario shows its effect before anything changes on the plant.