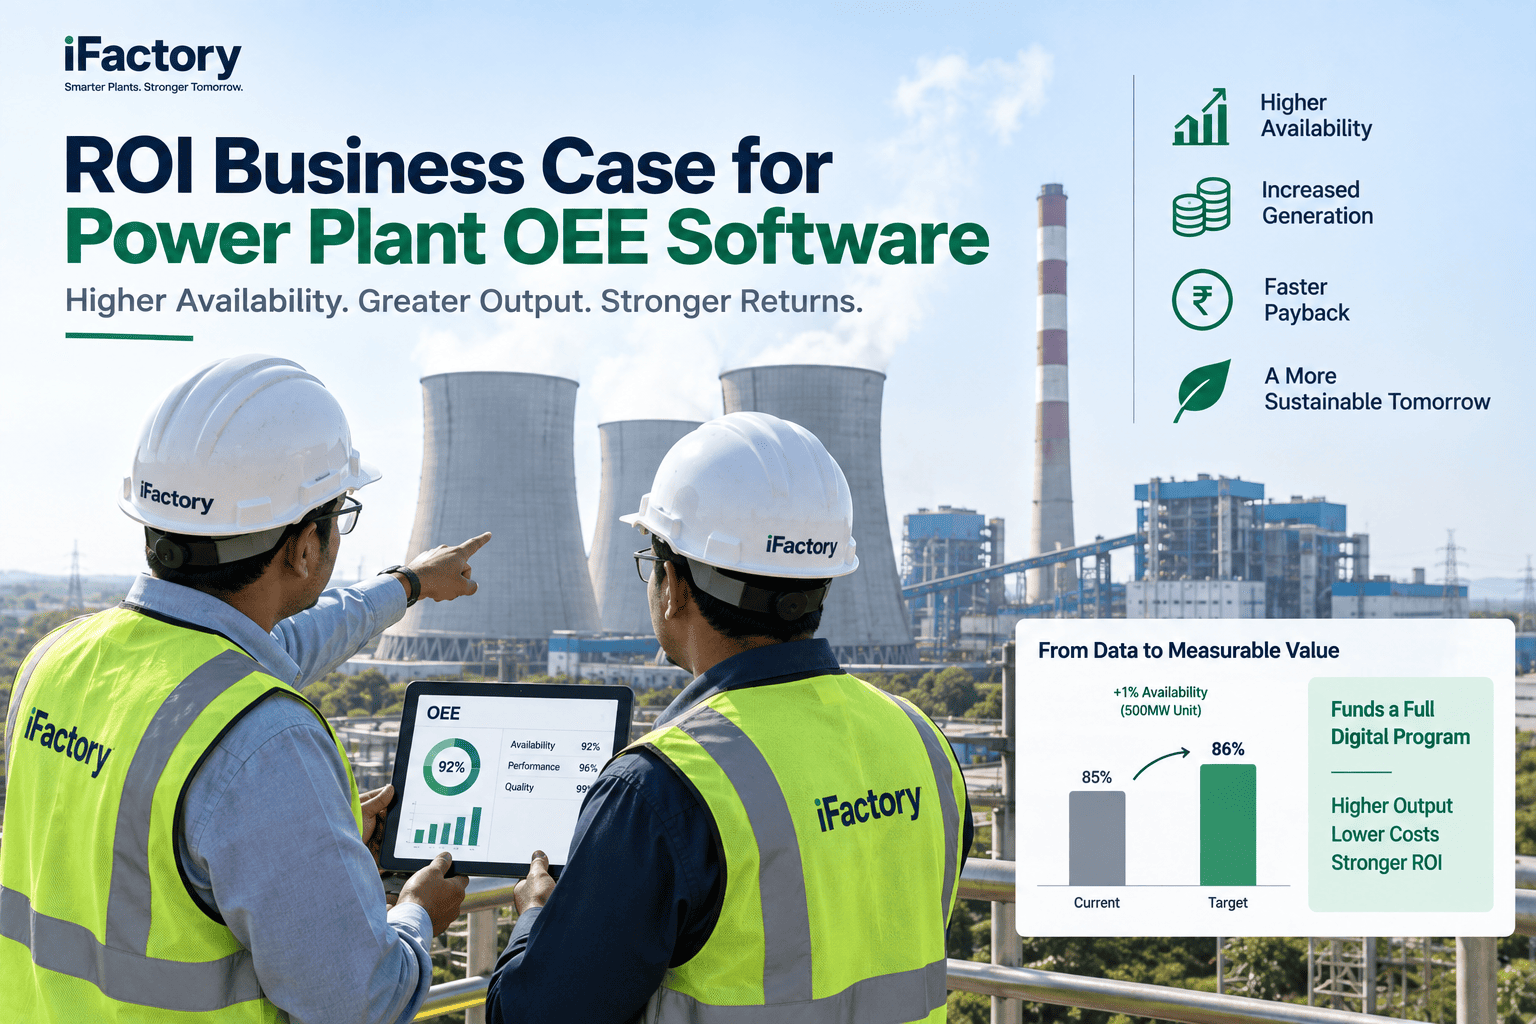
A 500 MW unit sitting at 87% equivalent availability factor instead of the 92%+ that NERC GADS data shows top-quartile thermal plants sustain is leaving roughly $6M a year in generation revenue on the table — one EAF point alone is worth about $1.2M on a unit that size. A 1% heat rate improvement adds another $580,000 in fuel. Most digital OEE programs at power plants get killed at the budget stage, not because the value isn't real, but because nobody builds the business case in numbers a CFO can underwrite: current baseline, target baseline, dollar delta, payback date. iFactory's ROI Model is built specifically to close that gap — a CFO-ready business case for power plant OEE software, built from your own unit data, not industry averages.
iFactory OEE ROI Model
A CFO-Ready Business Case for Power Plant OEE Software
One model, four value levers — availability, heat rate, auxiliary load, and unplanned maintenance — quantified from your own unit data and built into a payback timeline your CFO can underwrite.
$1.2M
per EAF point, 500 MW unit
$580K
per 1% heat rate gain
25-30%
forced outage cut with PdM
<12 mo
typical payback period
The Business Case in One View
A CFO-ready ROI model isn't one number — it's four value levers, each with its own current baseline, target, dollar value, and payback. This is what that view looks like, built from real unit data.
Availability Recovery
EAF · 500 MW unit
High value
Current EAF87.2%12-mo avg
Target EAF91.5%top-quartile band
Annual value$5.2Mat $1.2M/pt
Payback8 momodeled
Heat Rate Recovery
Fuel efficiency · 500 MW
High value
Current10,460Btu/kWh
Target10,280normalized baseline
Annual value$1.6Min fuel
Payback10 momodeled
Aux Load Recovery
Station service · coal unit
Medium value
Current9.8%gross
Target7.5%best-in-class band
Annual value$780Krecovered generation
Payback14 momodeled
Unplanned Maintenance
PdM-avoided outages
Medium value
CurrentBaselineforced outage rate
Target-25 to -30%with PdM
Annual value$1.1Mavoided outage cost
Payback11 momodeled
EAF — The Metric the Business Case Is Built On
Equivalent Availability Factor is the single number most CFOs will ask about first, because it maps directly to generation revenue. NERC GADS benchmarks give the business case its credibility — the model works because it starts from where your unit actually sits, not an industry footnote.
Theoretical
100%
No outages
World-class EAF
92%+
Top quartile
Industry average EAF
85-91%
Average
Underperforming EAF
Below 82%
Underperforming
Bottom-quartile aging unit
70-78%
High risk
*Illustrative: moving a 500 MW unit from 87% to 92% EAF is worth roughly $6M/year in recovered generation revenue at $1.2M per EAF point — the core number CFOs anchor the payback model on.
Where the Dollars Actually Come From
A CFO-ready model doesn't hide behind one blended ROI number — it breaks the value into the cost categories a finance team already tracks, so every dollar traces back to a line the CFO recognizes.
Lost generation revenue
45-55%
Forced and planned outages, the largest and fastest-moving lever in most models.
Excess fuel cost
20-25%
Heat rate drift versus normalized baseline, priced at current fuel cost.
Auxiliary load waste
10-15%
Station-service consumption above best-in-class benchmark for the unit type.
Unplanned maintenance
8-12%
Avoided forced-outage repair cost and expedited-parts premiums.
Regulatory exposure
3-6%
Smaller share of the model, but high-consequence when emissions or grid-code events occur.
Want your own numbers instead of these illustrative ones? Book a demo — bring 90 days of historian data and we'll build the model on your fleet.
Capex vs Opex — Same Dollars, Two Doors
Every power plant COO has two paths to the same recovered dollars. One competes for capital budget against every other project in the plan. The other is an operating line that starts paying back before the next budget cycle closes.
New Capex
"Should we fund a turbine upgrade or a new control system?"
Multi-year lead time and a scheduled outage window required
Competes with every other project in the capital committee
Payback measured in years, not months
Addresses one unit at a time
Analytics Opex
"Should we fund live analytics across the fleet instead?"
Deploys in weeks against data the historian already has
Opex line, no outage window required
Payback typically under 12 months
Scales across every unit on the fleet
How the ROI Model Is Built
A model your CFO will actually underwrite isn't built on industry averages — it's built on your own baseline, with every assumption traceable back to your historian.
01
Baseline Current KPIs
Pull 12 months of EAF, heat rate, aux load, and outage history per unit from the historian.
02
Model Value per Point
Quantify the dollar value of a 1-point EAF gain, 1% heat rate gain, and 1-point aux cut for your units.
03
Benchmark Against Peers
Compare your baseline against NERC GADS and fleet-peer benchmarks to size the realistic gap.
04
Build the Payback Timeline
Map software cost against phased value capture, month by month, to a specific payback date.
05
Present the CFO Case
A one-page model your CFO can underwrite — baseline, target, dollar value, payback — in your own units.
What a Live ROI Model Delivers
These are the figures stations typically bring into the budget cycle once the business case is built from live unit data instead of a generic vendor calculator.
<12 mo
Typical payback
on live OEE analytics
$5-8M
Annual value
modeled on a 500 MW unit
4 levers
In one model
availability, heat rate, aux, maintenance
90 days
To a CFO-ready case
from kickoff to presentation
Curious what your own ROI model would show? Talk to our team — we'll build the first pass from your historian data.
Frequently Asked Questions
How is this different from a vendor's generic ROI calculator?
A generic calculator plugs your MW rating into an industry-average template. This model starts from your own 12 months of EAF, heat rate, and aux-load history, benchmarks it against NERC GADS and fleet peers, and prices the gap at your own fuel and generation-revenue numbers — not a blended industry rate. The output is a business case your CFO can trace line by line back to your historian.
What data do you need to build our model?
Twelve months of unit-level EAF, heat rate, auxiliary load, and outage history from your historian (PI, AVEVA, or GE Historian), plus your current fuel and generation-revenue assumptions. Ninety days of clean data is enough for a first-pass model; twelve months tightens the confidence interval on the payback timeline.
How conservative are the assumptions?
Deliberately conservative. Targets are set against your own fleet's top-quartile unit or a documented industry benchmark, never a best-case outlier. Every value lever is shown with its underlying baseline and target so your finance team can stress-test the assumptions before it goes to committee.
What if we don't have 12 months of clean historian data?
Ninety days is enough to build a first-pass model with a wider confidence band, clearly labeled as such. We refine the model as more shifts of data come in after deployment, so the business case gets tighter rather than needing to be rebuilt.
How long does it take to get a CFO-ready business case?
Typically 2-4 weeks from receiving historian data to a presentation-ready model, and about 90 days from first conversation to a case in front of your capital or budget committee, including validation with your own operations and finance teams. Book a demo and we'll scope your timeline on a first call.
Stop guessing at the payback.
Build Your Own CFO-Ready ROI Model
Bring 90 days of historian data. We'll baseline your EAF, heat rate, and aux load against fleet benchmarks, quantify the value of each lever, and hand you a payback timeline built for your own budget committee.