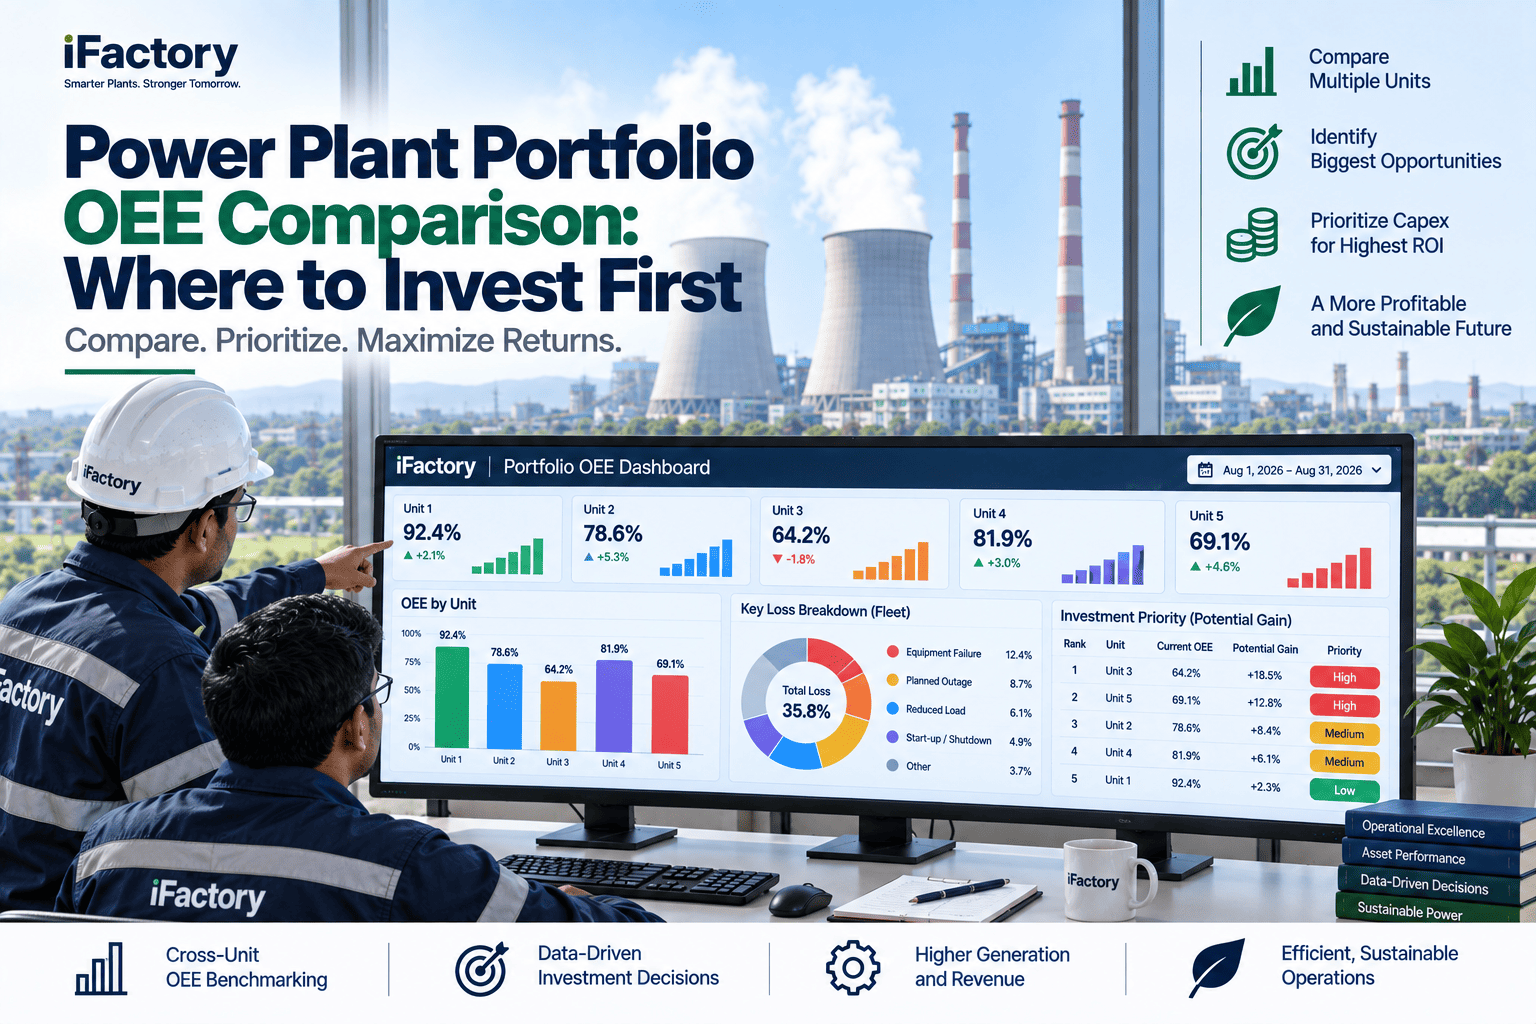
A genco running four plants doesn't have one OEE problem — it has four, each measured differently, reported on a different cadence, and almost never put on the same ruler. So when the annual capex budget gets allocated, it tends to go to whichever plant manager escalated loudest this quarter, or whichever unit had the most recent outage — not necessarily the unit sitting on the largest recoverable dollar gap. On a fleet where EAF commonly spreads 15-20 points between the best and worst unit, and where every point is worth roughly $1.2M on a 500 MW asset, that's not a rounding error — it's tens of millions of dollars in generation revenue sitting unranked across the portfolio. iFactory's Portfolio OEE Dashboard is built to put every unit — coal, gas, or renewable — on one normalized ruler, so capex follows the biggest gap instead of the loudest voice.
iFactory Portfolio OEE Dashboard
Rank Every Unit in Your Fleet by Recoverable Revenue — Not by Who Complains Loudest
One dashboard across every plant in the portfolio: EAF, heat rate, and recoverable dollar value, normalized across fuel types and ranked so capex goes to the biggest gap first.
15-20 pts
EAF spread, best vs worst unit
$1.2M
per EAF point, 500 MW unit
1 ruler
normalized across every fuel type
<90 days
to a ranked fleet-wide list
The Portfolio Ranking — What Every Unit Should Say
Portfolio-wide visibility means every unit reporting the same normalized KPIs, on one screen, ranked by dollar opportunity rather than listed alphabetically by plant name. This is what that ranking looks like across a mixed genco fleet.
Plant A · Unit 2
Coal 500 MW
Healthy
EAF91.8%top quartile
Heat rate dev.+40Btu/kWh
Recoverable value$0.6M/yrsmall gap
Capex priority#4of 4
Plant B · Unit 1
Gas CCGT 450 MW
Investigate
EAF86.1%-5.4 pts vs peer
Heat rate dev.+310Btu/kWh
Recoverable value$3.1M/yrmid gap
Capex priority#2of 4
Plant C · Unit 3
Coal 660 MW, 20+ yrs
Top priority
EAF79.4%bottom quartile
Heat rate dev.+540Btu/kWh
Recoverable value$6.8M/yrlargest gap
Capex priority#1of 4
Plant D · Unit 1
Wind 150 MW
Monitor
Availability93.5%30-day
Curtailment3.1%MTD
Recoverable value$0.9M/yrsmall gap
Capex priority#3of 4
EAF — The Same Ruler Across Every Fuel Type
A coal unit, a CCGT, and a wind farm all report EAF differently in most plant-level tools. A portfolio ranking only works if every unit is measured against the same bands — regardless of what it burns or spins.
Theoretical
100%
No outages
World-class EAF
92%+
Top quartile
Fleet average
85-91%
Average
Underperforming unit
Below 82%
Investigate
Bottom-quartile, aging
70-78%
Top capex priority
*Illustrative: a fleet with one unit at 92% EAF and another at 79% has a 13-point internal spread — worth roughly $15.6M/year in generation revenue at $1.2M per point, sitting inside the portfolio's own numbers before any external benchmark is consulted.
Where the Fleet's Recoverable Revenue Actually Sits
Not every unit in the portfolio carries the same opportunity. In most gencos, a small number of aging or underperforming units account for the majority of the addressable dollar value — which is exactly why ranking matters more than reporting.
New-build units
<5%
Already near design efficiency. Small, low-priority opportunity.
Recently upgraded
5-10%
Post-overhaul units still settling into their new baseline.
Mid-life gas / CCGT
15-20%
Steady performers with pockets of heat rate and availability drift.
Renewables
10-15%
Curtailment and availability losses, often uncounted in capex reviews.
Aging coal (20+ yrs)
45-55%
Usually where most of the portfolio's addressable value concentrates.
Want to see where your own fleet's recoverable value actually concentrates? Book a demo — bring 90 days of data across your units and we'll rank them.
Rank by Complaint vs Rank by Recovery Value — Same Capex, Two Outcomes
Every genco allocates next year's capex somehow. The question is whether the ranking is built on a normalized dollar comparison or on which plant manager got the most airtime in the last review.
Rank by Complaint
"Which unit gets next year's capex budget?"
Whichever plant manager escalates loudest gets heard first
No apples-to-apples comparison across fuel types or unit ages
Capex often follows the newest outage, not the biggest gap
Priorities get relitigated every budget cycle
Rank by Recovery Value
"Which unit gets next year's capex budget?"
Every unit scored on the same normalized dollar opportunity
Coal, gas, and renewable units compared on one common ruler
Capex follows the largest recoverable gap, not the loudest voice
Ranking updates live as units close their gap
How the Portfolio Ranking Gets Built
A fleet-wide ranking only holds up if every unit is normalized the same way before it's compared. That's the part most spreadsheet rollups skip.
01
Ingest Every Unit
EAF, heat rate, aux load, and curtailment pulled live across every plant in the portfolio, whatever the fuel type.
02
Normalize Across Fuel Types
Coal, gas, and renewable units converted to one common dollar-per-point scale so they can be ranked together.
03
Benchmark vs Peers & Self
Each unit compared against fleet peers of the same type, and against its own historical best.
04
Rank by Recoverable Value
Units sorted by total addressable dollar opportunity, largest gap first.
05
Route to Capex Committee
A ranked, dollar-quantified list ready for the next capital allocation cycle — updated as units close their gap.
What Portfolio-Wide Ranking Delivers
These are the outcomes gencos typically see after moving from plant-by-plant reporting to one normalized, ranked view of the fleet.
15-20 pts
Typical EAF spread
across a mixed fleet
$10M+
Addressable in top units
illustrative, top 3 units alone
1 ruler
Normalized comparison
across every fuel type
<90 days
To a ranked list
from kickoff to capex committee
Curious how your own fleet would rank? Talk to our team — we'll benchmark every unit on one screen.
Frequently Asked Questions
How do you compare a coal unit to a wind farm on the same ranking?
Not by comparing raw EAF or capacity factor directly — those aren't comparable across fuel types. Each unit is first benchmarked against its own fuel-type peer group (coal against coal, wind against wind), then converted into a common unit: dollars of recoverable value per year. That normalized dollar figure is what gets ranked across the whole portfolio, so a wind farm's curtailment loss and a coal unit's heat rate drift can sit on the same list.
What's different from a simple $/MWh cost comparison?
$/MWh tells you where a unit sits today, not how much of that gap is actually recoverable or what it would take to close it. The portfolio ranking separates structural cost (fuel type, unit age, design efficiency) from recoverable drift (availability loss, heat rate deviation from the unit's own baseline) — so capex gets pointed at the gap that's actually fixable, not just the unit that happens to be the most expensive to run.
Can this handle a fleet where units report to different historians or SCADA systems?
Yes. Most gencos accumulate different historians across plants through acquisitions or staggered build-outs — PI at one site, AVEVA or a local SCADA at another. The platform ingests from each source independently and normalizes into the same portfolio schema, so the ranking doesn't require standardizing every plant's underlying historian first.
How often does the ranking update?
Live, as new data arrives from each unit — typically daily for the ranking view, with underlying KPIs recalculated every interval. As a unit closes its gap after a capex project or maintenance action, its position on the list moves accordingly, so the ranking stays current rather than being a once-a-year exercise.
How long does it take to get a portfolio-wide ranking running?
Typically under 90 days from kickoff to a ranked, dollar-quantified list ready for the capex committee, depending on how many plants and historian sources are in scope. Bring 90 days of unit-level data from two or three plants and we'll show you a first-pass ranking on a call.
Stop funding whoever complains loudest.
Rank Your Entire Fleet by Recoverable Revenue
Bring 90 days of unit-level data across your fleet. We'll normalize every plant onto one dollar-per-point ruler, rank them by recoverable value, and hand you a list ready for the next capex cycle.
Normalized
across fuel types