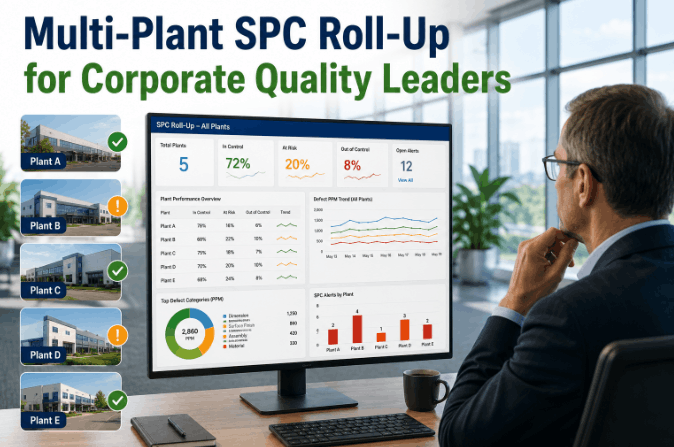
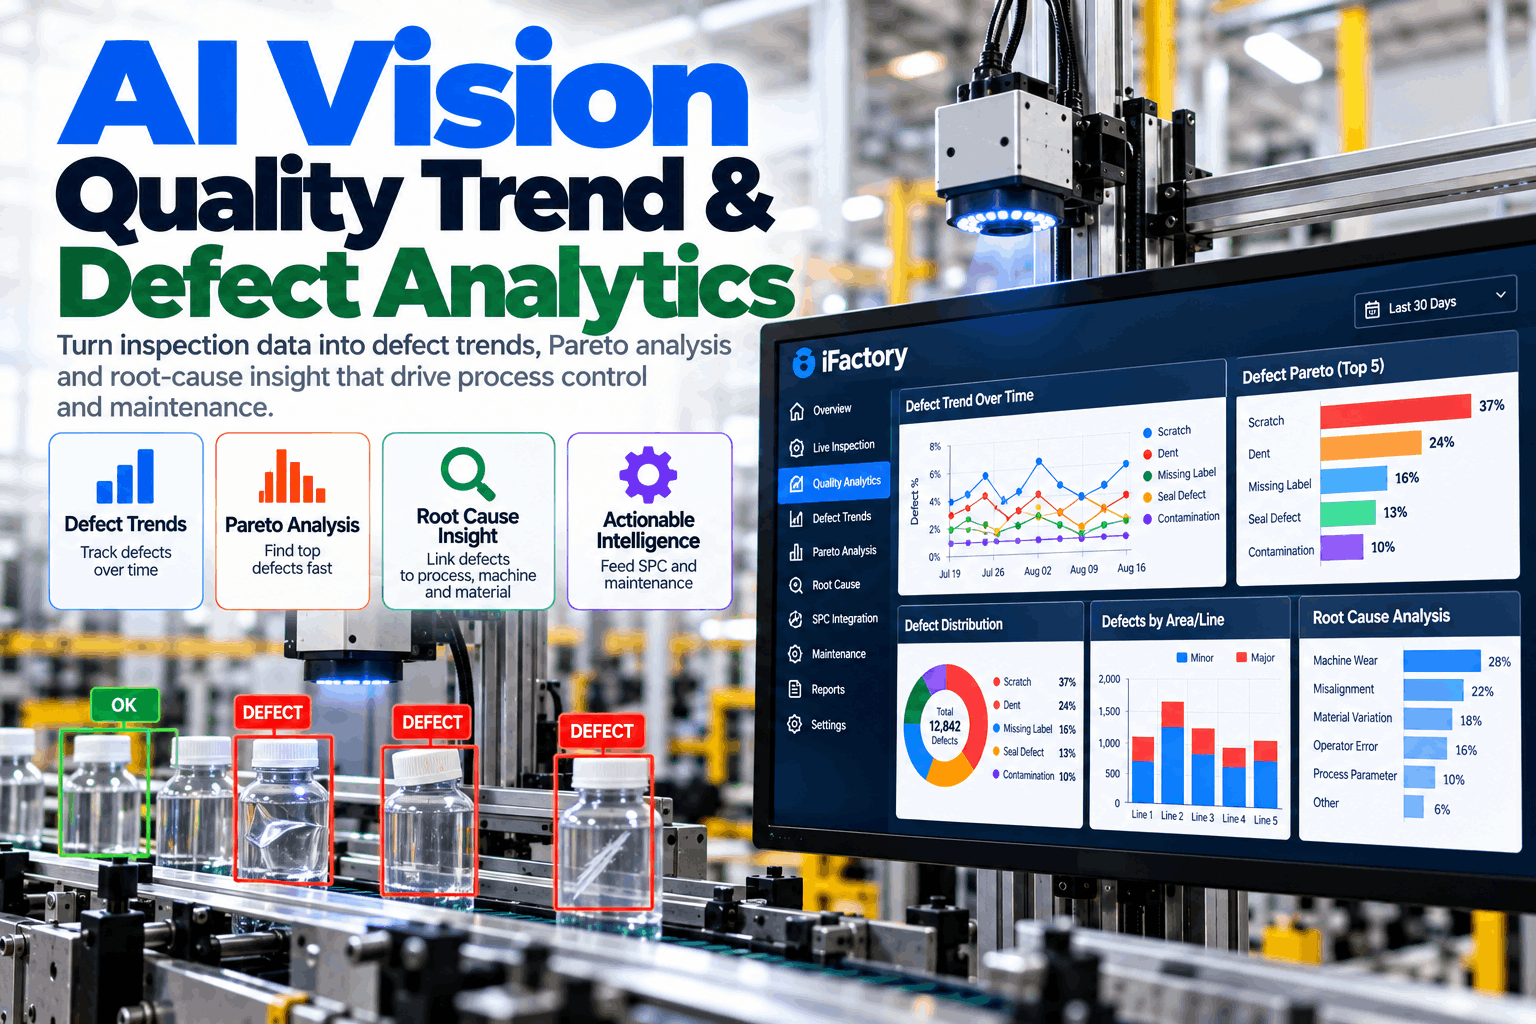
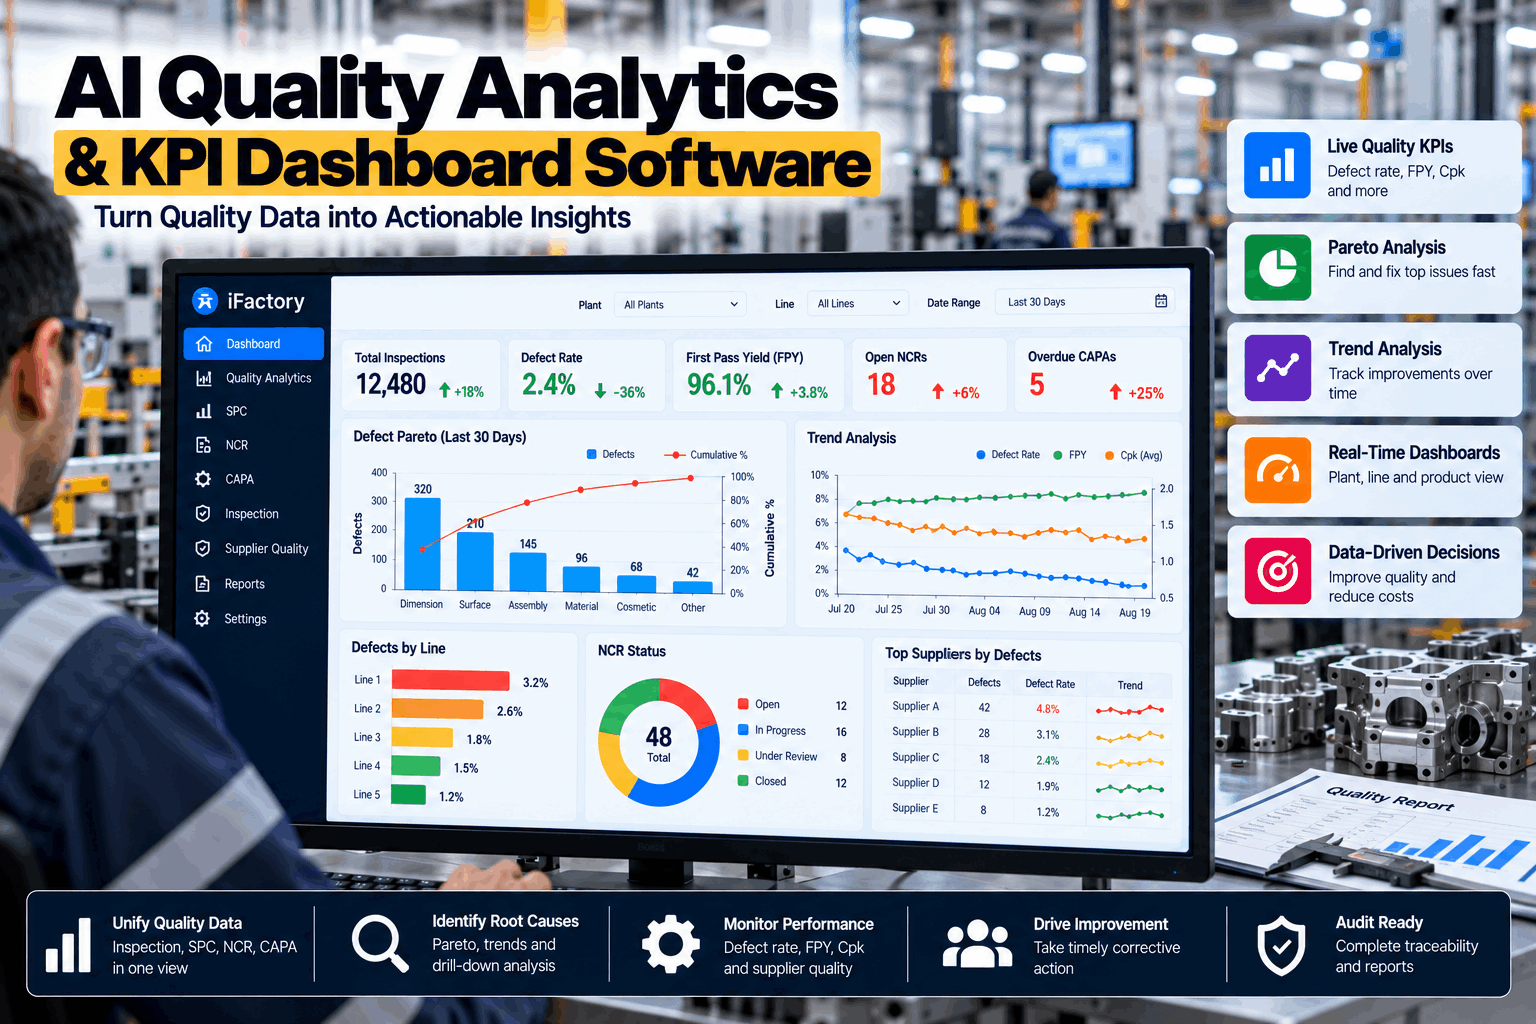
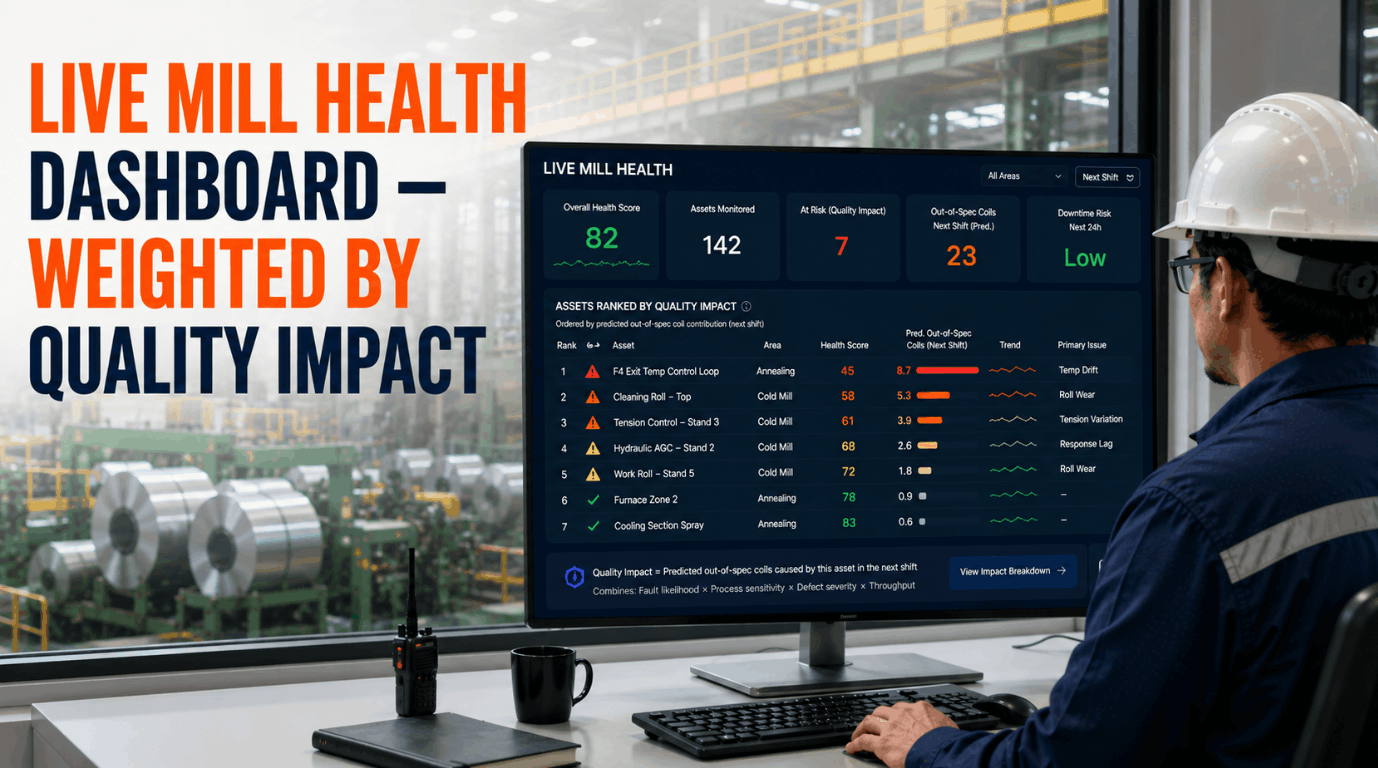
Most multi-site quality organizations are managing a reporting problem disguised as an analytics problem. Every plant has a historian, a quality system, and a set of SPC charts — but none of them talk to the same corporate dashboard. The VP of Quality spends Monday morning reconciling twelve spreadsheets from twelve plants, converting Cpk values from different systems into a common format, and trying to determine whether a defect rate increase at Plant 6 is a statistical outlier or a genuine process shift. By the time the analysis is complete, the window for corrective action has closed. iFactory's multi-plant SPC roll-up architecture connects to your existing systems at each site through MSMQ, normalizes Cpk, scrap rate, OEE, and throughput data into a single canonical model, and delivers a live corporate quality view that refreshes in real time — without replacing the historian, MES, or quality software already running at each plant. Book a Demo to see your plant network in a single live corporate quality dashboard.
Live
Cpk, OEE, scrap, and defect rates across every plant — one screen, real-time refresh
Zero
Existing plant systems replaced — MSMQ connector reads without modifying local infrastructure
12 Plants
One dashboard replaces twelve individual quality reports and manual Monday morning reconciliation
SPC + AI
Western Electric and Nelson rules applied at corporate level — not just per-plant alert thresholds
Stop chasing plant reports. Start managing quality across your entire network in real time.
iFactory's live corporate quality dashboard aggregates Cpk, OEE, scrap, and defect rates from every plant into one view — without ripping out any existing plant system.
The Real Cost of Fragmented Multi-Plant Quality Reporting
Corporate quality leaders at multi-site manufacturers face a structural information gap that is rarely described accurately in project justifications. The problem is not that quality data does not exist — it is that quality data exists in incompatible formats, incompatible systems, and incompatible time horizons at every plant in the network. The downstream cost of that fragmentation is measurable in ways that go well beyond Monday morning reporting time.
Delayed Escape Detection
A Cpk decline at one plant that would be immediately visible in a network-level SPC chart goes undetected for days when plant-level data arrives in weekly reports. By the time the trend is confirmed, suspect product has already shipped.
Incomparable Plant Benchmarking
When each plant calculates Cpk using different subgroup sizes, different sampling windows, and different calculation methods, plant-to-plant comparison is meaningless. Process improvement resources flow to the wrong plants based on data artifacts, not genuine performance differences.
Reporting Cycle Latency
Weekly or monthly quality report cycles mean corporate quality leaders are always managing the past. Corrective actions are approved for problems that either resolved themselves or worsened significantly while the approval process ran its course.
Manual Consolidation Overhead
Quality engineers at each plant spend hours each week preparing reports in the format the corporate team requires. That time does not generate any quality improvement — it consumes engineering capacity that should be applied to root cause analysis and process correction.
How iFactory's Multi-Plant Roll-Up Architecture Works
iFactory's corporate quality roll-up is built on a three-layer architecture that connects to existing plant systems, normalizes quality data into a consistent canonical model, and aggregates it into a live corporate view without requiring any plant to change its local quality infrastructure.
01
Plant-Level MSMQ Connector
At each plant, iFactory's MSMQ connector reads quality data from existing historians (OSIsoft PI, Aspentech IP21, GE Proficy), MES platforms (SAP ME, Rockwell Plex, Infor), and LIMS systems. The connector operates in read-only mode, requiring no changes to plant systems, no new data exports, and no plant IT involvement beyond connector installation.
Compatible with: OSIsoft PI · Aspentech IP21 · SAP ME · Rockwell Plex · Infor · most LIMS via REST/JDBC
02
Cross-Plant Data Normalization
Raw quality data from each plant passes through iFactory's normalization engine, which standardizes Cpk calculation methodology (subgroup size, distribution assumptions, and short-term vs. long-term), aligns OEE calculation across different MES definitions, and maps plant-specific defect codes to a corporate defect taxonomy. Normalization rules are configured once and maintained centrally.
Normalizes: Cpk · Ppk · OEE · Scrap rate · Defect rate · First-pass yield · Throughput variance
03
Live Corporate AI Platform
Normalized data from all plants rolls up into the iFactory corporate AI platform, which maintains a live multi-plant quality dashboard, applies network-level SPC logic to identify cross-plant trends, and surfaces AI-generated insights about which plants are performing above network average, which are trending toward Cpk non-conformance, and where process improvement resources will generate the highest return.
Delivers: Live Cpk by plant · Network SPC charts · Plant benchmarking · Defect Pareto · AI quality Copilot
Corporate Quality Dashboard: What Every Multi-Site VP Actually Sees
The iFactory corporate quality dashboard is designed for a senior quality leader who needs to assess network-wide quality posture in under three minutes and drill into a specific plant's data in under thirty seconds — not for a quality engineer who needs raw SPC charts. The dashboard view is organized around the decisions a corporate quality leader actually makes.
| Dashboard Module |
What It Shows |
Refresh Cadence |
Alert Trigger |
| Network Cpk Heatmap |
Cpk value by plant, by product family, color-coded to corporate specification thresholds (green ≥ 1.67, yellow 1.33–1.67, red < 1.33) |
Real-time |
Any plant Cpk drops below threshold or shows two-consecutive-period decline |
| Scrap and Defect Rate Roll-Up |
Scrap rate (% of production) and defect rate (PPM or DPMO) by plant and by product, with period-over-period trend and network average comparison |
Shift-end push + real-time |
Plant scrap rate exceeds network average by configurable sigma threshold |
| OEE by Plant |
Overall Equipment Effectiveness broken into Availability, Performance, and Quality components — with the Quality component linked directly to the defect rate data |
Real-time |
OEE Quality component drops below target — isolates whether OEE decline is quality-driven or availability-driven |
| Network SPC Charts |
Cross-plant control charts for shared process variables — identifies when a common input (material, process parameter) is causing correlated quality shifts across multiple plants simultaneously |
Real-time |
Out-of-control signal per Western Electric Rules applied at network level |
| Plant Benchmarking Rank |
Plants ranked by composite quality score — Cpk, defect rate, first-pass yield, and scrap — with period-over-period movement to show which plants are improving and which are declining |
Daily summary + real-time |
Plant rank drops two or more positions period-over-period — triggers AI root cause investigation prompt |
| AI Quality Copilot |
Conversational interface for cross-plant queries — "Which plant has the highest defect rate on Part #XYZ this quarter?" — answered from normalized network data |
On-demand |
Proactive weekly AI quality brief summarizing network trends and recommended actions by plant |
Plant Benchmarking That Drives Real Improvement Decisions
The most valuable capability in a corporate quality roll-up is not seeing that Plant 6 has a lower Cpk than Plant 4 — it is understanding whether that difference reflects a genuine process capability gap, a measurement system difference, a product mix difference, or a short-term statistical variation. iFactory's benchmarking module is designed to answer that question, not just surface the number.
Apples-to-Apples Cpk
Cpk values normalized to the same subgroup size, the same distribution assumption, and the same measurement window across all plants — so a Cpk of 1.45 at Plant 3 means exactly what it means at Plant 9, regardless of which local quality system generated it.
Product Mix Adjustment
Plant quality scores adjusted for product mix — a plant running a higher proportion of tight-tolerance parts is not penalized in the benchmark against a plant running commodity volume. Corporate leaders see mix-adjusted performance, not raw numbers that reflect portfolio differences.
Best-Practice Transfer
When Plant 7 achieves Cpk 1.82 on a part family that Plant 2 is running at Cpk 1.31, iFactory's AI identifies the process parameter differences between the two plants and surfaces them as a structured improvement recommendation — not a manual analysis request to a process engineer.
Trend-Based Intervention Prioritization
Plants are ranked not only by current performance but by trajectory. A plant at Cpk 1.55 declining for three consecutive periods receives higher intervention priority than a plant at Cpk 1.40 that has been stable — because trajectory predicts where corporate quality resources will have impact.
Expert Review: What Multi-Site Quality Leaders Miss in SPC Roll-Up Projects
Every multi-plant SPC roll-up project I have been involved in starts with the same assumption: get the data out of each plant and into one place, and the insights will follow. That assumption is wrong in practice. If you aggregate raw Cpk values calculated differently at each plant, you get a corporate dashboard that looks authoritative but is actually noise. The normalization step — agreeing on a single calculation methodology and enforcing it at ingestion — is where corporate quality projects succeed or fail. iFactory enforces normalization at the connector level, before data reaches the corporate platform. That is architecturally correct. You cannot normalize data after it has been aggregated; you have to do it before.
Corporate Quality Director
Multi-Site Discrete Manufacturing, 22 Years — ASQ CQE, Six Sigma Master Black Belt
The question corporate quality teams should ask about any multi-plant SPC roll-up platform is not "can you show me Cpk by plant?" Every analytics tool can produce that chart. The question is: "When Plant 6's Cpk drops, can you tell me within one shift whether it is a measurement system issue, a process input issue, or a product mix issue — and can you do that without requiring my quality engineer at Plant 6 to run a manual analysis?" That is the difference between a reporting tool and a quality intelligence platform. The answer to that question determines whether you bought a dashboard or a decision support system.
VP of Quality, Multi-Site Manufacturer
Automotive and Industrial Components, 17 Years — IATF 16949 Lead Auditor
Frequently Asked Questions
Conclusion: One View, Every Plant, Real Time
The multi-plant quality intelligence gap is a solved problem at the architectural level — the challenge has never been data availability, it has been normalization, aggregation, and surfacing the right insights at the right level of the quality organization. iFactory's multi-plant SPC roll-up closes that gap without requiring a rip-and-replace at any plant in the network. MSMQ connectors at each site read from existing systems, normalization rules enforce calculation consistency before data reaches the corporate platform, and the AI-powered corporate dashboard delivers live Cpk, OEE, scrap, and defect data across the entire plant network in a view that supports the decisions corporate quality leaders actually make. The Monday morning report becomes a real-time dashboard. The week-old quality data becomes a live quality signal. And the process improvement resources that were previously allocated based on incomplete, inconsistent reporting get directed to the plants and processes where they will generate the highest return.
One Live Corporate Quality Dashboard — Every Plant, Every Metric, No Manual Reports
iFactory connects to every plant's existing quality systems through MSMQ, normalizes Cpk, OEE, scrap, and defect data into a consistent corporate model, and delivers a real-time multi-site quality intelligence platform without replacing anything currently running at any plant.
Live Multi-Plant Cpk
Network SPC Charts
Zero System Replacement
Plant Benchmarking
AI Quality Copilot