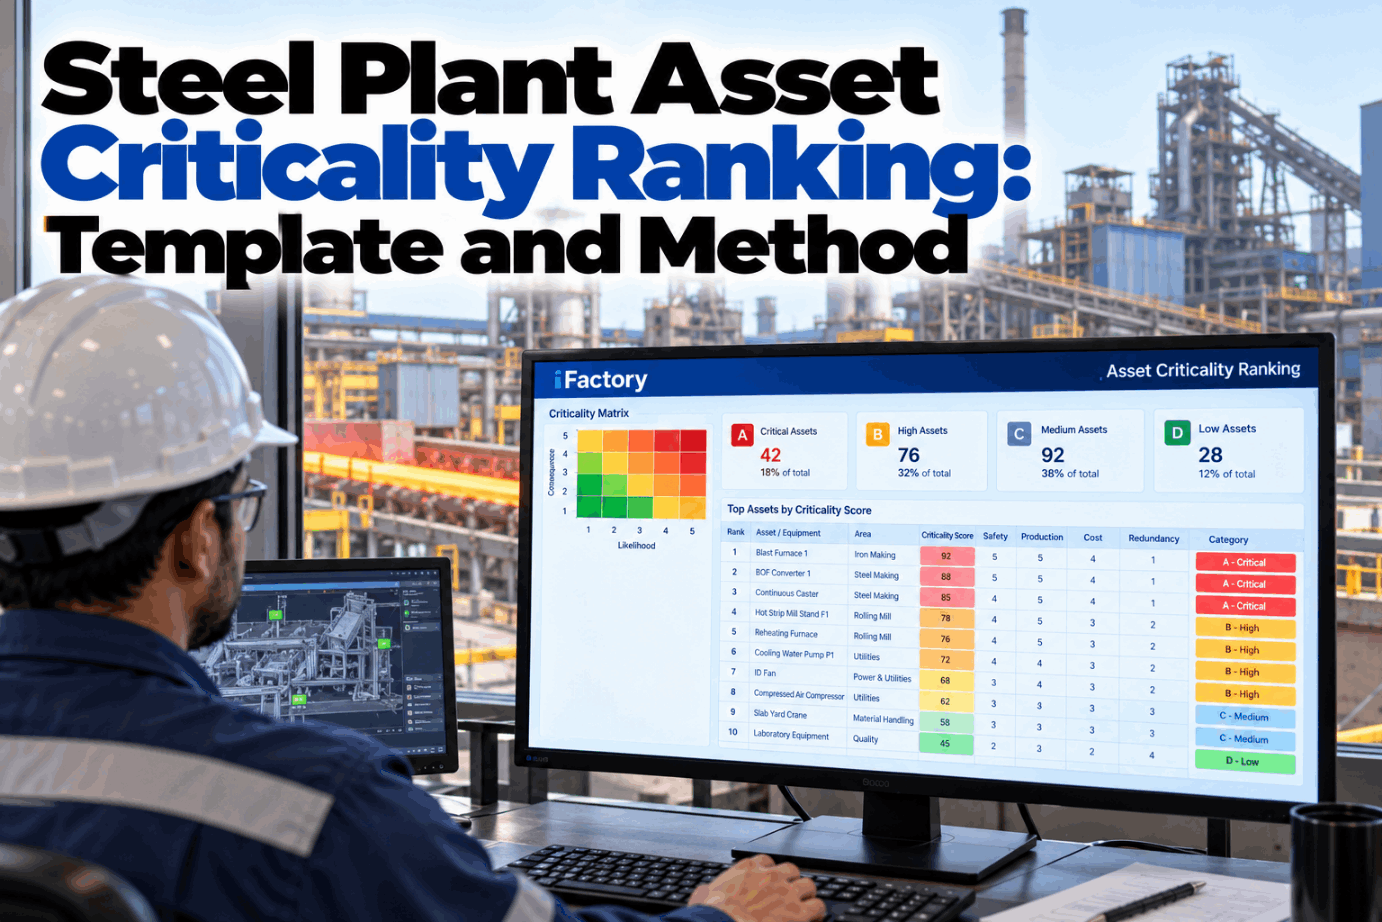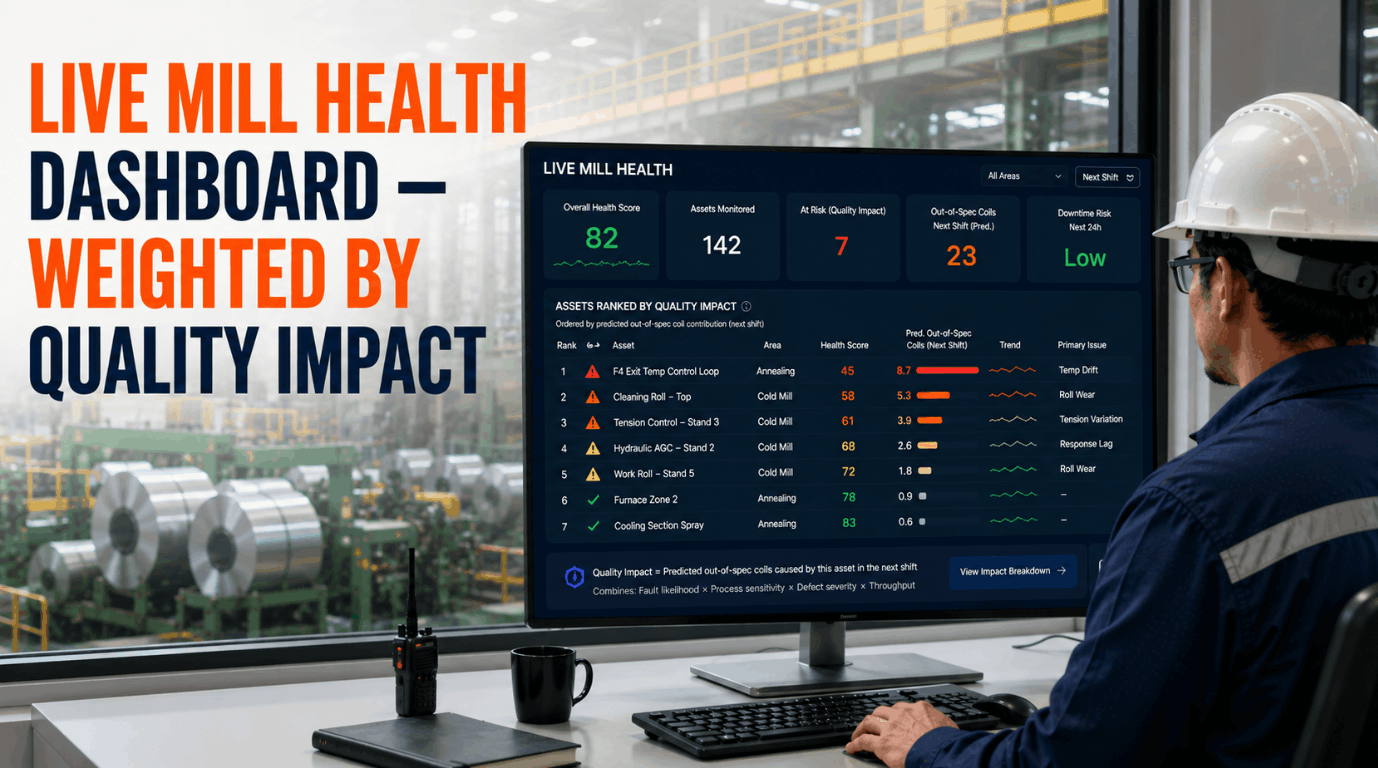
Most rolling mill reliability programs rank equipment by alarm count, fault frequency, or maintenance backlog — and most of them make the wrong call at shift change as a result. A drive that fires 40 alarms per hour on a bridle roll influencing flatness on automotive exposed panel is a different priority than a drive firing 40 alarms on a coiler pinch roll that only affects reel tail. Alarm count is a volume metric. Quality impact is an outcome metric. iFactory AI's Live Mill Health Dashboard reorders your entire asset list by the one number that actually matters to production: how many out-of-spec coils will this asset cause next shift if nothing changes. Book a Demo to see quality-weighted asset ranking live across your mill.
Stop Ranking Assets by Alarm Count. Rank by Next-Shift Quality Impact.
iFactory AI's Live Mill Health Dashboard orders every asset in your rolling mill by its projected out-of-spec coil contribution — giving plant reliability managers a single, actionable priority list that connects equipment health to production outcomes.
Why Alarm-Count Dashboards Produce the Wrong Priority List
Traditional mill health dashboards were designed around one question: what is generating the most alarms? It is a reasonable starting point and a genuinely terrible finishing point. Alarm count reflects how often an asset deviates from its configured setpoint — it says nothing about what that deviation does to the strip. A temperature excursion on a finishing stand work roll cooling header generates a high-severity alarm. The same alarm on a descaler spray bar in a zone serving structural grades may be operationally irrelevant for the next four hours. Both show up identically in an alarm-count dashboard. The reliability manager dispatches to the loudest fault, not the most damaging one.
The consequence shows up in production quality reports, not in the alarm log. Out-of-spec coils, surface defect escapes, flatness rejections, and coating weight deviations trace back to assets that were deprioritized because they were not generating the most alerts. iFactory AI's quality-weighted mill health approach inverts this by asking: given the current degradation state of every asset and the upcoming production schedule, which equipment will produce the most out-of-spec coils next shift? The answer is frequently a different list than the alarm board. Book a Demo to run this comparison against your own alarm history.
How iFactory AI Calculates Quality-Impact-Weighted Asset Rankings
Quality-impact weighting is not a manual scoring exercise updated quarterly. It is a continuously recalculated AI ranking that combines real-time asset health signals with the upcoming production schedule, grade mix, and historical defect causality data for your specific mill. Every asset in the plant receives a dynamic quality-impact score that updates with each coil, each grade transition, and each shift.
Real-Time Asset Degradation State
iFactory AI ingests vibration spectra, motor current signatures, thermal profiles, hydraulic pressure deviations, and process variable drift for every monitored asset. Each signal is mapped to a degradation index that represents current distance from the asset's normal operating envelope — updated continuously, not at shift end.
Next-Shift Production Schedule & Grade Mix
The AI pulls the upcoming production order queue — coil sequence, grade specifications, gauge targets, surface class requirements — from the MES or scheduling system. An asset's quality impact is always calculated relative to what is actually being produced, not a generic average. The same hydraulic gap control fault carries different weight for an automotive Class A coil versus a structural plate.
Historical Defect Causality Model
iFactory AI's causality model is trained on the mill's own defect history — linking specific process variable deviations to specific defect outcomes across each product class. This is not a generic industry model; it is calibrated on your mill's actual defect-cause relationships, making the quality-impact ranking specific to your process, your grades, and your customer specifications.
Quality-Impact Asset Ranking — Live, Every Shift
The three inputs combine into a single ranked list: assets ordered by their projected contribution to out-of-spec coils in the next shift window. The ranking is visible on the Live Mill Health Dashboard, pushed to shift supervisor tablets at handover, and used to automatically sequence maintenance dispatch work orders by quality consequence — not alarm count.
What the Live Mill Health Dashboard Covers — and What Changes on the Priority List
The Live Mill Health Dashboard monitors every critical asset position across the rolling mill and galvanizing or coating lines. The table below illustrates the typical difference between alarm-count ranking and quality-impact ranking for common mill asset classes — the shift in priority is the core value delivered to the plant reliability manager. Book a Demo to see how your mill's asset list reorders under quality-weighted ranking.
| Asset / System | Alarm-Count Priority | Quality-Impact Priority | Key Quality Linkage |
|---|---|---|---|
| Finishing Stand Hydraulic Gap Control | Mid — 12–18 alarms/shift | Top 3 — Gauge deviation on automotive grades | Direct gauge tolerance exceedance on Class A product |
| Work Roll Cooling Header (F3–F5) | High — 30+ alarms/shift | Top 5 — Roll thermal crown, flatness impact | Crown deviation → flatness reject on thin gauge |
| Entry Coil Box / Furnace Temperature Zone | Low — 3–6 alarms/shift | Top 2 — Mechanical properties on HSLA grades | Temperature uniformity drives yield strength compliance |
| Bridle Roll Drive (Tension Control) | Low — 2–4 alarms/shift | Top 4 — Strip tension instability, surface marks | Tension variation drives elongation and surface defects |
| Descaler Spray Bar (Structural Zone) | High — 25+ alarms/shift | Bottom 8 — Low quality impact on current schedule | Scale removal non-critical for current structural product mix |
| Coiler Pinch Roll Drive | High — 40+ alarms/shift | Bottom 10 — Coil tail only, non-prime material | Only affects reel tail — limited customer quality exposure |
| Zinc Bath Temperature Control (CGL) | Mid — 10–15 alarms/shift | Top 1 — Coating weight deviation, adhesion failure | Direct coating specification compliance for automotive OEM |
Live Mill Health Dashboard: What Plant Reliability Managers See and Act On
The Live Mill Health Dashboard is designed for the reliability manager's workflow — shift handover, maintenance dispatch, and production quality accountability — not for data scientists. Every view is calibrated to answer an operational question, not to display data comprehensiveness.
Quality-Impact Asset Ranking Panel
The primary dashboard view lists every monitored asset ranked by its current quality-impact score. Each asset entry shows current degradation state, the specific defect type it is projected to generate, the grade most affected in the next-shift schedule, and the estimated out-of-spec coil count if no intervention occurs. The ranking updates every four minutes and is visible on shared shift displays, supervisor tablets, and the reliability manager's workstation simultaneously.
Shift Handover Quality Risk Summary
At configurable intervals before shift change, iFactory AI generates an automatic shift handover report that summarizes the top-5 quality-risk assets, their current degradation trajectory, and the recommended action for each — inspect, adjust, or schedule replacement. The report is delivered to the outgoing and incoming reliability manager simultaneously, eliminating the information loss that consistently occurs during verbal handovers.
Defect-to-Asset Causality Tracing
When a quality event occurs — an out-of-spec thickness reading, a surface defect flag from the inspection camera, a flatness measurement outside tolerance — the dashboard traces the event backward through the causality model to the contributing asset and the specific process variable deviation. This closes the loop between quality outcome and reliability action, replacing post-production forensic analysis with real-time root cause identification.
Fleet Health Trend & Weekly Quality-Impact Reporting
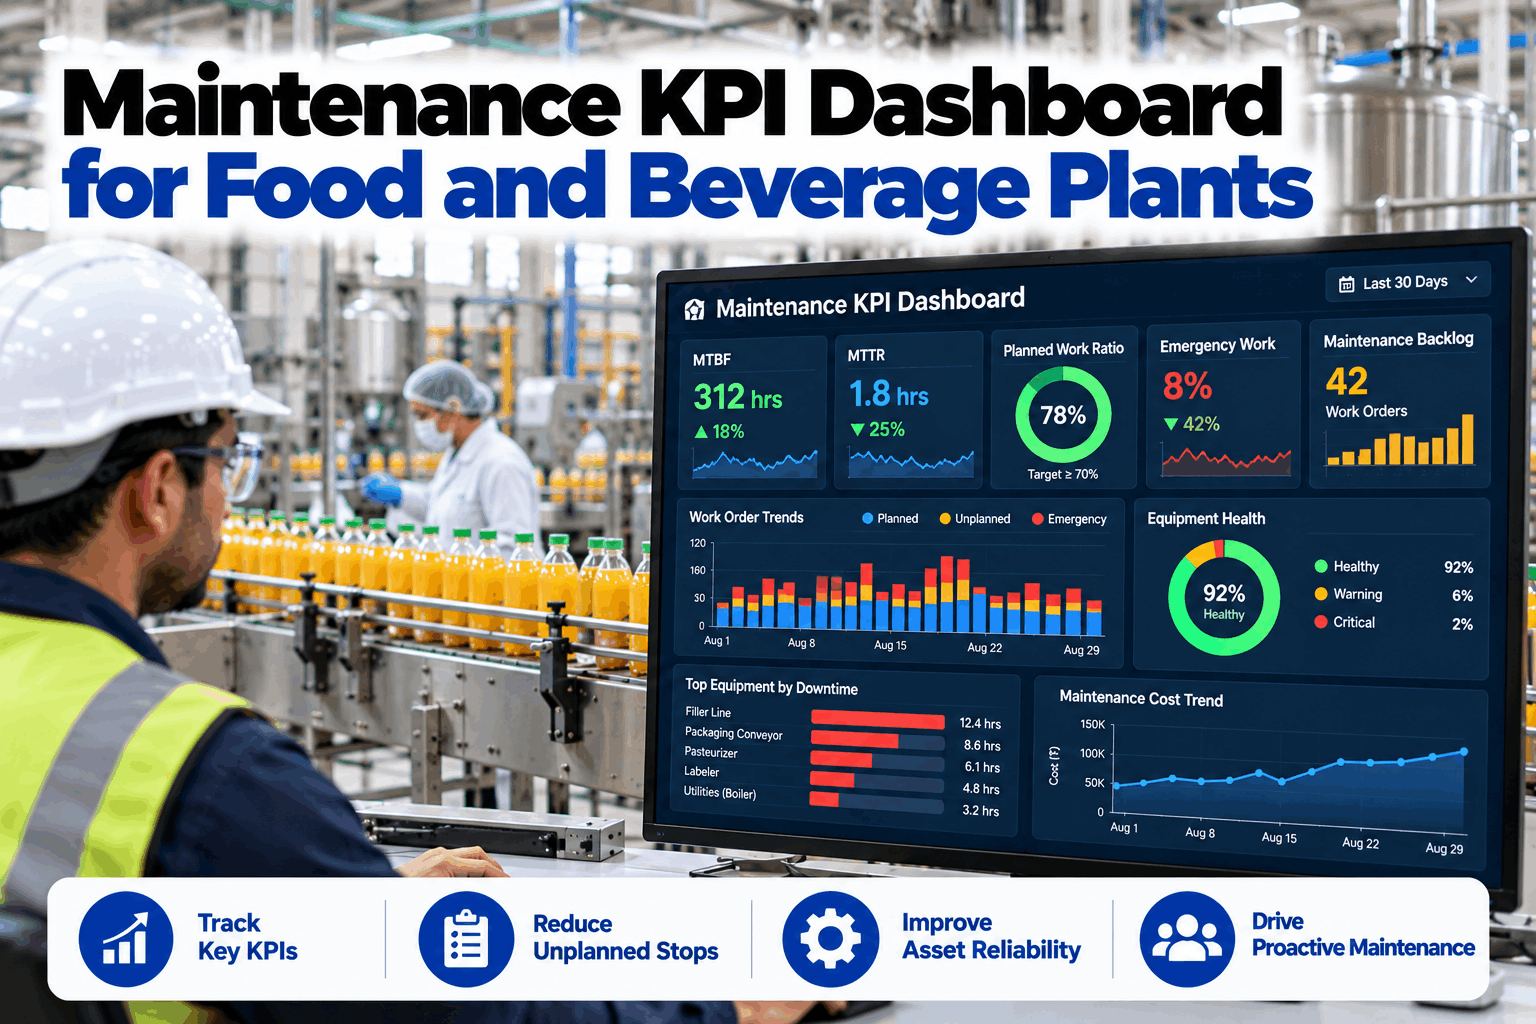
Beyond shift-level decisions, the dashboard provides week-over-week fleet health trend reporting that shows which assets are trending toward higher quality-impact scores, which engineering controls have reduced quality risk, and which product grades carry the highest asset-health sensitivity. This weekly view supports the reliability manager's program justification, capital planning, and chronic failure elimination work — connecting condition monitoring to business outcomes in language the operations and finance teams understand.
See Your Mill's Asset List Reordered by Quality Impact — Live
iFactory AI's Live Mill Health Dashboard delivers quality-weighted asset rankings updated every four minutes, shift handover reports, and defect-to-asset causality tracing — all in one reliability manager dashboard.
The Operational Impact of Quality-Weighted Mill Health on Reliability Program Performance
The financial case for quality-weighted reliability ranking is built on two parallel value streams: fewer out-of-spec coils reaching customers, and better utilization of the maintenance resource hours that are already available. Most mills are not under-resourced in maintenance labor — they are misinvesting it. Shifting dispatch priority from alarm volume to quality impact reallocates existing hours toward the interventions that prevent the most costly outcomes.
| Performance Area | Alarm-Count Prioritization | Quality-Impact Ranking (iFactory AI) | Typical Benefit |
|---|---|---|---|
| Out-of-Spec Coils per Month | 18–24 events per line | 7–10 events per line | –58% quality escapes |
| Shift Handover Decision Time | 25–40 min manual review | Under 8 min with AI summary | 70% faster handover |
| Maintenance Hours on High-Impact Assets | 38% of available hours | 74% of available hours | Near-doubled allocation accuracy |
| Customer Quality Claims | 8–14 per quarter | 2–4 per quarter | –72% claim reduction |
| Post-Production Defect Investigations | 4–8 hrs per event | Under 30 min per event | Real-time causality tracing |
| Reliability Program ROI Visibility | Annual review — anecdotal | Weekly — quality outcome linked | Business-language reporting |
Expert Perspective: What Plant Reliability Managers Need from Mill Health Dashboards in 2026
Reviewed by a plant reliability manager with eighteen years of experience across hot strip mills, cold rolling complexes, and continuous galvanizing lines in U.S. flat-rolled steel operations. The following observations reflect current practice in reliability program management and the specific gaps that quality-weighted dashboards are designed to address.
The most persistent failure mode in mill reliability programs is not technical — it is informational. Reliability managers receive accurate data about asset condition and inaccurate data about its operational consequence. A dashboard that shows vibration amplitude trending upward on a finishing stand drive tells the reliability manager something is degrading. It does not tell them whether to act before the next coil, before the next shift, or before the next scheduled maintenance window. That decision requires knowing what is on the production schedule, what grade is running, and what the historical relationship is between that specific vibration signature and that specific product's quality outcome. Without that context, the manager defaults to the conservative call — which usually means interrupting production for an intervention that could have waited, or missing an intervention that could not.
What quality-weighted ranking provides is not more data — it is more context. The asset list that a reliability manager reviews at shift handover should be ordered by the answer to one question: if I do nothing about this asset for the next eight hours, how many coils will I regret? iFactory AI's approach answers that question directly, and it answers it differently for every shift based on what is actually being produced. That is a fundamentally more useful instrument than an alarm count board, and the reliability managers who have adopted it consistently report that it changes both the quality of their decisions and their confidence in making them. Book a Demo to discuss quality-weighted reliability architecture for your specific mill configuration.
Deploying the Live Mill Health Dashboard: From Data Audit to Live Quality Rankings
Implementation follows a structured phased approach that delivers first quality-impact rankings within six weeks of kickoff, without requiring new sensor installations in most mills and without interrupting production operations.
Asset Inventory & Defect History Audit
iFactory engineers map monitored asset positions, available sensor outputs, and historian data sources. Minimum 12 months of defect records, quality hold logs, and alarm history are ingested to initialize the causality model. Signal gaps are identified and addressed before model training.
Causality Model Training & Grade-Class Calibration
The AI causality model is trained on the mill's own defect-cause data, with quality-impact thresholds calibrated separately for each product class — automotive, structural, coated, and pipe grades. Grade-specific weighting ensures the ranking reflects your customer specifications, not generic steel industry averages.
Shadow Mode Validation & Ranking Accuracy Review
Shadow Mode Validation & Ranking Accuracy Review
Quality-impact rankings run in parallel with the existing alarm dashboard for two weeks. Reliability managers review ranking outputs against actual quality outcomes daily, and threshold parameters are adjusted until forecast accuracy reaches the 85%+ target before live deployment.
Live Dashboard & CMMS Integration
Live quality-impact rankings go active across the reliability manager dashboard, shift supervisor tablets, and CMMS work order queue. Shift handover reports are configured and automated. The model continues to improve with each quality event, incorporating new defect-cause relationships into the causality model automatically.
Live Mill Health Dashboard — Frequently Asked Questions
Mill Health Is Not an Alarm Problem. It Is a Quality Outcome Problem.
The reliability manager who walks into a shift handover holding a list of the 10 noisiest assets is not holding the list that matters. The list that matters ranks assets by the answer to a single operational question: which of these, if I let it run as-is for the next eight hours, will produce the most coils I will have to hold, rework, or explain to a customer? That is a different list, it requires different data to build, and it produces different maintenance decisions when acted on.
iFactory AI's Live Mill Health Dashboard delivers that list — recalculated every four minutes, calibrated to your grade mix, and connected to your CMMS for automated dispatch. For plant reliability managers accountable for both equipment uptime and production quality, this is the convergence point between condition monitoring and quality assurance that has been missing from mill operations technology for years.
The Priority List Your Shift Has Needed. Live, Every Four Minutes.
iFactory AI's Live Mill Health Dashboard ranks every asset by next-shift quality impact — not alarm count. Shift handover reports, defect causality tracing, and automated CMMS dispatch included. Live within 7 weeks.