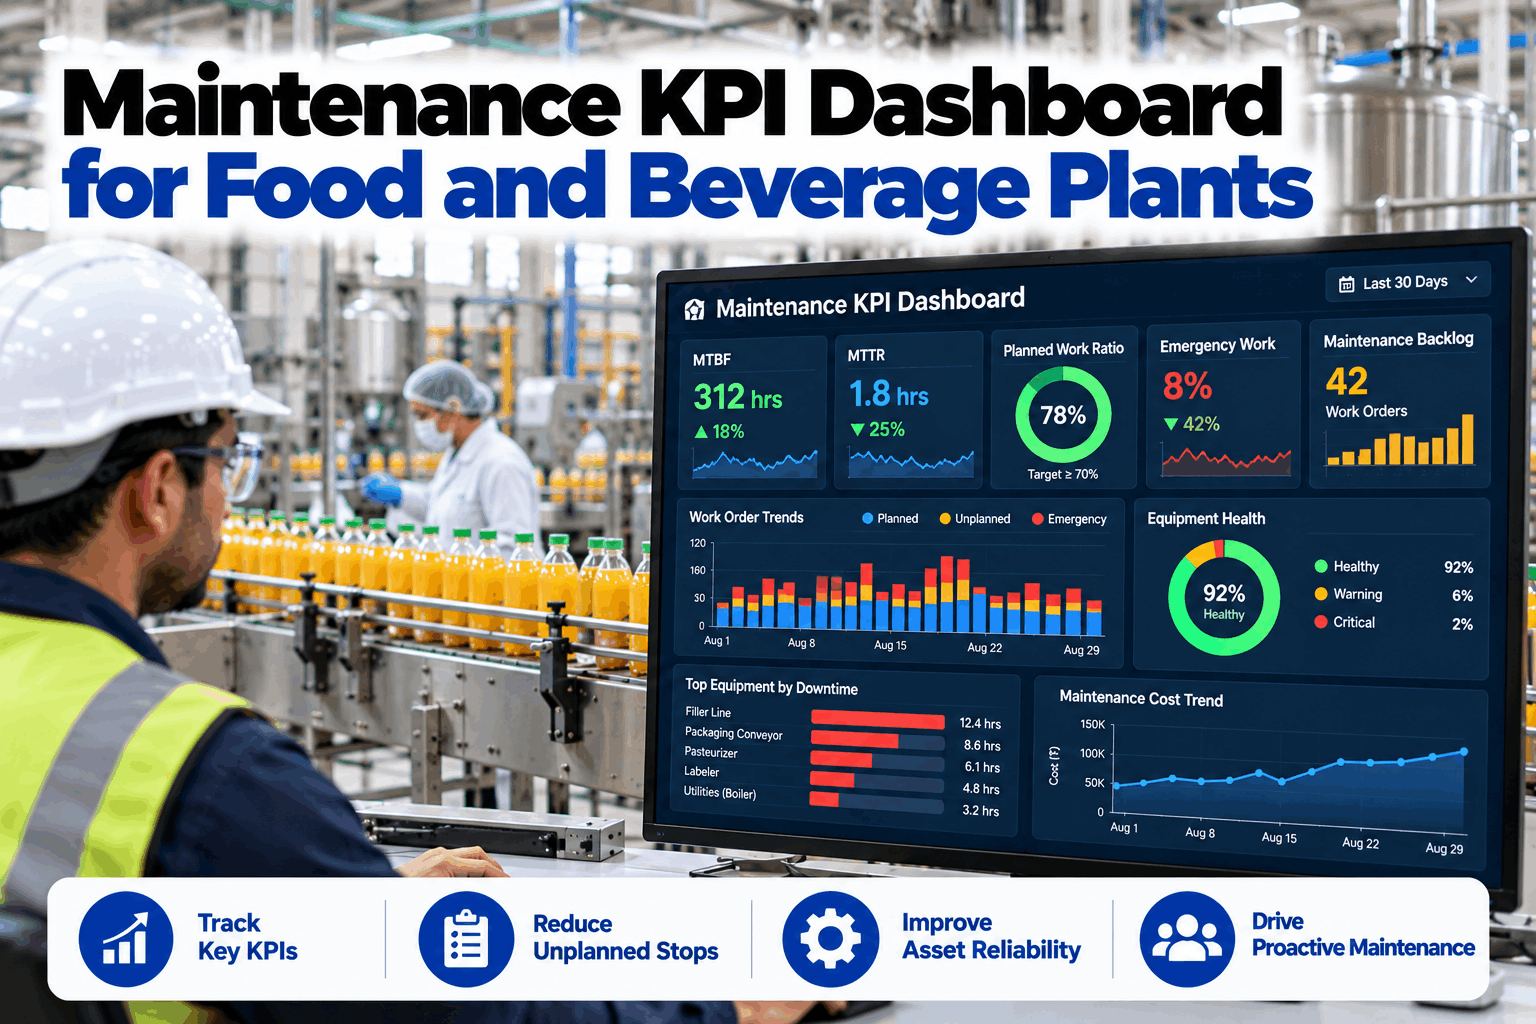
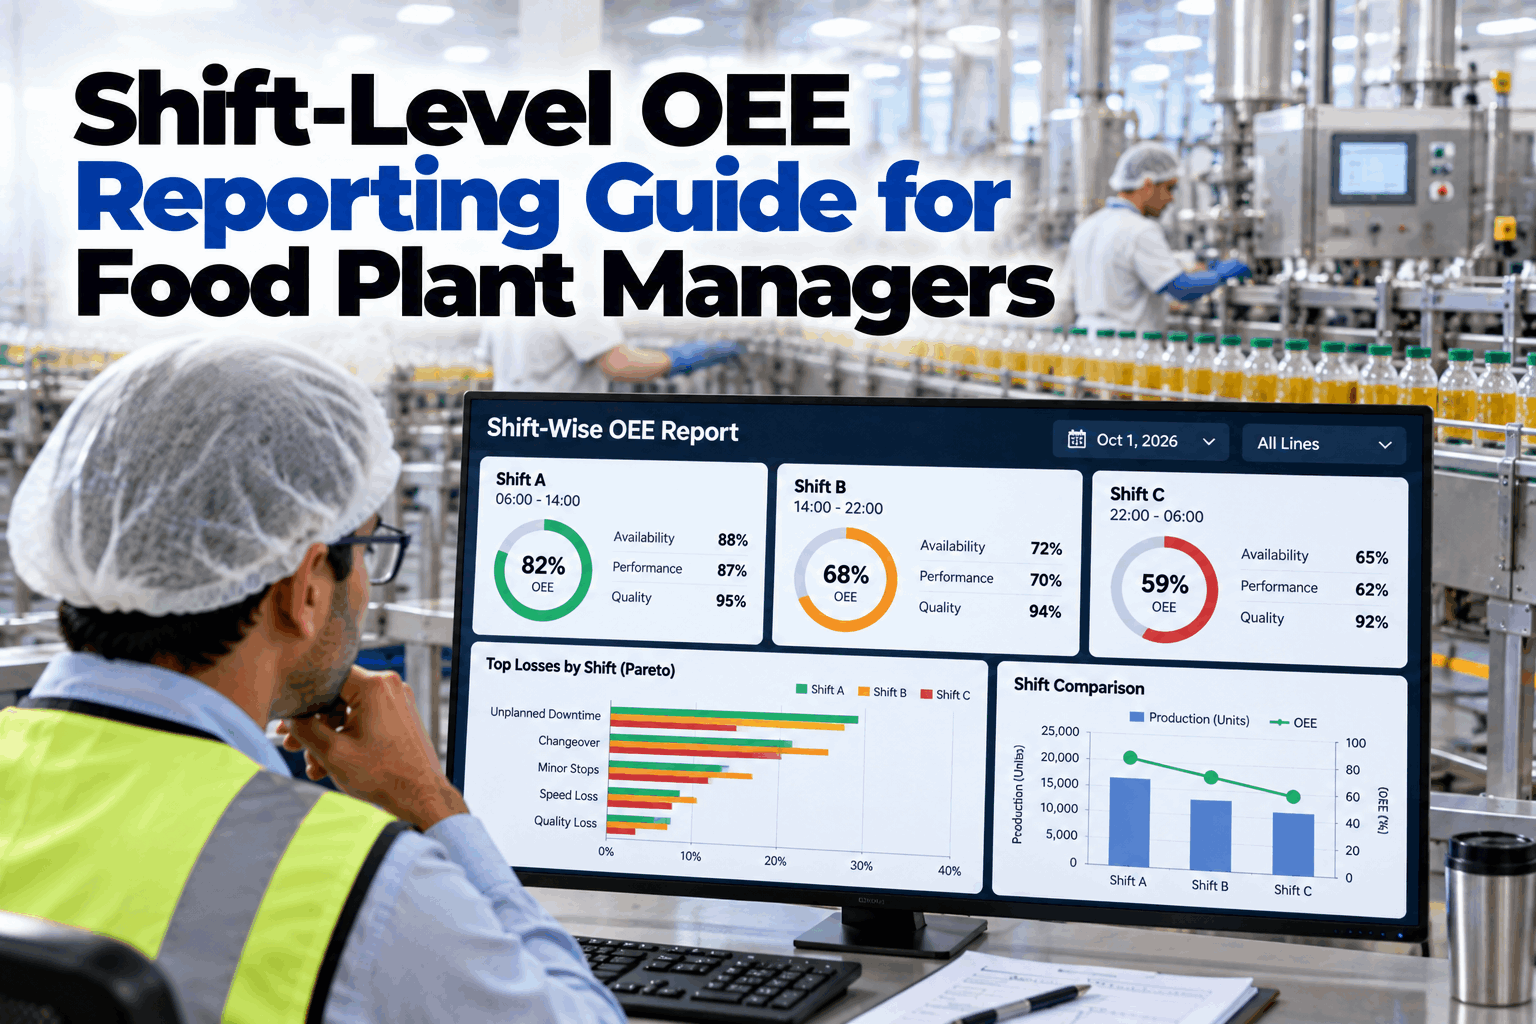
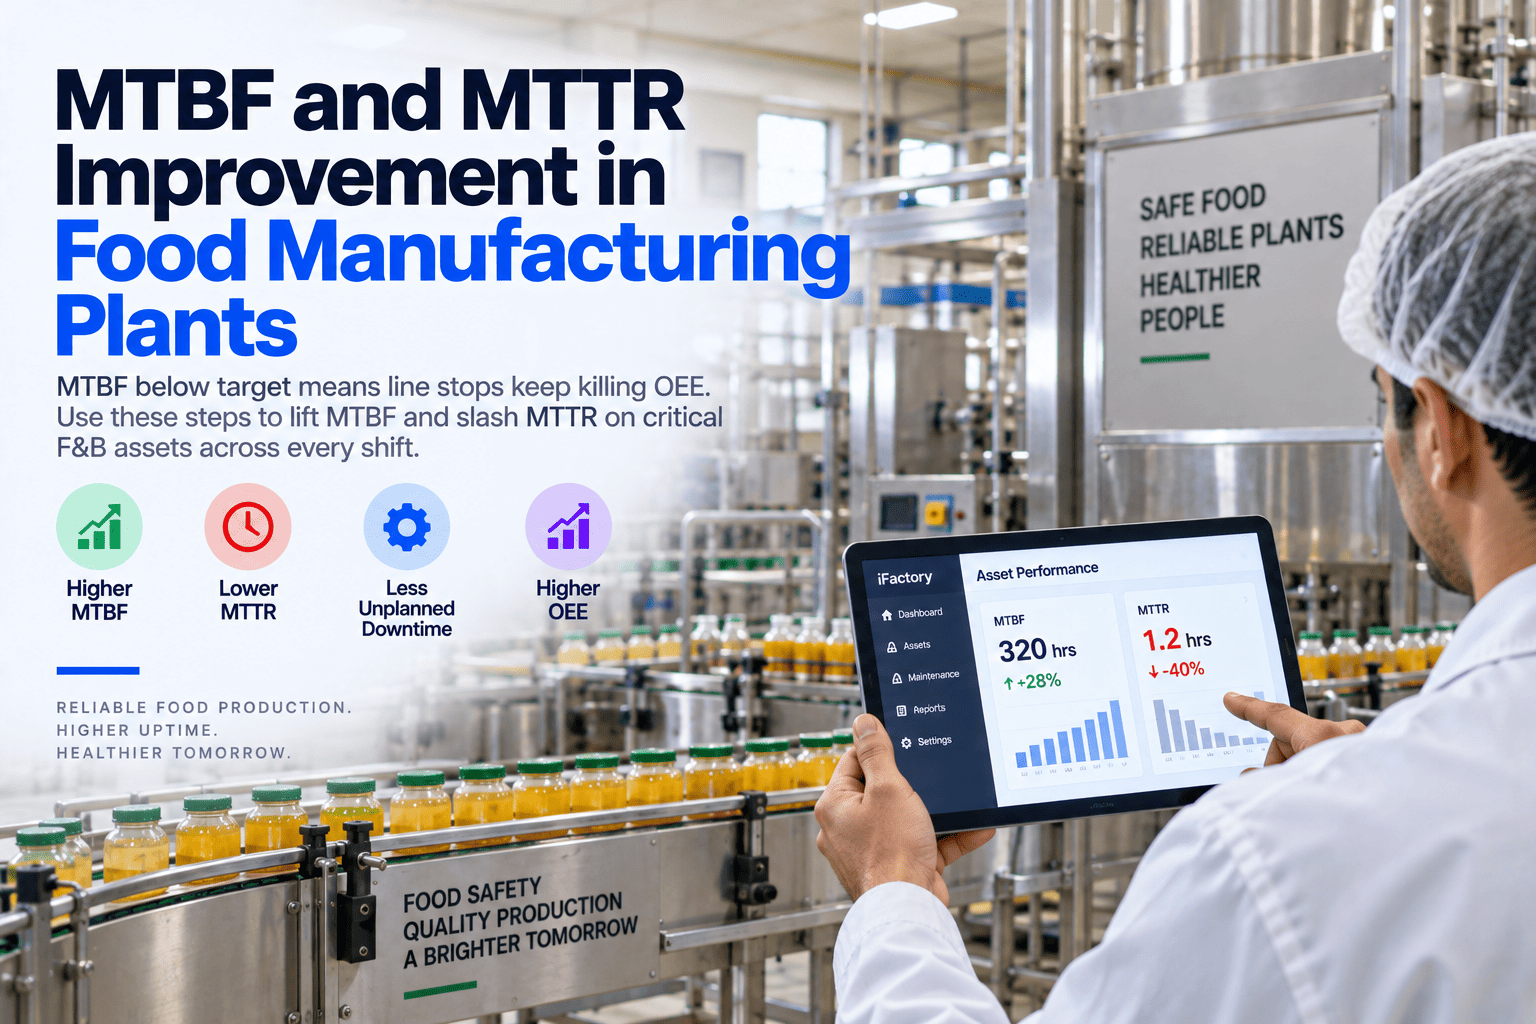
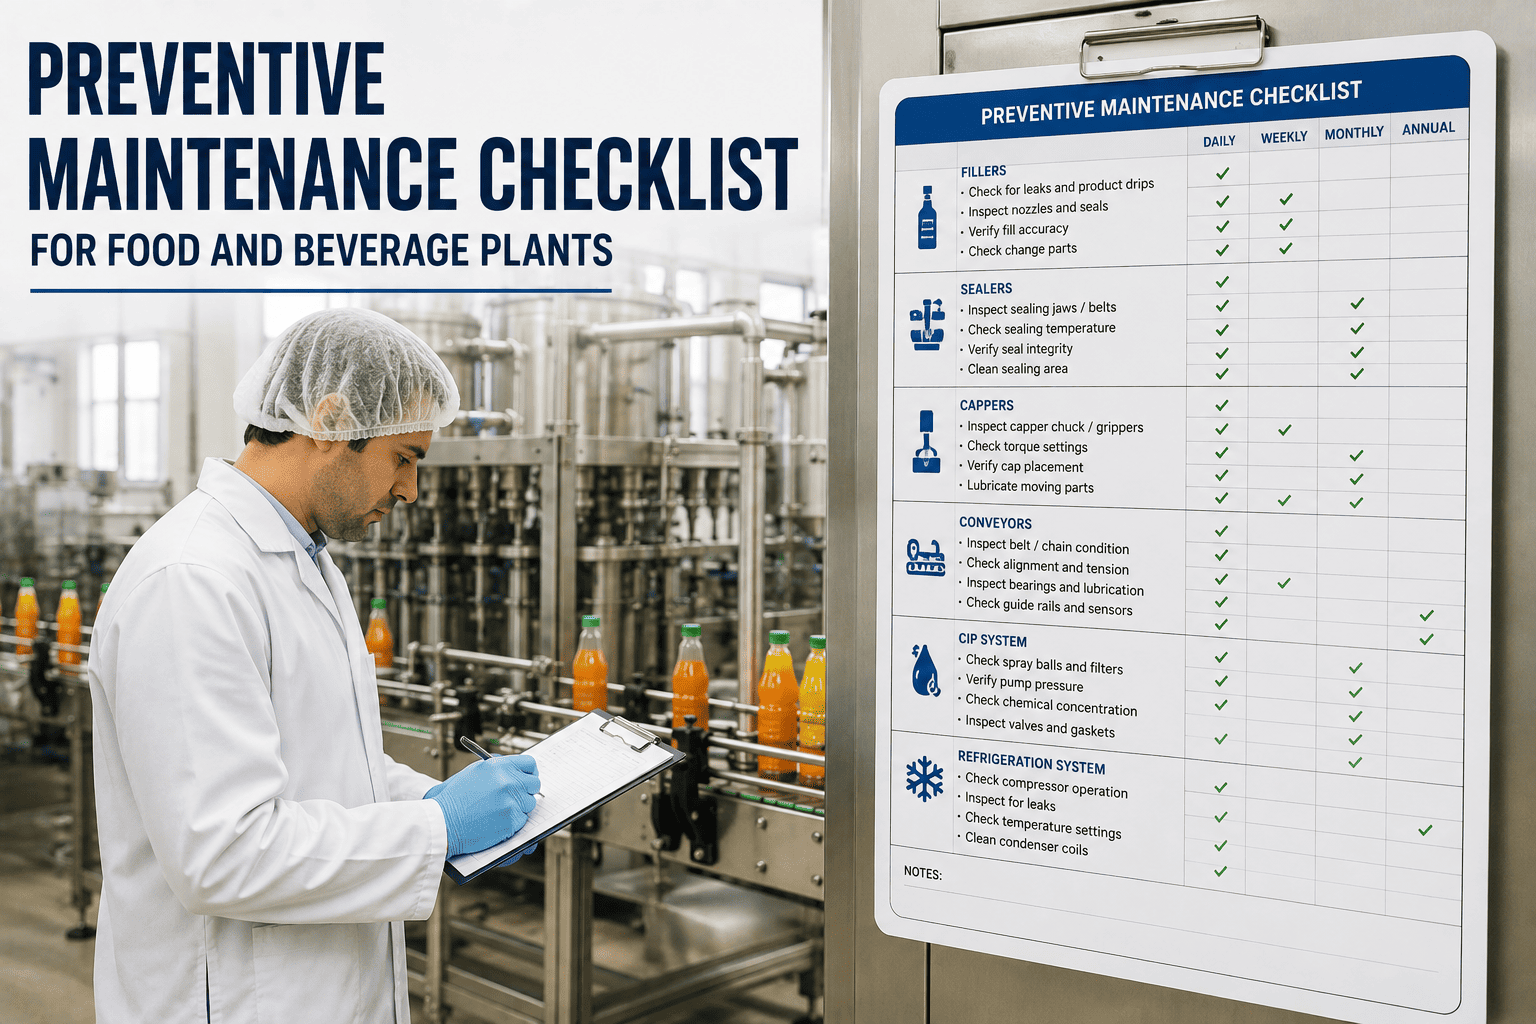
A single unplanned line stoppage in a mid-sized food plant can cost $30,000 to $50,000 an hour once lost throughput, wasted raw material, emergency labor, and the mandatory sanitation restart before the line can run again are all counted — and that sanitation restart is the cost most F&B maintenance reports leave out entirely. The industry-average food plant runs 60-65% OEE with a 12-18% unplanned downtime rate; top-quartile plants run 1-2%. The gap between those two numbers almost never traces back to one dramatic failure — it traces back to a planned-to-unplanned maintenance ratio below 70%, a growing backlog nobody's trending, and emergency work that costs 4.8x more per repair than the same job caught in a planned window. iFactory's Maintenance KPI Dashboard is built to put MTBF, MTTR, planned ratio, backlog, and emergency work on one screen, so the gap is visible before it becomes next quarter's bad news.
iFactory Maintenance KPI Dashboard
Maintenance KPI Dashboard for Food and Beverage Plants
MTBF, MTTR, planned ratio, backlog, and emergency work in one live dashboard — built for F&B plant leaders, not a generic manufacturing scorecard.
$30-50K/hr
typical F&B unplanned downtime cost
80%+
target planned-to-unplanned ratio
4.8x
cost premium, emergency vs planned repair
60-65%
industry-average food plant OEE
The KPI Cockpit — What Every Line Should Say
A live maintenance dashboard means every line reporting the same five KPIs against target, not a monthly spreadsheet someone reconciles by hand. This is what that view looks like across a mixed F&B plant right now.
Planned-to-Unplanned Ratio
Plant-wide
Below target
Current ratio71%planned
Target80%+planned
Last quarter63%trending up
Cost premium4.8xon unplanned work
MTBF / MTTR
Line 3, filler
On target
MTBF186 hrsbetween failures
MTTR2.1 hrsavg repair time
Failure events4this month
TrendStablevs baseline
Corrective Backlog
Plant-wide
Rising
Backlog5.8 wksabove 2-4 wk target
Target range2-4 wkshealthy
Trend+0.6 wkquarter over quarter
Deferred riskGrowingflagged
Emergency Work
Line 1, food-contact
Costly event
Last event cost$147,800full 5-component
Downtime14 hrsat $8,200/hr
Sanitation restart$11,000included in total
Product disposal$22,000included in total
The Five-Component Downtime Cost — What Finance Sees vs What Actually Bleeds Out
Most food plants track downtime as one number: lost production value. The real cost of an unplanned stop on a food-contact line has four more components stacked on top of it.
Production loss
$75,600
Hours × value/hr
Product disposal
$22,000
Scrapped batch/WIP
Sanitation restart
$11,000
Required before restart
Emergency repair premium
$4,500
4.8x planned rate
Total event cost
$147,800
vs $450 planned repair
The planned version of the same pump bearing replacement: 3 hours at $75/hour labor plus a $180 sanitary bearing kit — $450 total. The unplanned version of the same failure, on the same line: $147,800. The gap is the business case for the planned ratio, not a hypothetical one.
The Five KPIs That Actually Drive Action
Most plants track dozens of maintenance metrics. These five are the ones that correlate directly with downtime, cost, and food-safety risk — and the ones worth putting on a screen everyone sees.
MTBF
Hours
Operating time between unplanned failures, by asset class — the earliest signal of degrading reliability.
MTTR
Hours
Average repair time once a failure happens — a measure of response speed and parts readiness.
Planned ratio
80%+ target
Share of maintenance labor spent on scheduled work — the clearest signal of program maturity.
Backlog
2-4 wks target
Corrective work waiting to be done — too little means under-reporting, too much means deferred risk.
Emergency work cost
4.8x premium
The full five-component cost of unplanned events — the number that actually gets budget approved.
Want to see your own five KPIs on one screen? Book a demo — bring 90 days of work order history and we'll build the baseline.
One Blended Number vs Five Live KPIs — Same Plant, Two Outcomes
Both approaches are trying to answer the same question a plant director eventually asks: is the maintenance program actually improving? One answers it with a single downtime number. The other answers it with the five drivers behind that number.
One Blended Number
"Is our maintenance program actually improving?"
Availability tracked as one annual number per site
Production loss counted, sanitation and disposal costs left out
Backlog grows quietly until a major failure forces attention
Food safety metrics treated as compliance, not as a reliability signal
Five Live KPIs
"Is our maintenance program actually improving?"
MTBF and MTTR tracked by asset class, trended weekly
Full five-component downtime cost calculated automatically per event
Backlog trended quarterly, flagged the moment it starts rising
Planned ratio tracked as the single number that documents program improvement
How the Dashboard Gets Built
The goal is one live screen, not five separate reports someone has to reconcile by hand every month.
01
Ingest Work Order History
Pull planned and unplanned work orders, downtime events, and labor hours from the CMMS, line by line.
02
Compute the Five KPIs Live
MTBF, MTTR, planned ratio, backlog, and emergency work cost recalculated continuously, by asset and by line.
03
Attach the Full Downtime Cost
Production loss, product disposal, sanitation restart, and emergency premium rolled into every event automatically.
04
Flag Drift by Line
Backlog growth, declining MTBF, or a falling planned ratio flagged at the line level, not just plant-wide.
05
Put It on the Screen
Live tiles for the maintenance shop and the plant manager's office — the same numbers, updated continuously.
What a Live KPI Dashboard Delivers
These are the outcomes F&B plants typically see after moving from monthly reconciled reports to a live five-KPI dashboard.
80%+
Planned ratio achievable
within 6 months, from a typical 52-63%
25-30%
Unplanned downtime cut
vs baseline, with visibility-driven action
2-4 wks
Healthy backlog range
tracked and trended, not guessed
Live
Five-component cost
per event, not reconstructed after the fact
Curious what your own planned ratio and backlog actually look like? Talk to our team — we'll build a baseline from your work order history.
Frequently Asked Questions
Why does sanitation restart time count as a maintenance cost?
Because it's a direct, unavoidable consequence of the unplanned stop — every unplanned event on a food-contact line requires a sanitation sequence before production can resume, and that time is lost production exactly like the repair time itself. Leaving it out understates the true cost of unplanned work and makes the business case for planned maintenance look weaker than it actually is.
What counts as "planned" versus "unplanned" for the ratio calculation?
Planned work is anything scheduled in advance — PM tasks, condition-based interventions triggered by a monitored trend, and planned replacements. Unplanned is anything that starts because a line is already down or a failure has already occurred, regardless of how minor the repair itself turns out to be. The ratio is measured in labor hours, not work order count, since a handful of unplanned jobs can consume disproportionate hours relative to routine planned tasks.
What's a healthy backlog number, and why does "too little" matter as much as "too much"?
2-4 weeks of backlog, measured as total backlog hours divided by weekly crew capacity, is the typical healthy range. Too much backlog means deferred risk is accumulating faster than the crew can clear it. Too little usually means planners aren't identifying enough work — which sounds good until it shows up later as unplanned failures that were never logged as a known risk in the first place.
How is this different from tracking OEE alone?
OEE tells you how much production you lost. It doesn't tell you why, or whether the maintenance program is getting better or worse at preventing it. MTBF, MTTR, planned ratio, and backlog are the leading indicators that explain an OEE number and predict where it's heading — tracking OEE without them is like tracking a stock price without looking at earnings.
How long does it take to get the dashboard running?
Typically 4-6 weeks from kickoff to a live dashboard, assuming your CMMS already captures work order type, labor hours, and downtime duration. If historical data quality needs cleanup first — a common gap in food plants moving off paper or spreadsheet tracking — add 2-4 weeks for that step. Bring 90 days of work order history and we'll scope the exact timeline on a first call.
Stop reporting one number a month.
Get MTBF, MTTR, Planned Ratio, and Backlog on One Live Screen
Bring 90 days of work order history. We'll build your five-KPI baseline, calculate the full downtime cost on your last few unplanned events, and show what closing the gap to 80% planned is actually worth.
Full
downtime cost, per event