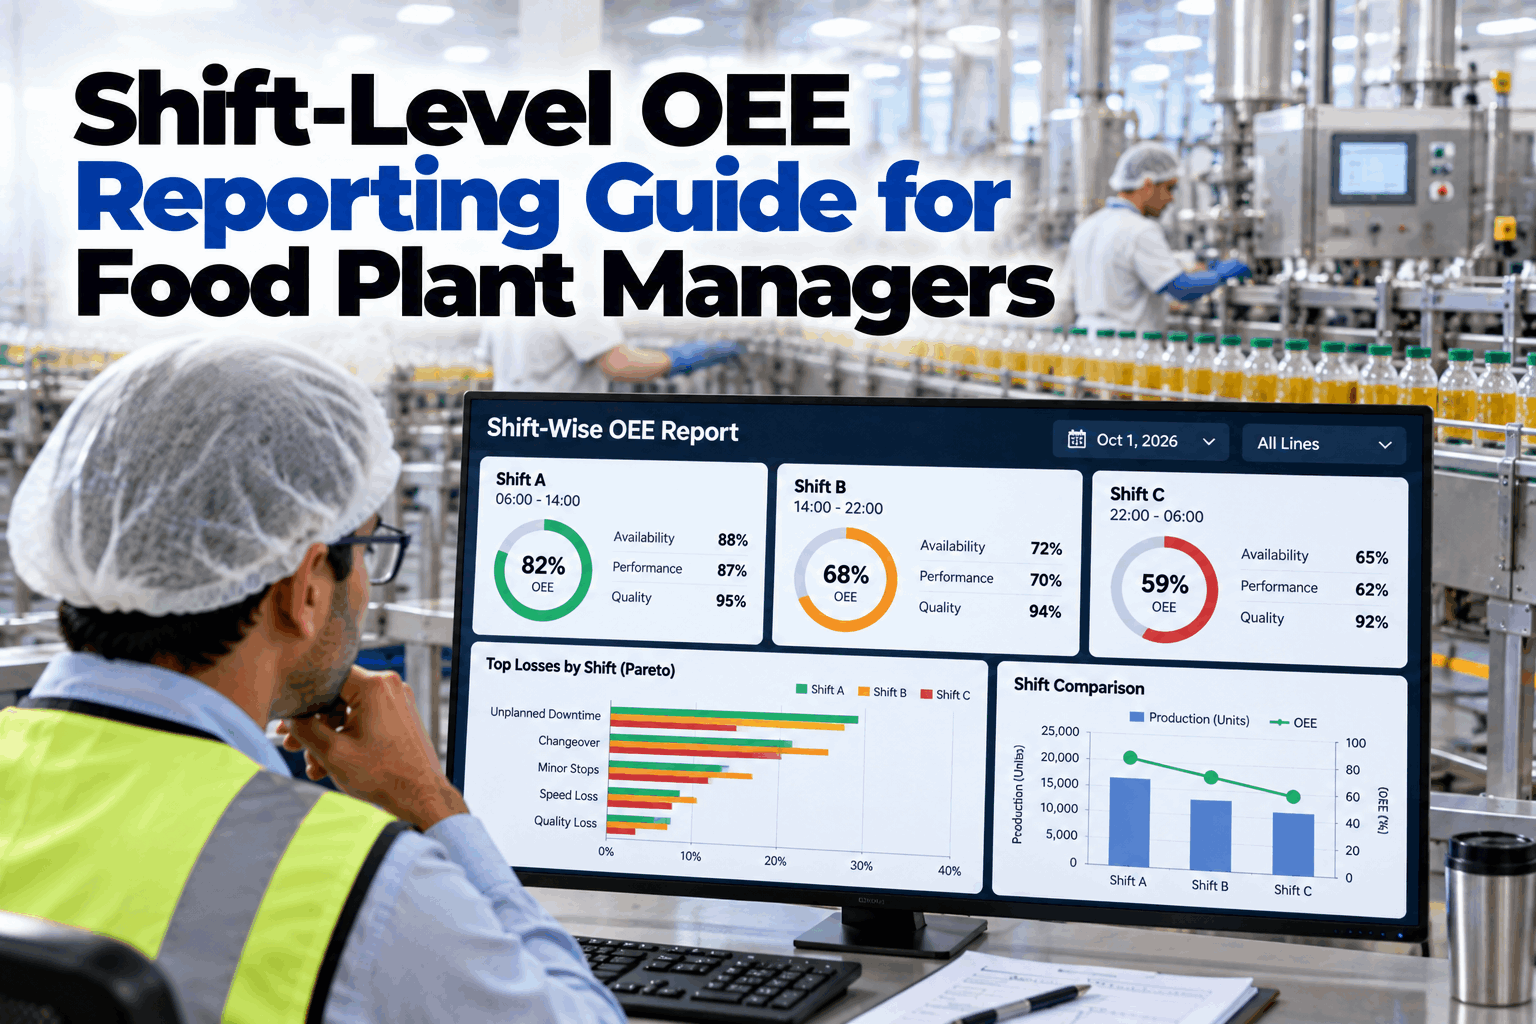
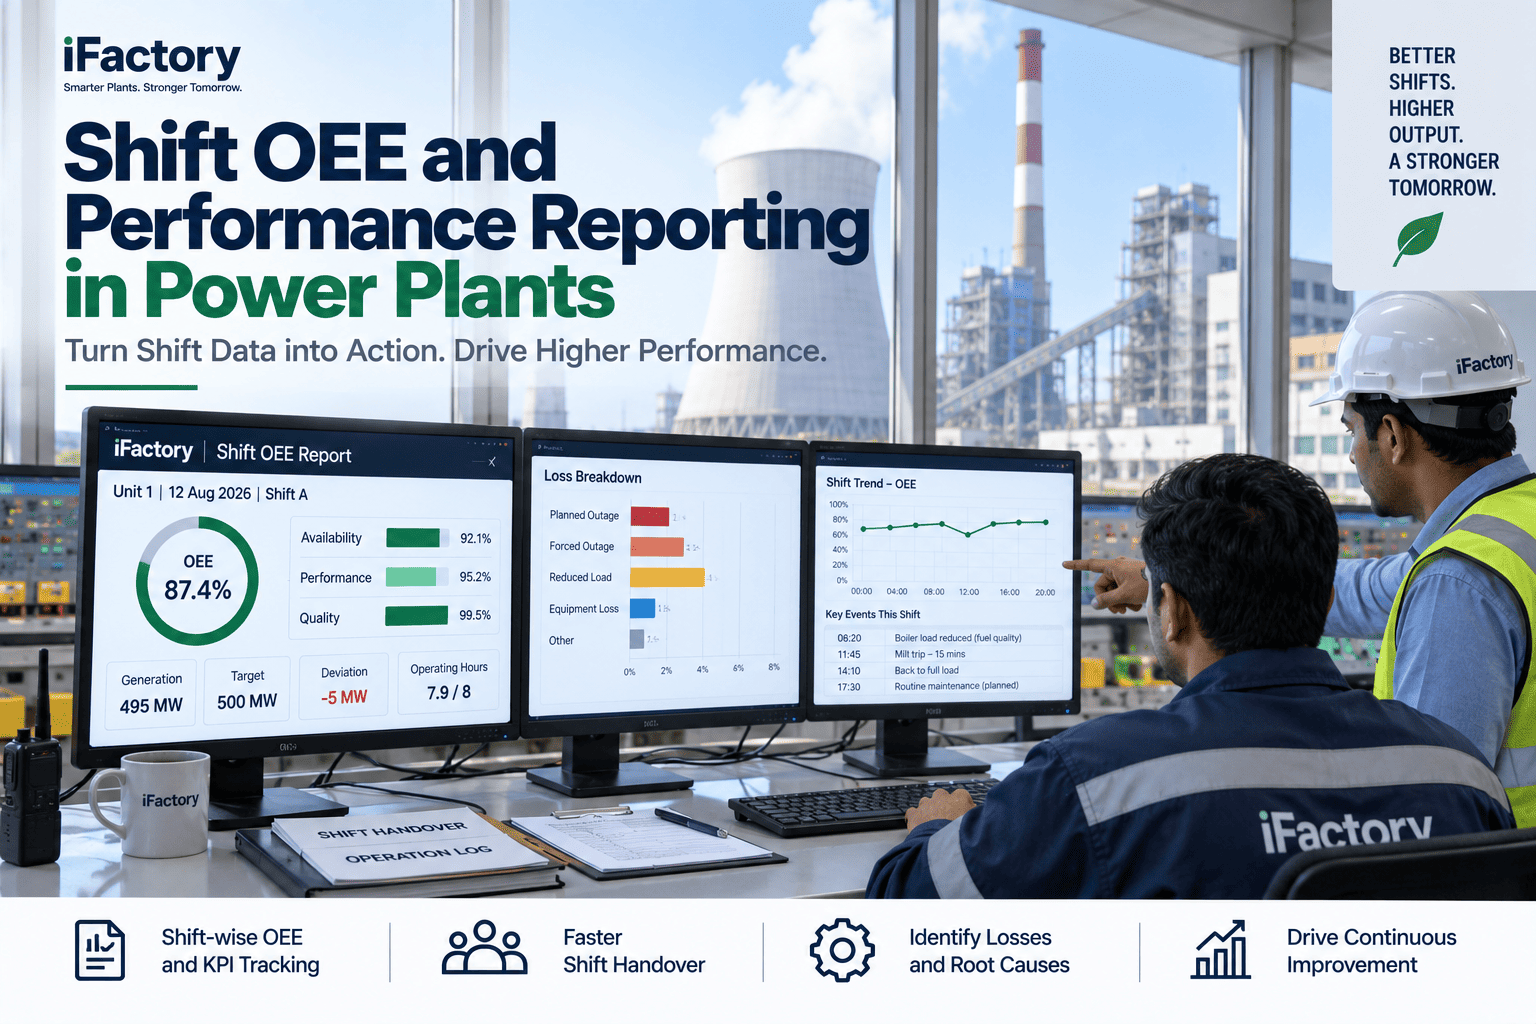
A food plant reporting 71% OEE for the week looks like a performance problem. A food plant reporting 84% on Day shift, 79% on Afternoon shift, and 51% on Night shift has a different problem entirely — and the 71% average is the number that systematically prevents anyone from finding it. Plant-average OEE is a management comfort metric. It smooths the variation, conceals the shift where three changeovers overran by 40 minutes each, and buries the line that ran at 58% on Monday because the filler was handed over without a clean. Shift-level OEE reporting does not improve performance by itself — but it is the precondition for every conversation that does. When the Night shift supervisor can see, at handover, that their shift produced 51% OEE against a 78% target, with 31% of lost time attributed to unplanned downtime on the filler, and that the same loss pattern has repeated for nine of the last fourteen night shifts, the conversation about what to do is a different conversation than the one that starts with "the weekly OEE was 71%." iFactory OEE Analytics is built to run exactly that reporting — shift by shift, line by line, loss by loss, live.
iFactory OEE Analytics — Food & Beverage Manufacturing
Shift-Level OEE Reporting for Food Plant Managers
Per-shift OEE, loss Pareto, and accountability data that plant-average weekly numbers systematically hide — live at handover, not assembled from memory on Monday morning.
33 pts
typical OEE gap between best and worst shift — hidden in the weekly average
Shift handover
the right time to review OEE — not the Monday management meeting
Loss Pareto
top 3 losses per shift — ranked by minutes, not by gut feel
9-of-14
pattern detection — recurring shift losses flagged before they become habits
Why Plant-Average OEE Hides the Problems That Matter Most
Weekly or monthly plant-average OEE is the most widely reported and least actionable metric in food manufacturing. It answers the question nobody needs to answer — "how did the plant do overall?" — while concealing the answers to the questions that drive improvement. These are the six things plant-average OEE systematically hides.
01
Shift performance variation
An 84% Day shift and a 51% Night shift average to 67.5% — which reports as "below target" with no visible cause. The actual problem — a specific shift, a specific crew, a specific machine handover practice — is invisible in the average.
02
Line-level losses pooled
A four-line plant where Line 2 runs at 52% and the other three run at 82% reports a plant OEE of 74.5%. The Line 2 problem draws no specific attention because it is masked by the three lines running well.
03
Changeover overruns buried
Three changeovers that each ran 40 minutes over target in one shift represent two hours of lost production — but in a weekly OEE summary, they appear as a fractional percentage point movement in the availability figure.
04
Recurring patterns undetected
The filler that causes a 45-minute unplanned stoppage on nine of every fourteen Night shifts has a pattern that is immediately obvious in shift-level data. In weekly averages, it is an unresolved "downtime" category that never gets a root cause.
05
Accountability diffused
When OEE is reported at plant level, no individual shift, crew, or supervisor owns the number. When it is reported at shift level, the question "who ran the 51% shift on Tuesday night and what happened?" has a specific answer and a specific owner.
06
Corrective action too late
A weekly OEE report reviewed on Monday morning covers performance that finished on Sunday. By then, six more shifts have run. Shift-level OEE reviewed at handover means the next shift's supervisor knows what went wrong before they take the line.
The OEE Waterfall — Where Each Shift's Losses Actually Live
OEE is the product of three components: Availability, Performance, and Quality. Each component has its own loss categories — and in a food plant, the distribution of losses across these categories varies significantly by shift, by line, and by product run. A shift-level waterfall shows exactly where the gap between target and actual OEE sits, before the losses compound into a number that is too large to trace.
− Planned downtime
−8% (Scheduled breaks, CIP)
− Unplanned downtime
−18% (Filler stoppage ×2, conveyor jam)
− Changeover overrun
−9% (SKU change ran 38 min over target)
− Speed loss
−8% (Ran at 88% of rated speed — viscosity issue)
− Minor stoppages
−3% (Label jams ×6, avg 3 min each)
= Performance
83% performance (of available time)
− Quality loss
−3% (Startup rejects + fill weight OOT)
Shift Comparison — The View That Plant-Average OEE Prevents
The shift comparison report is the most important report a food plant manager doesn't have on Monday morning. It shows, line by line and shift by shift, where the OEE variation lives — and makes the question "which shift, which line, which loss category?" answerable without an analyst building it in Excel.
Line / Shift
Availability
Performance
Quality
OEE
vs Target
Top loss
Line 1 — Day
93%
96%
98%
87%
+9 pts
Minor stoppages — 14 min
Line 1 — Afternoon
91%
94%
97%
83%
+5 pts
Changeover — 22 min over
Line 1 — Night
81%
91%
96%
71%
−7 pts
Unplanned downtime — 44 min
Line 2 — Day
89%
95%
98%
83%
+5 pts
Speed loss — ran at 92% rated
Line 2 — Afternoon
84%
89%
95%
71%
−7 pts
Changeover overrun — 38 min
Line 2 — Night ⚑
65%
83%
94%
51%
−27 pts
Filler stoppage ×2 — 68 min
Line 3 — Day
94%
97%
99%
90%
+12 pts
Label jam ×3 — 9 min total
Line 3 — Afternoon
91%
95%
98%
85%
+7 pts
Minor stoppages — 18 min
Line 3 — Night
86%
90%
96%
74%
−4 pts
Speed loss — viscosity adj.
Plant average
86%
92%
97%
77%
−1 pt
Hides 39-pt range across shifts
The Shift-Level Loss Pareto — Three Numbers That Drive the Handover Conversation
The Pareto principle applies to OEE losses in food manufacturing with unusual consistency: typically 20% of loss categories account for 80% of lost production time in any given shift. The shift-level Pareto presents the top three losses by minutes — not as a ranked list of every small event, but as the three numbers the incoming shift supervisor needs to know before they take the line.
Line 2 — Night Shift
OEE: 51%
#1
Unplanned downtime — Filler
68 min · 23% of shift time
#2
Changeover overrun — SKU change
38 min · 13% of shift time
#3
Speed loss — fill viscosity
24 min equivalent · 8% of shift
Top 3 losses account for 130 min — 44% of shift time
Line 3 — Day Shift
OEE: 90%
#1
Minor stoppages — label jams
9 min · 3% of shift time
#2
Quality loss — startup rejects
6 min equivalent · 2% of shift
#3
Speed loss — blend changeover
5 min equivalent · 2% of shift
Top 3 losses account for 20 min — 7% of shift time
The Shift Handover Report — What It Should Contain and Why
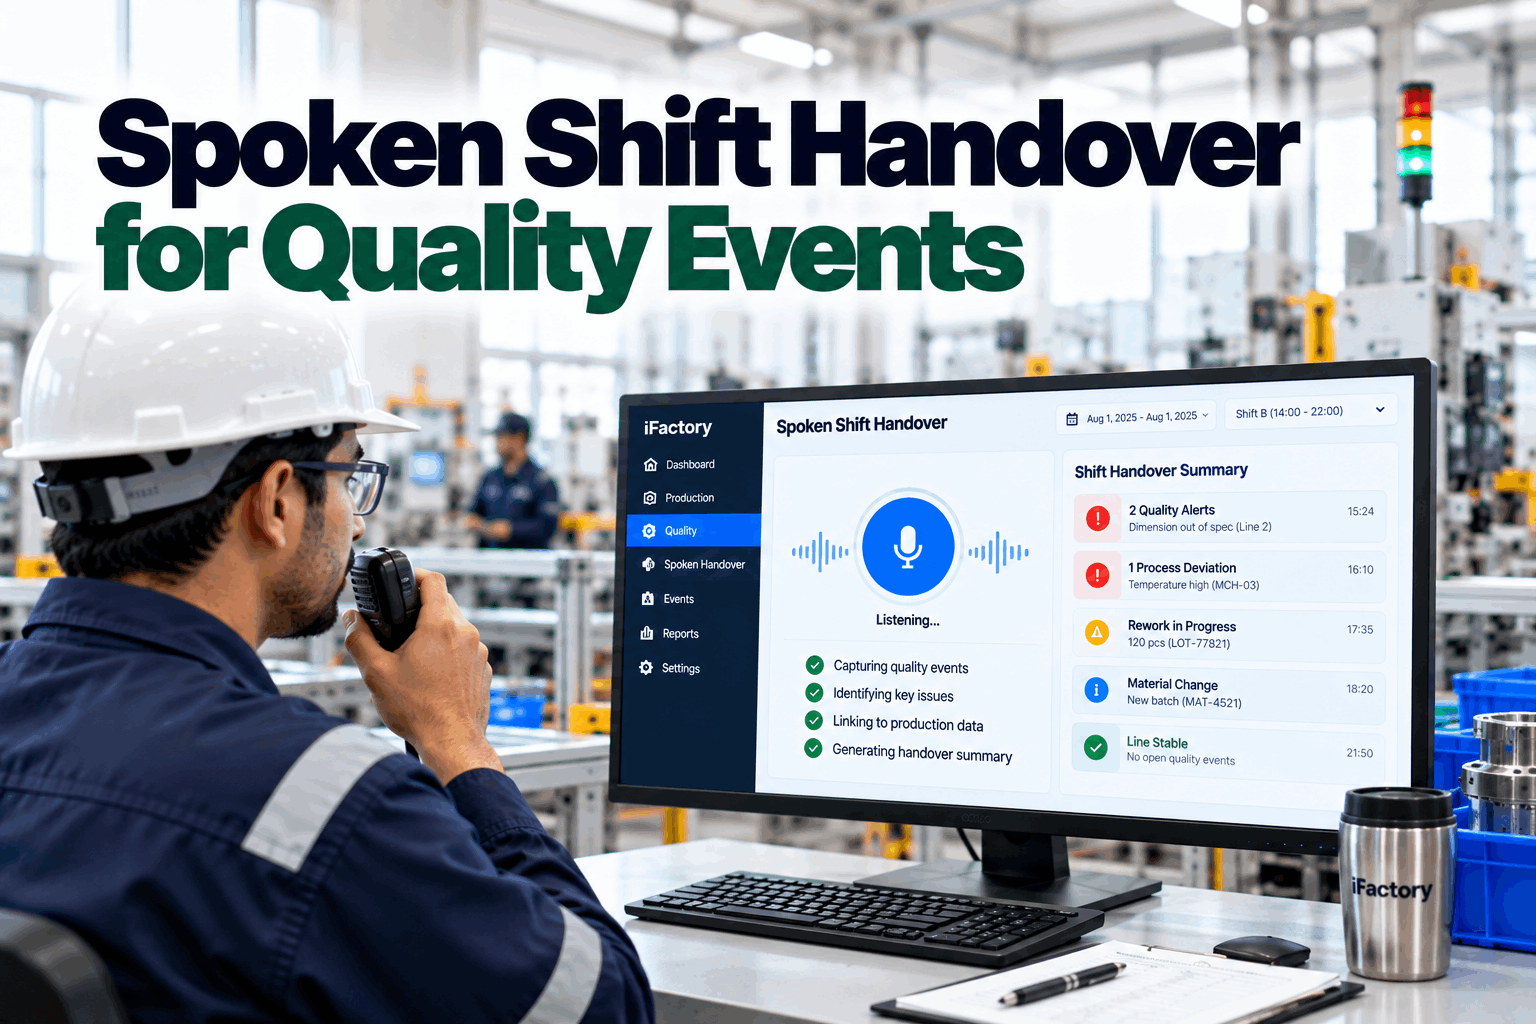
The shift handover is the moment when OEE data has its highest value — the incoming supervisor can still do something with it. A handover report that lists OEE as a single percentage tells them nothing. These are the six data elements that make a shift handover report actionable rather than decorative.
1
OEE vs target — per line, not plant average
Each line's OEE for the outgoing shift against its target. Not a plant average. Lines running above target and lines running below target shown separately — the incoming supervisor needs to know which lines to watch.
Example: Line 2: 51% (target 78%) | Line 3: 90% (target 78%)
2
Top 3 losses by minutes — named, not categorised
Not "unplanned downtime: 68 min" — but "Filler Line 2, two stoppages, 34 min each, cause: fill head seal failure." The loss category tells the incoming supervisor what kind of problem it was. The equipment name and duration tell them where to look and whether it is likely to recur.
Example: Filler L2 stoppage ×2 — 68 min | CO overrun SKU change — 38 min | Speed loss viscosity — 24 min eq.
3
Changeover performance — actual vs target per changeover
Every changeover that ran during the shift: product from, product to, target duration, actual duration, and variance. A shift with two changeovers that ran 38 and 22 minutes over target respectively has 60 minutes of changeover loss that is invisible in an OEE percentage without this breakdown.
Example: SKU A→B: target 45 min, actual 83 min (+38 min) | SKU B→C: target 30 min, actual 52 min (+22 min)
4
Recurring pattern flag — same loss, same shift, count
Any loss category that has appeared in the same shift pattern (same line, same shift rotation) more than three times in the last fourteen shifts is flagged as a recurring pattern — with the count, the total minutes lost, and the date of first occurrence. This is the signal that turns a maintenance ticket into a root cause investigation.
Example: ⚑ Filler L2 stoppage on Night shift: 9 of last 14 occurrences · 612 min total lost
5
Quality summary — rejects by cause, not just total
Total rejects as a percentage is the quality equivalent of plant-average OEE — it hides where the waste is. Startup rejects, fill weight OOT, seal failures, and label defects have different causes and different owners. A handover report that separates them gives the QA technician on the next shift a starting point, not a mystery.
Example: Startup rejects: 48 units (filler) | Fill weight OOT: 22 units | Seal failure: 11 units
6
Open actions from outgoing shift — not closed, not forgotten
Any corrective action raised during the shift that was not resolved before handover — a maintenance ticket, a quality hold, a changeover debrief item — listed with the action, the owner, and the time raised. The incoming supervisor inherits the action list, not a verbal summary that gets lost in the noise of a busy handover.
Example: Open: Filler L2 seal inspection (Maint. ticket #4412, raised 02:18) | Fill weight adj. required before next run (QA hold active)
OEE Loss Categories in Food Manufacturing — Named for the Line, Not the Textbook
Standard OEE loss taxonomy (availability, performance, quality) is correct but too broad to drive shift-level action in a food plant. These are the specific loss categories that appear in food and beverage manufacturing and the shift-level data capture that makes each one attributable and improvable.
Availability losses
Unplanned equipment stoppage
Capture: equipment ID, start time, end time, cause code, corrective action — per event
Changeover — planned
Capture: product from/to, target duration, actual duration, overrun cause — per changeover
Changeover — unplanned (additional clean, hold)
Capture: trigger event, duration, whether food safety or quality-driven — per occurrence
CIP / sanitation overrun
Capture: actual vs target duration, reason for overrun — per CIP event
Material shortage / starved line
Capture: material type, duration starved, upstream cause — per occurrence
Performance losses
Speed loss — ran below rated speed
Capture: actual vs rated speed, duration, cause (viscosity, operator, quality hold) — per period
Minor stoppage (<5 min, not logged as downtime)
Capture: count per shift, total minutes, equipment (labeller, filler, wrapper) — aggregated
Reduced speed run — quality risk period
Capture: duration at reduced speed, product at risk, quality check result — per event
Idling — line ready, no demand
Capture: duration, reason (schedule gap, blocked downstream) — per period
Quality losses
Startup rejects
Capture: units, cause, line and product — per startup event at beginning of run or after stoppage
Fill weight / volume out-of-tolerance
Capture: units affected, direction (over/under), corrective action taken — per OOT period
Seal / packaging failure
Capture: units, failure mode, equipment point — per detection event
Label error / mis-application
Capture: units, error type (wrong label, misplaced, missing) — per detection event
Foreign body / contamination hold
Capture: product held, quantity, risk assessment outcome — per hold event
Want to see your shift OEE and loss Pareto by line on a live dashboard? Book a demo — bring a week of downtime records and we'll show you the shift-level view your weekly reports are hiding.
How iFactory Builds Shift-Level OEE — From Line Data to Handover Report
The gap between production data on the shop floor and a shift handover report that the incoming supervisor can act on is five steps. Each one is where iFactory replaces a manual assembly process with a live, structured, attributed output.
01
Live Data Capture
Machine signals (run/stop/speed), operator downtime entries, changeover start/end times, and quality check results — captured per line, per event, per shift. No end-of-shift batch entry.
02
OEE Calculation
Availability, Performance, and Quality calculated per line per shift — continuously updated during the shift, not computed at shift end. OEE visible to the supervisor during the shift, not only after it.
03
Loss Attribution
Every minute of lost OEE attributed to a specific loss category and equipment point — not allocated to "downtime" as a residual. Pareto ranked automatically by duration within each shift.
04
Pattern Detection
Recurring losses flagged automatically — same loss category, same line, same shift rotation, more than three occurrences in fourteen shifts. Pattern flag appears in handover report with count and total minutes.
05
Handover Report
Shift handover report generated automatically at shift end — OEE vs target per line, top 3 losses, changeover performance, recurring patterns, quality summary, and open actions. Available at the handover moment, not assembled the next morning.
What Shift-Level OEE Reporting Delivers in a Food Plant
The return on shift-level OEE reporting is measured in the same currency as production: minutes recovered per shift, changeover targets hit more consistently, and recurring losses eliminated because they become visible as patterns rather than as isolated incidents absorbed into a weekly average.
Shift handover
Right time for OEE review
data available when action is still possible — not Monday morning
Top 3 losses
Named and ranked
by minutes, not by category — actionable at the line, not in a spreadsheet
Patterns flagged
Before they compound
recurring shift losses surface as investigation triggers, not as averages
Line vs plant
OEE resolution
39-pt range across shifts visible — not hidden in the weekly average
Frequently Asked Questions
How is shift-level OEE different from what our existing MES or OEE system already shows?
Most MES and OEE systems calculate OEE correctly but report it at the wrong level and at the wrong time. They show plant or line OEE in a daily or weekly summary — which means the data is reviewed after the opportunity to act has passed, and at a level of aggregation that conceals which shift or which loss category is driving the gap. iFactory reports OEE per shift, per line, live during the shift and formatted as a handover report at shift end — with the loss Pareto, the changeover breakdown, and the recurring pattern flag that turns the number into a conversation rather than a statistic.
What data sources does iFactory need to calculate shift-level OEE?
The minimum data set is: a machine run/stop signal per line (from PLC, line controller, or sensor), a rated speed or theoretical cycle time per product run, and a shift schedule. From these three inputs, iFactory calculates Availability and Performance. Quality requires an additional input — either a reject counter from the line, a manual entry by the operator, or a connection to a checkweigher or vision system. Changeover performance requires changeover start and end events, which can come from the MES, from a manual entry at changeover start, or from a dedicated changeover signal on the line controller.
How do operators and supervisors enter downtime reasons without disrupting the line?
Downtime reason entry is handled through a touchscreen terminal at the line or through a mobile device — the operator sees a list of pre-defined downtime categories relevant to their line (not a generic list of 200 codes) and selects the reason within the first two minutes of a stoppage. For lines with automatic stoppage detection, the system prompts the operator when a stoppage is detected — the operator confirms or corrects the reason. Short stoppages under five minutes can be captured as minor stoppages in aggregate at shift end, so they don't interrupt flow on high-speed lines.
How does the recurring pattern detection work — and how many shifts of data does it need?
Pattern detection requires a minimum of fourteen shifts of data per shift rotation per line — typically two to three weeks after go-live, depending on the shift pattern. The algorithm looks for the same loss category (not just the same category code, but the same equipment point within the category) appearing in the same shift rotation more than three times within the rolling fourteen-shift window. The threshold is configurable — some plants set it at two occurrences for high-impact losses (unplanned downtime on critical equipment) and five for lower-impact losses (minor stoppages). Every pattern flag includes the occurrence count, total minutes lost, and a link to the individual shift records so the investigation starts with evidence rather than starting with a request to find the evidence.
Can we pilot shift-level OEE reporting on one line before rolling out to the plant?
Yes — and a single-line pilot is the recommended starting point. Choose the line with either the highest OEE variability across shifts (where the shift-level report will immediately surface something actionable) or the line with the most consistent downtime complaints (where the loss attribution will resolve a long-running debate about what is actually happening). A pilot runs for four weeks: two weeks to establish baselines and validate the data capture, two weeks to produce shift handover reports and measure whether the next shift's performance changes when the supervisor is handed a specific loss list rather than a weekly average. Book a demo and we'll identify the right pilot line from your current OEE data.
Stop reviewing last week's performance on Monday morning.
See Shift-Level OEE and Loss Pareto on Your Food Plant Lines
Bring a week of downtime records and your shift schedule. We'll calculate shift-level OEE, build the loss Pareto per shift per line, and show you the variation your plant-average number is hiding — before a single sensor is installed.