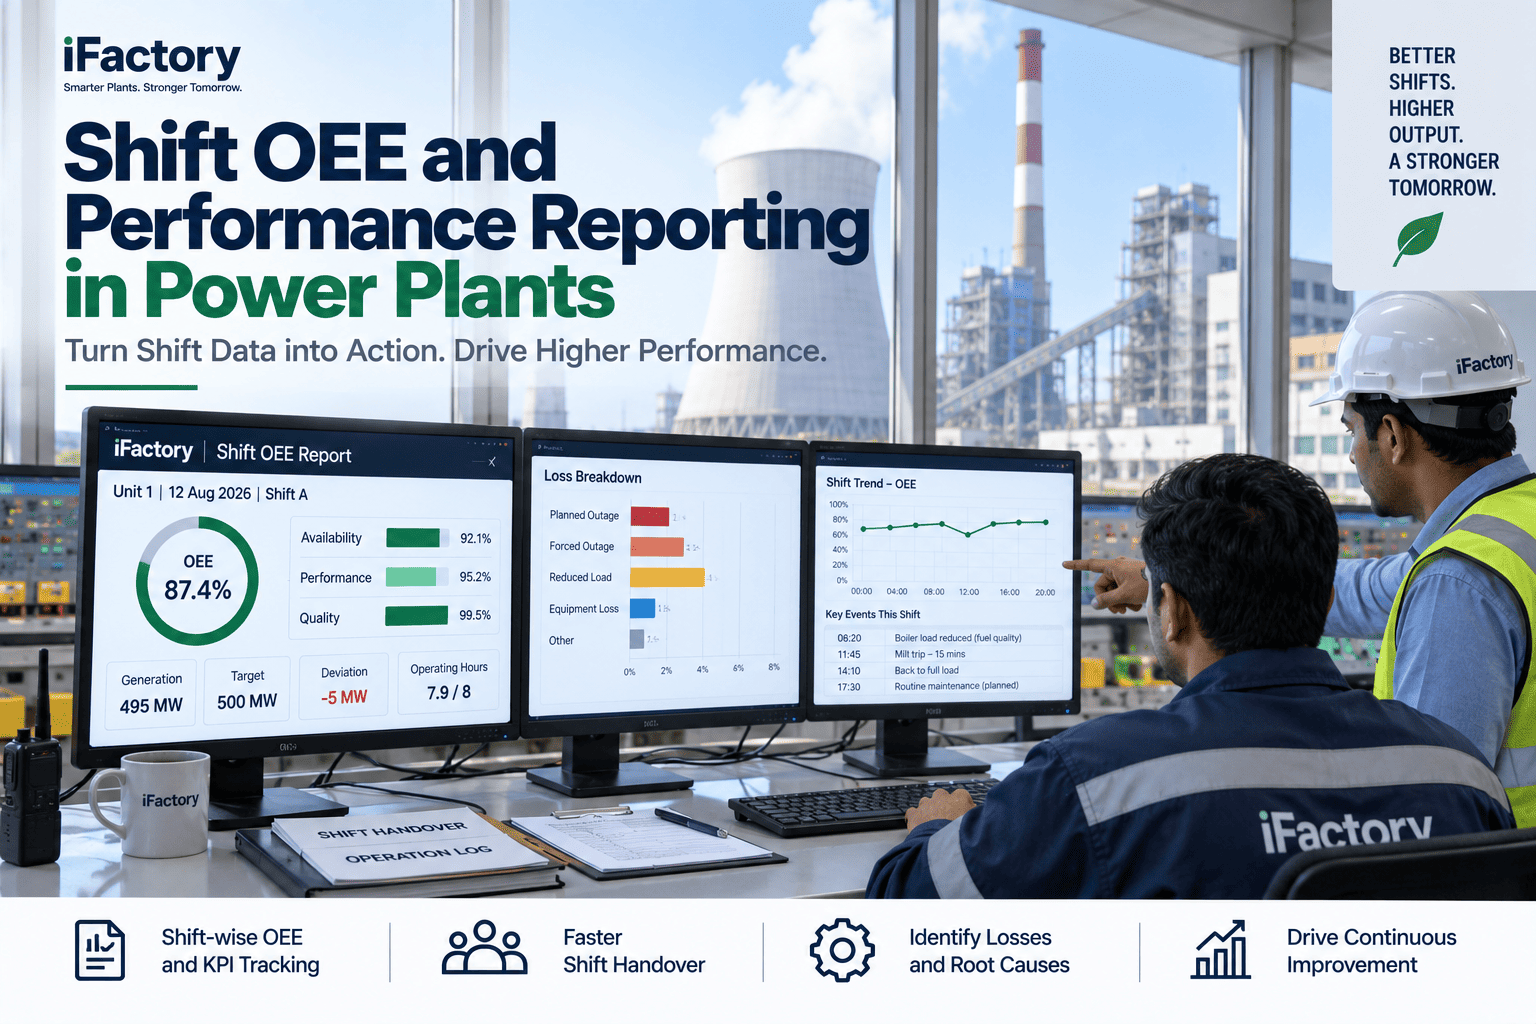
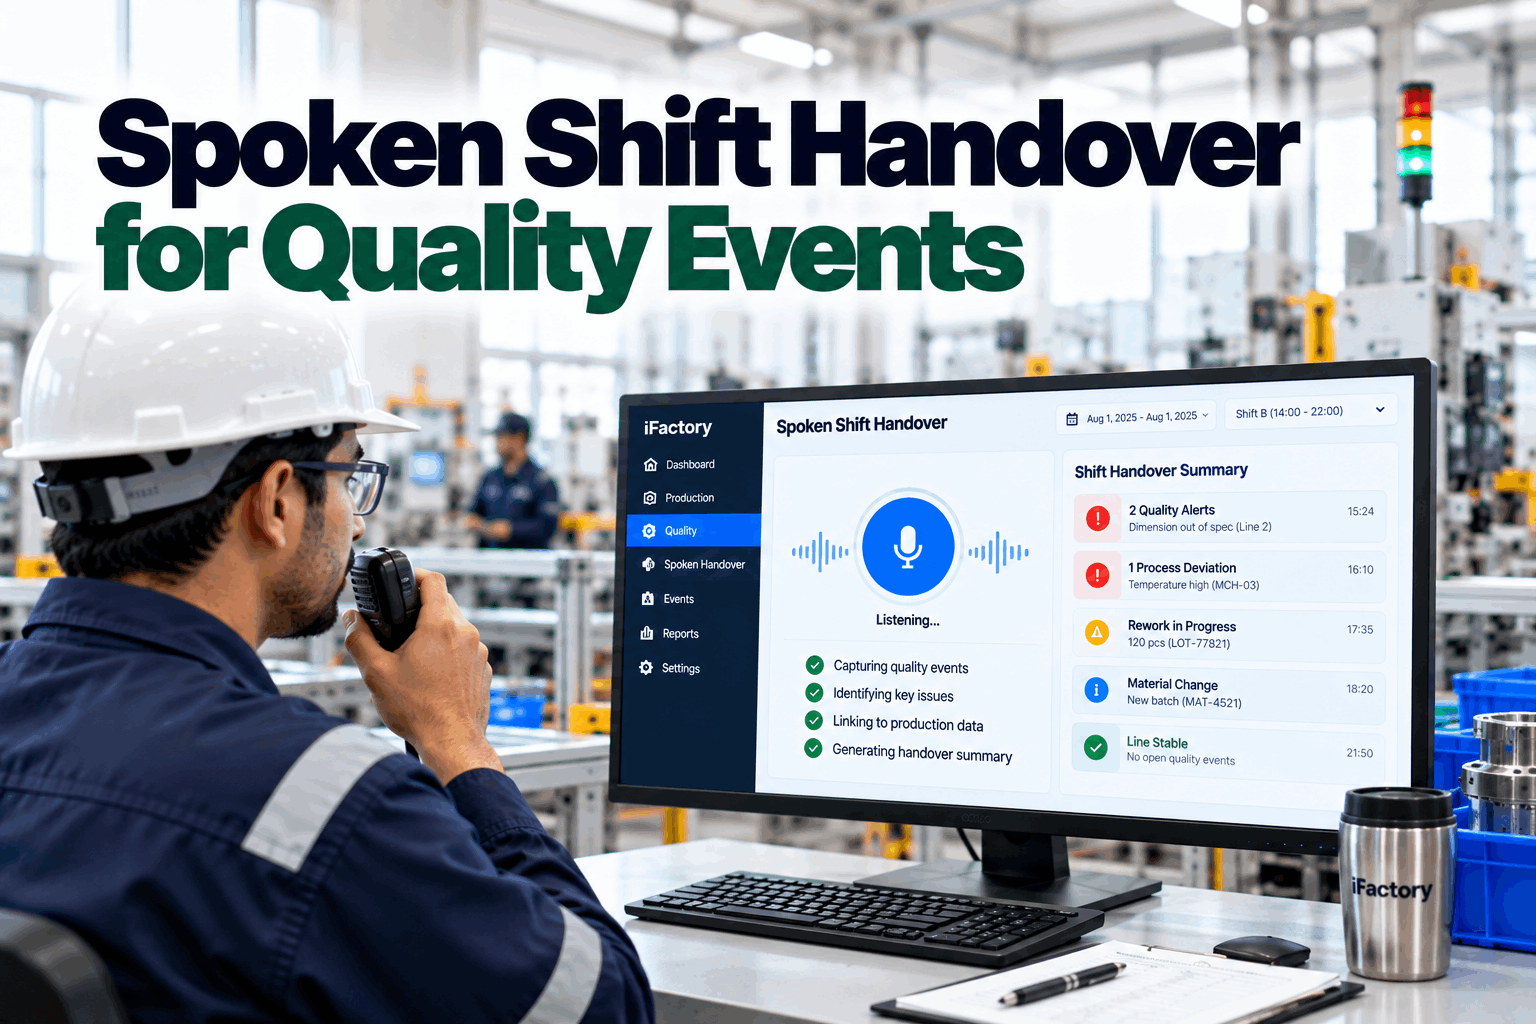
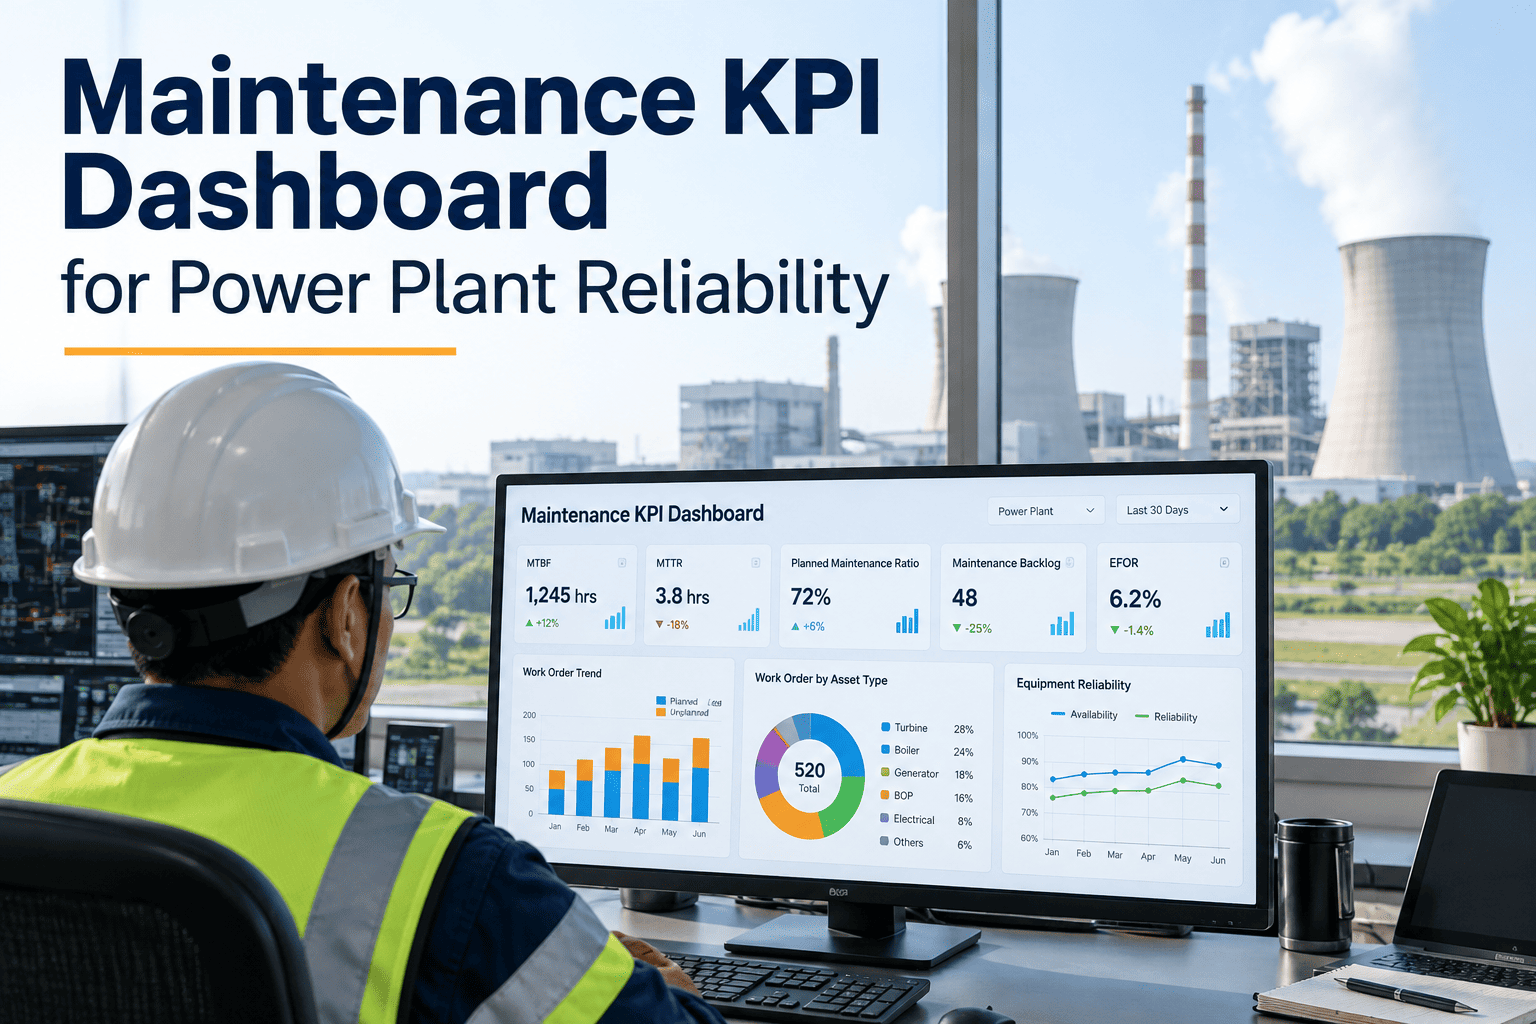
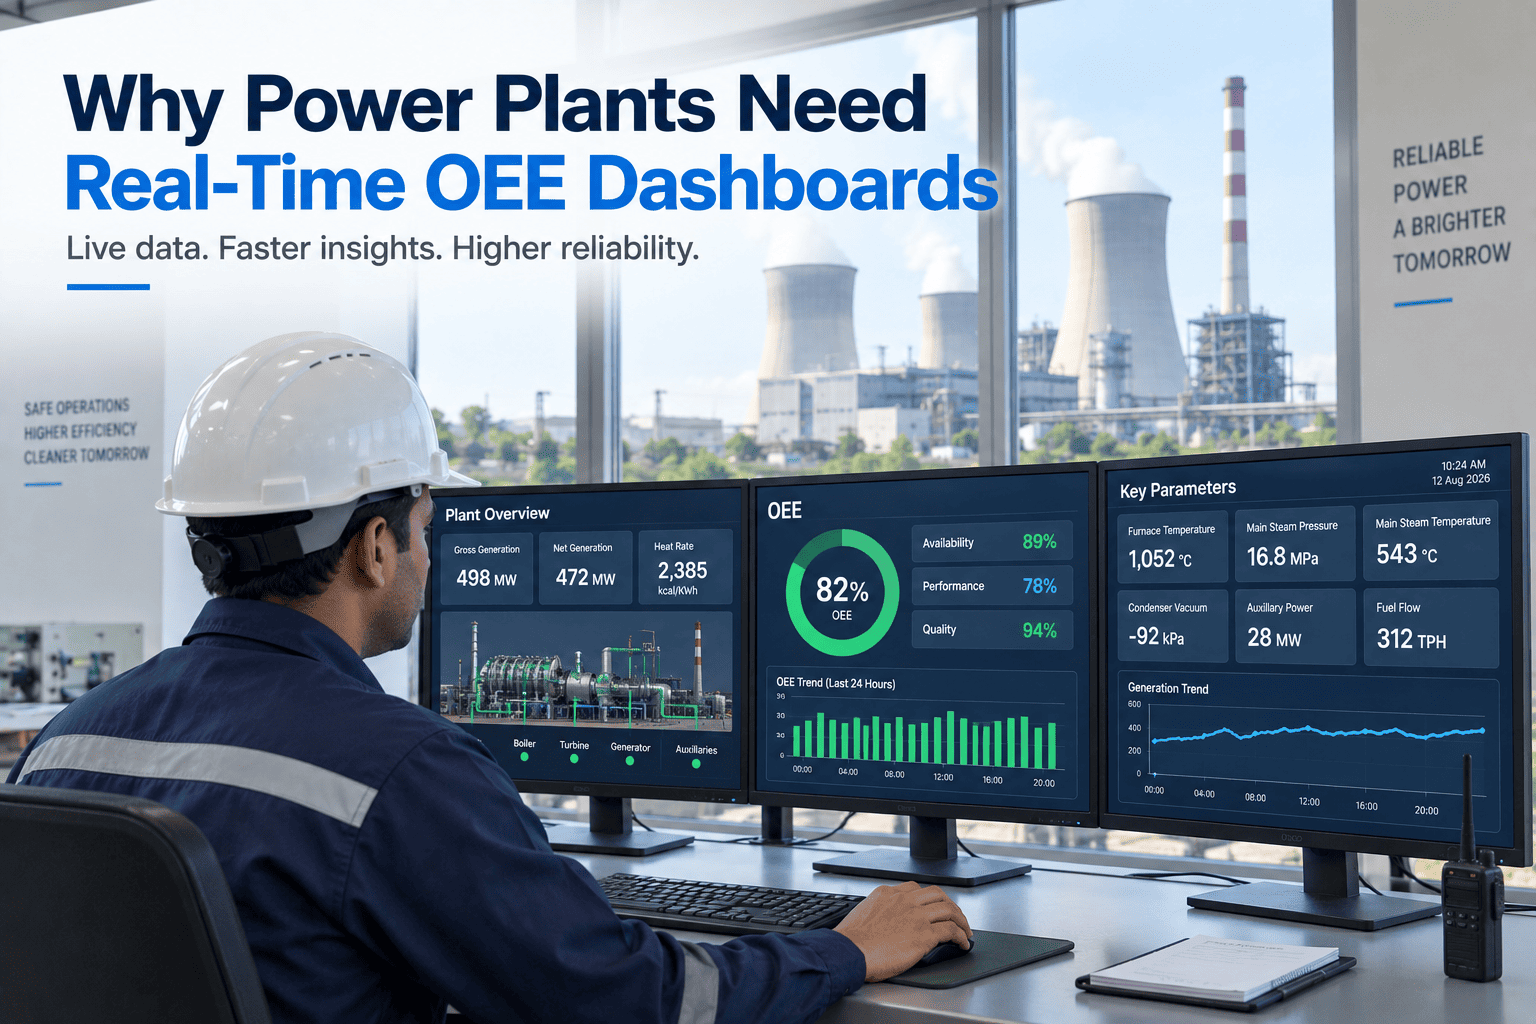
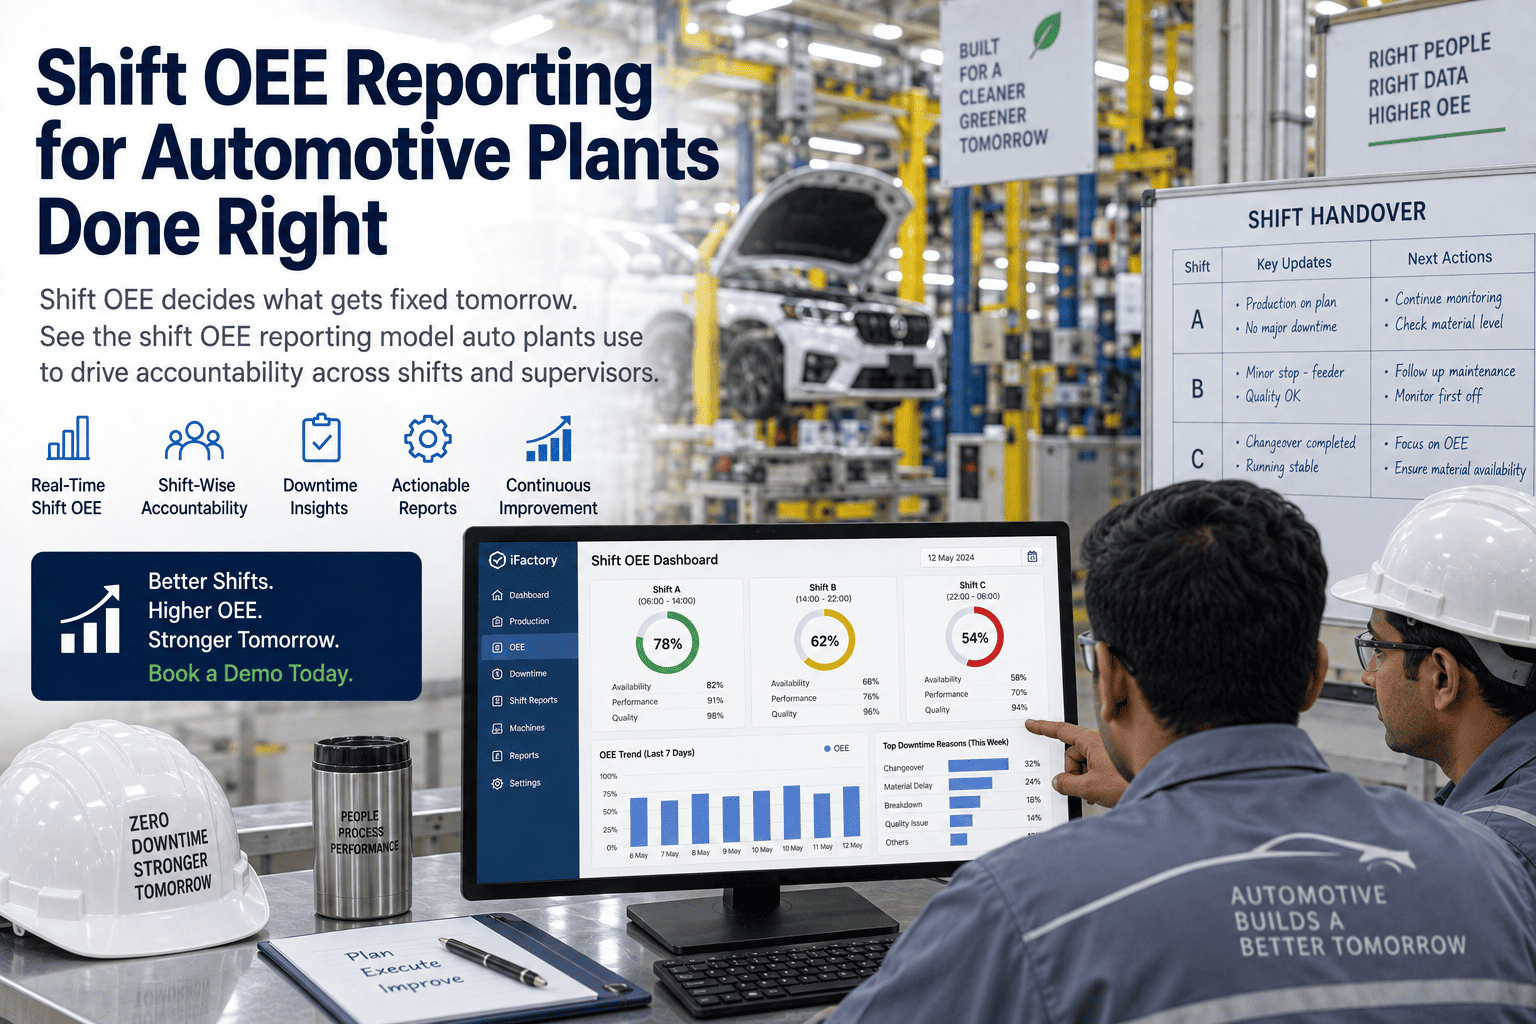
The average power plant reviews unit performance once per shift, on paper or in a spreadsheet that gets rekeyed by the next shift lead — and by the time a heat rate drift or an EAF dip shows up in the monthly report, it has already cost three or four shifts of fuel and generation. A shift report that's a bill instead of a warning is the single biggest reason drift compounds for weeks before anyone acts on it. The plants that catch drift early don't write better shift reports by hand — they replace the handover paperwork with a live shift cockpit that shows every unit's KPIs against the last ten shifts, flags what moved before the outgoing operator signs off, and hands the incoming shift a ranked list instead of a stack of notes. iFactory Shift Cockpit is built to run exactly that.
iFactory Shift Cockpit
Shift Reporting That Drives Action, Not Paperwork
Live OEE, heat rate, and availability per unit, benchmarked against the last ten shifts — so handover is a signed-off ranked list, not a stack of logbook notes.
3-4
shifts of drift before paper catches it
10
shift rolling comparison, live
<5 min
typical handover, live cockpit
25-30%
forced outage cut from earlier flags
The Shift Cockpit — What Every Handover Should Say
A live shift cockpit means every unit reporting the same KPIs against the last ten shifts, at the moment the outgoing operator signs off. This is what handover looks like across a two-unit station — with drift flagged inside each tile before it becomes a verbal note nobody writes down.
Shift A · Day
Unit 1, 500 MW
Clean handover
EAF this shift93.1%on baseline
Heat rate10,270Btu/kWh
Open items0carried forward
Vs last 10 shiftsOn baselineno drift
Shift B · Night
Unit 1, 500 MW
Drift flagged
EAF this shift88.4%-4.7 pts
Heat rate10,510+230 vs baseline
Open items2ranked
Vs last 10 shifts+1.2 σworth investigating
Shift C · Day
Unit 2, Gas CCGT
Clean handover
EAF this shift96.2%on baseline
Heat rate7,010Btu/kWh
Open items0carried forward
Vs last 10 shiftsOn baselineno drift
Shift D · Night
Unit 2, Gas CCGT
Handover risk
Open items4unresolved
Unack'd alarms6pending review
EAF this shift90.1%-1.8 σ
Vs last 10 shifts-1.8 σbelow normal
OEE Across a Shift — Where It Actually Moves
A monthly average hides more than it shows. The same unit can swing several EAF points shift to shift — operator handling, ambient conditions, load-following — and a paper logbook has no built-in way to tell a normal night shift from one that's quietly drifting.
Best shift on record
~96%
Peak
Typical day shift
92-94%
Normal
Typical night shift
88-91%
Normal, lower
Shift with unflagged drift
84-88%
Missed on paper
Shift with handover gap
Below 82%
Compounding risk
A 4-point EAF gap between a plant's best and worst shift, left uncaught for two weeks, is worth roughly $185K in lost generation revenue on a 500 MW unit — the exact gap a live cockpit is built to catch inside a single shift, not a monthly report.
What Gets Lost in a Paper Handover
Every plant has a version of this: the thing the outgoing operator meant to write down, said out loud instead, and that never made it into the next shift's picture. None of it shows up as a line item — until it's the root cause of an event three weeks later.
Open work orders
15-20%
Of handovers where an open item isn't carried forward cleanly to the next shift.
Sub-threshold drift
25-35%
Of drift events that were trending before the shift that finally flagged them.
Near-misses
10-15%
Mentioned verbally at handover, never entered in a logbook or work order.
Alarms without cause
20-30%
Acknowledged and cleared, but the root cause is never captured for the next shift.
Tribal knowledge
Hard to quantify
Walks out the door with the shift lead when there's no live record to fall back on.
Want to see what your own shift-to-shift variance actually looks like? Book a demo — bring 30 days of shift logs and we'll show the pattern.
Paperwork vs Signal — Same Report, Two Outcomes
Both approaches answer the same question at handover: what actually happened this shift? One depends on what got written down. The other computes it the same way, every shift, automatically.
Paper Logbook
"What actually happened this shift?"
Rekeyed by hand at every handover
No comparison against prior shifts built in
Drift visible only after it's already a trend
Tribal knowledge walks out with the shift lead
Live Cockpit
"What actually happened this shift?"
Computed automatically from the historian, every shift
Benchmarked against the last 10 shifts automatically
Drift flagged the shift it starts, not the month it's reported
Handover is a signed-off ranked list, not a memory test
How a Live Shift Report Gets Built
The shift report doesn't get better by asking operators to write more. It gets better by computing what they'd have to write, automatically, at the moment the shift closes.
01
Ingest Per-Shift Data
EAF, heat rate, aux load, and alarms pulled live, tagged to shift and unit as they happen.
02
Compute Shift KPIs
Every KPI recalculated at shift close, per unit, automatically — no manual rollup.
03
Compare vs Rolling Baseline
Each shift benchmarked against the last 10 shifts, not a static monthly target.
04
Flag & Rank Open Items
Drift and open work ranked by dollar impact, not just listed in the order it was raised.
05
Confirm Handover
Incoming shift lead signs off against a ranked list — no notes rekeyed, nothing lost.
What a Live Shift Cockpit Delivers
These are the outcomes stations typically see after replacing paper handover with a live, ten-shift-benchmarked cockpit.
<5 min
Typical handover
vs 20-30 min on paper
10 shifts
Rolling comparison
built into every KPI
25-30%
Forced outage cut
from earlier drift flags
Zero
Rekeyed notes
at every handover
Curious what a live shift cockpit would surface on your unit? Talk to our team — we'll benchmark your shifts against each other.
Frequently Asked Questions
How is this different from our existing shift logbook or DCS alarm summary?
Your DCS alarm summary shows what fired. The Shift Cockpit shows what that means against the last 10 shifts and what it's worth. A paper logbook can tell you EAF was 88.4% last night. It can't tell you that's 1.2 standard deviations below the shift's own rolling baseline, that two of the four open items are related, or that the gap is worth roughly $9,000 if it carries into the next shift. That translation from reading to action is what the cockpit adds.
Does this replace our operator rounds or just the reporting?
Just the reporting and handover layer. Operator rounds, DCS operation, and physical checks stay exactly as they are — the cockpit replaces the paper or spreadsheet step where shift performance gets summarized, compared, and handed to the next shift.
How is the "last 10 shifts" baseline calculated?
A rolling average and standard deviation per KPI, per unit, recalculated after every shift closes. Shifts affected by planned outages or known abnormal events can be excluded from the baseline so a maintenance shift doesn't skew what "normal" looks like for the next comparison.
Can outgoing and incoming shift leads both see it at the same time?
Yes. The cockpit is built for the handover conversation itself — both leads see the same ranked list of open items and KPI drift in real time, and the incoming lead signs off against it rather than against a paper note or a verbal summary.
How long does it take to get a live shift cockpit running?
Most stations are live on one or two units within 4-6 weeks of connecting to the historian, with the full multi-unit cockpit typically running inside the 6-12 week range depending on how many units and data sources are in scope. Book a demo and we'll scope your timeline on your own historian setup.
Stop losing shifts to paperwork.
See a Live Shift Cockpit on Your Own Unit
Bring 30 days of shift logs and historian data. We'll build the 10-shift rolling baseline per unit, show every drift a live cockpit would have flagged, and walk through what handover looks like when nothing gets rekeyed.
10-shift
rolling baseline