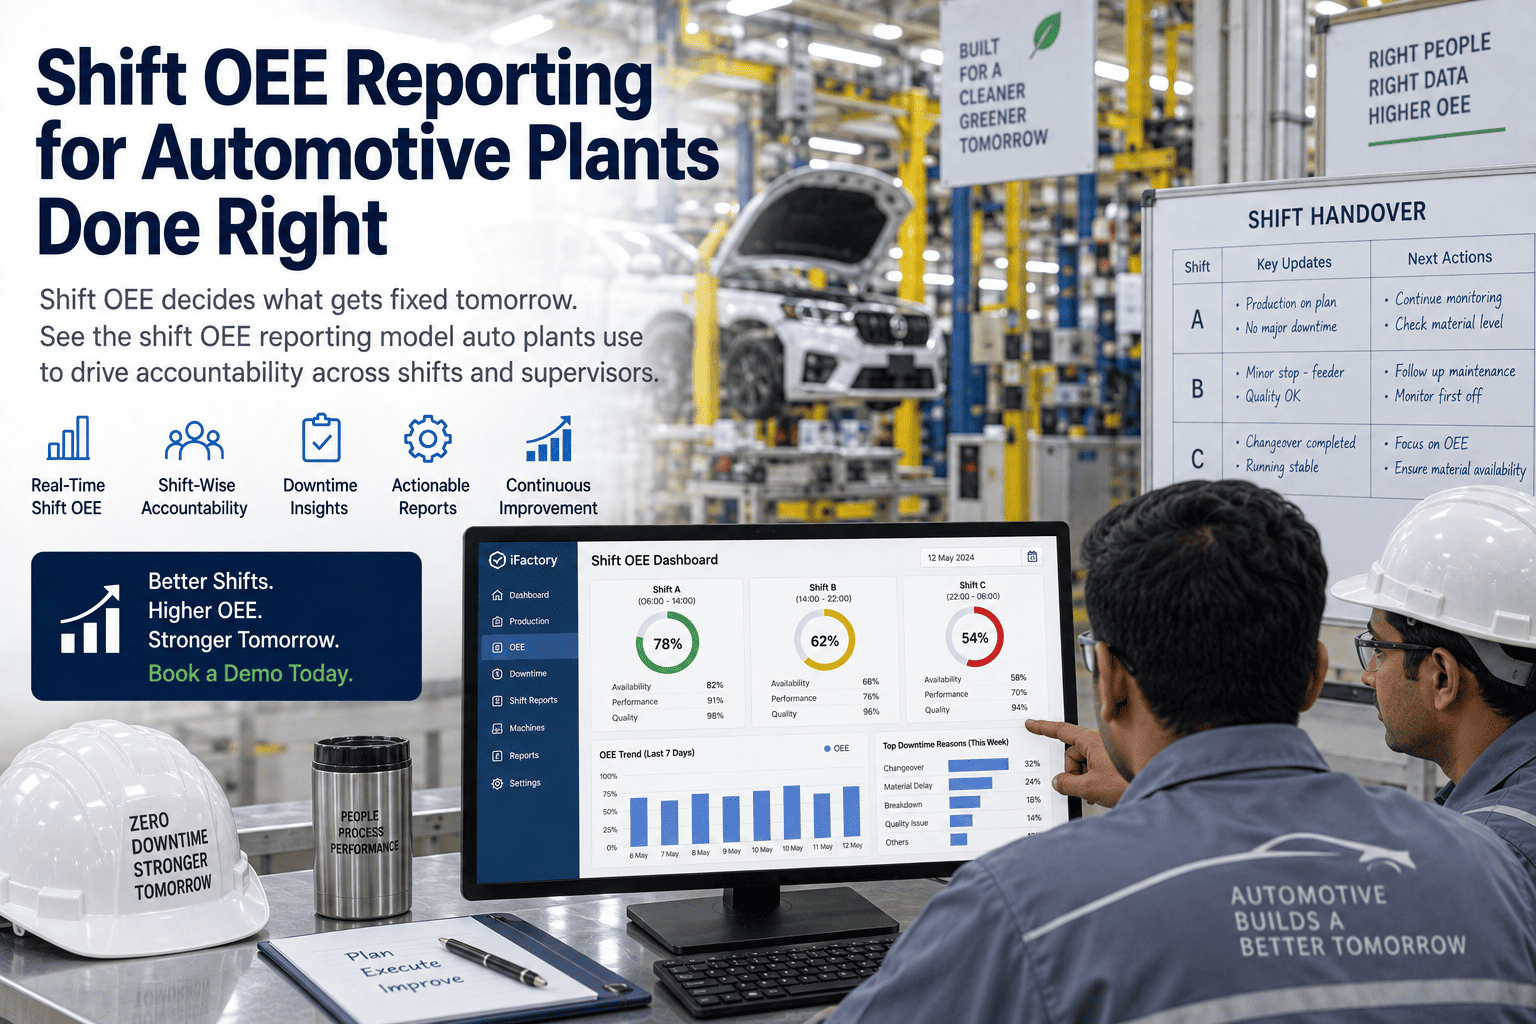
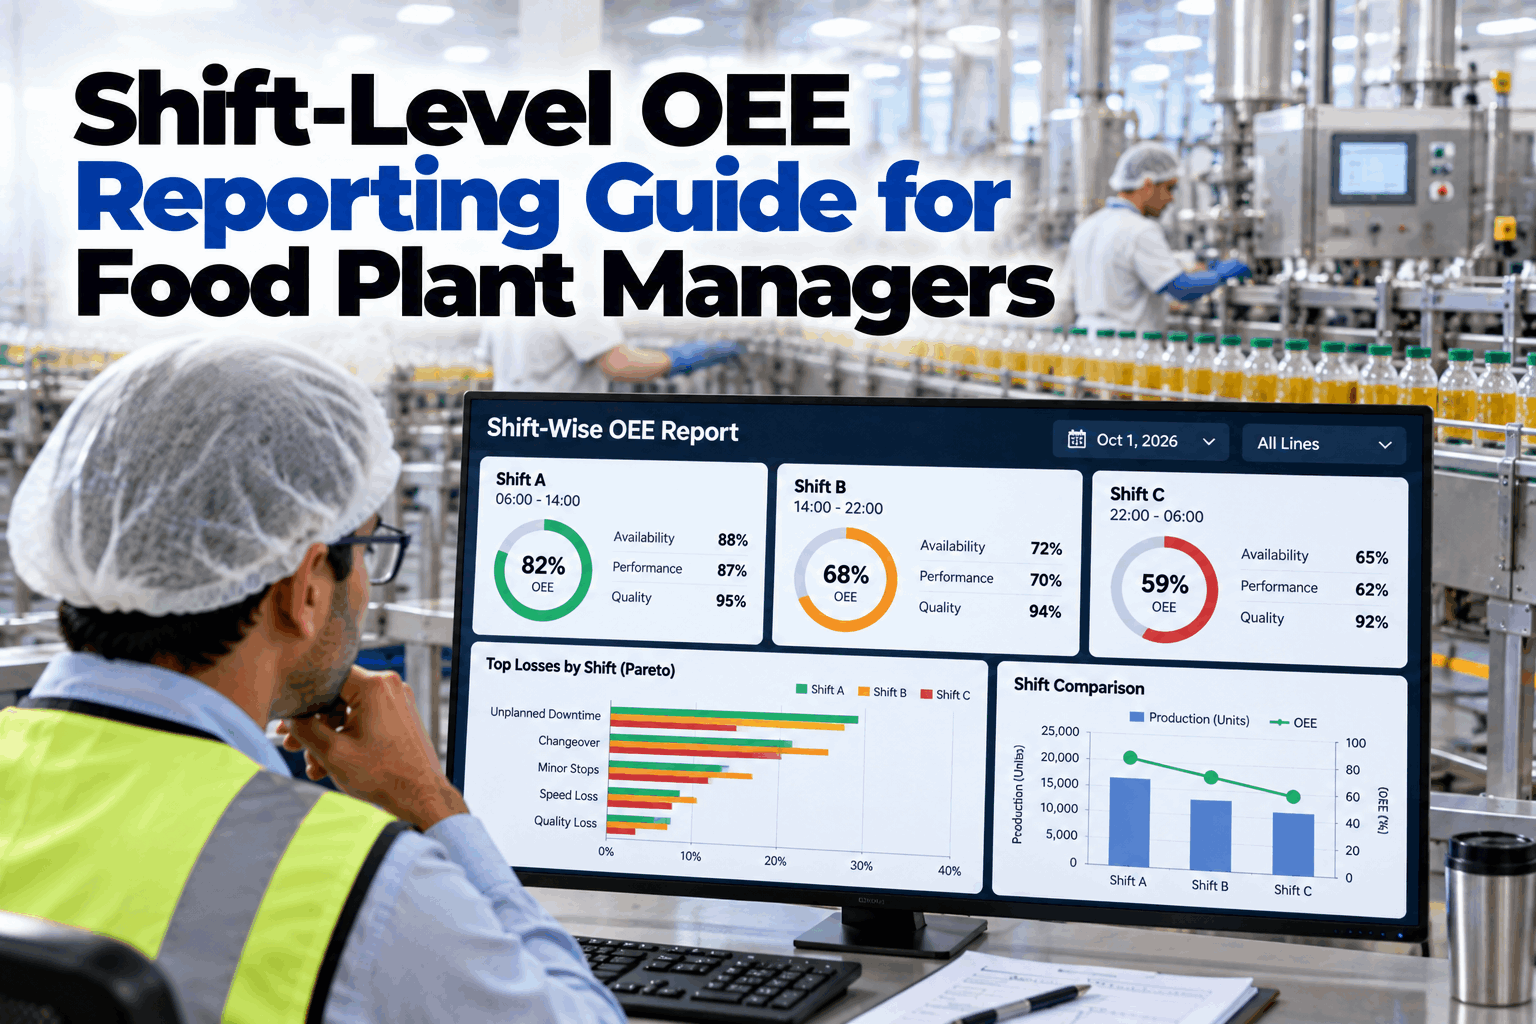
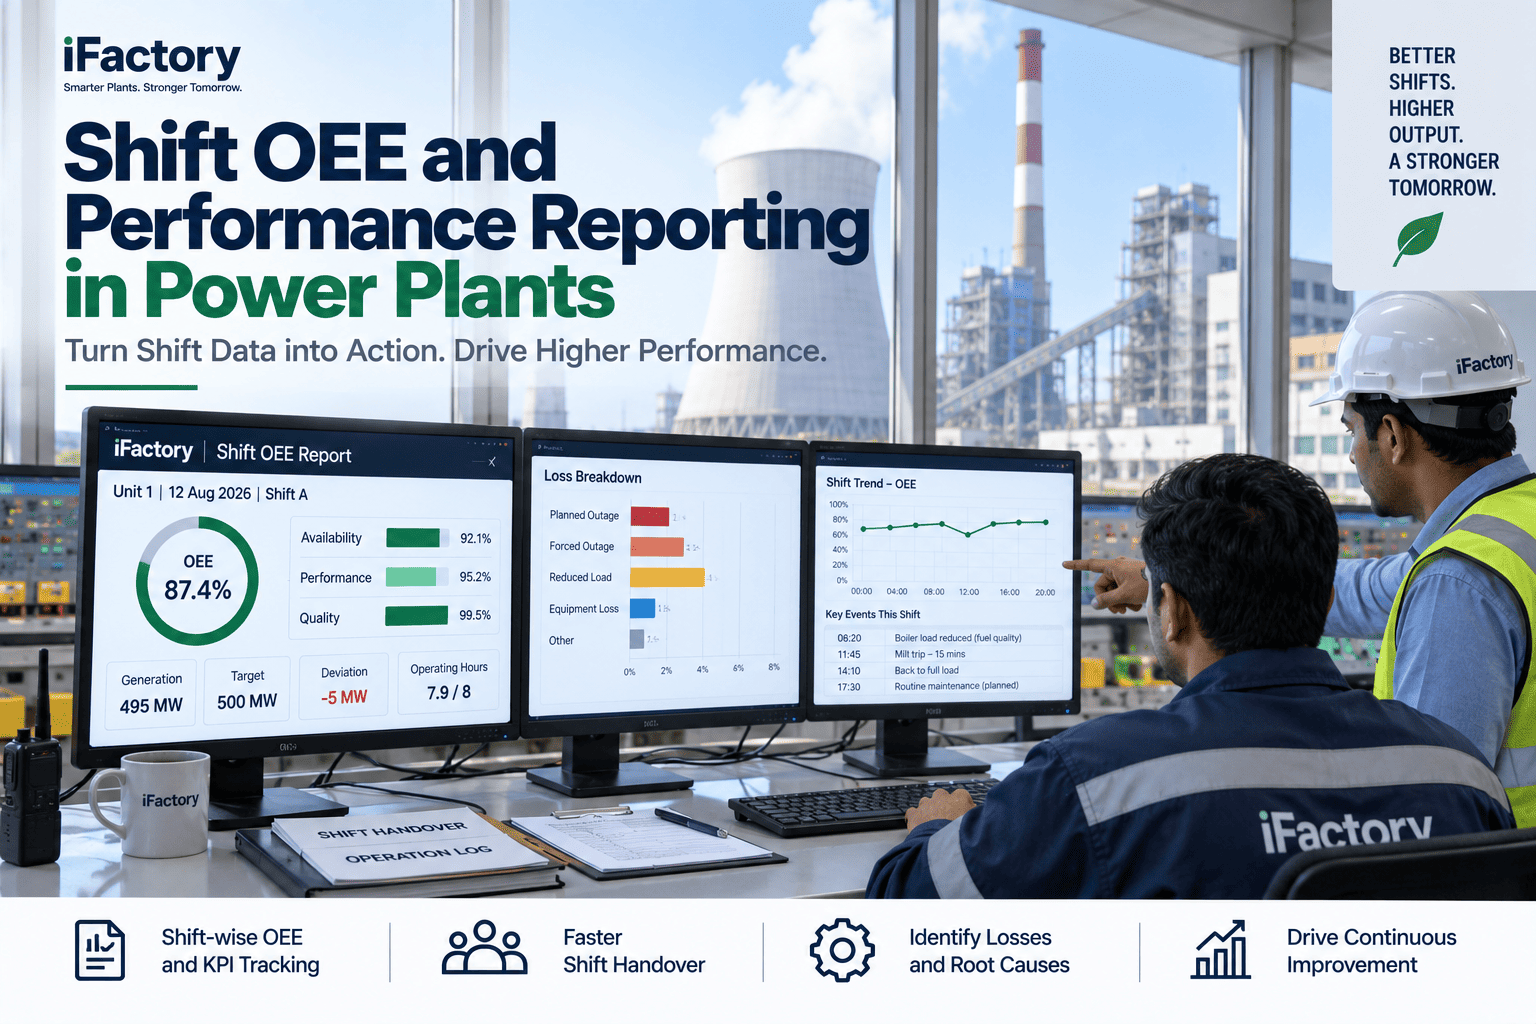
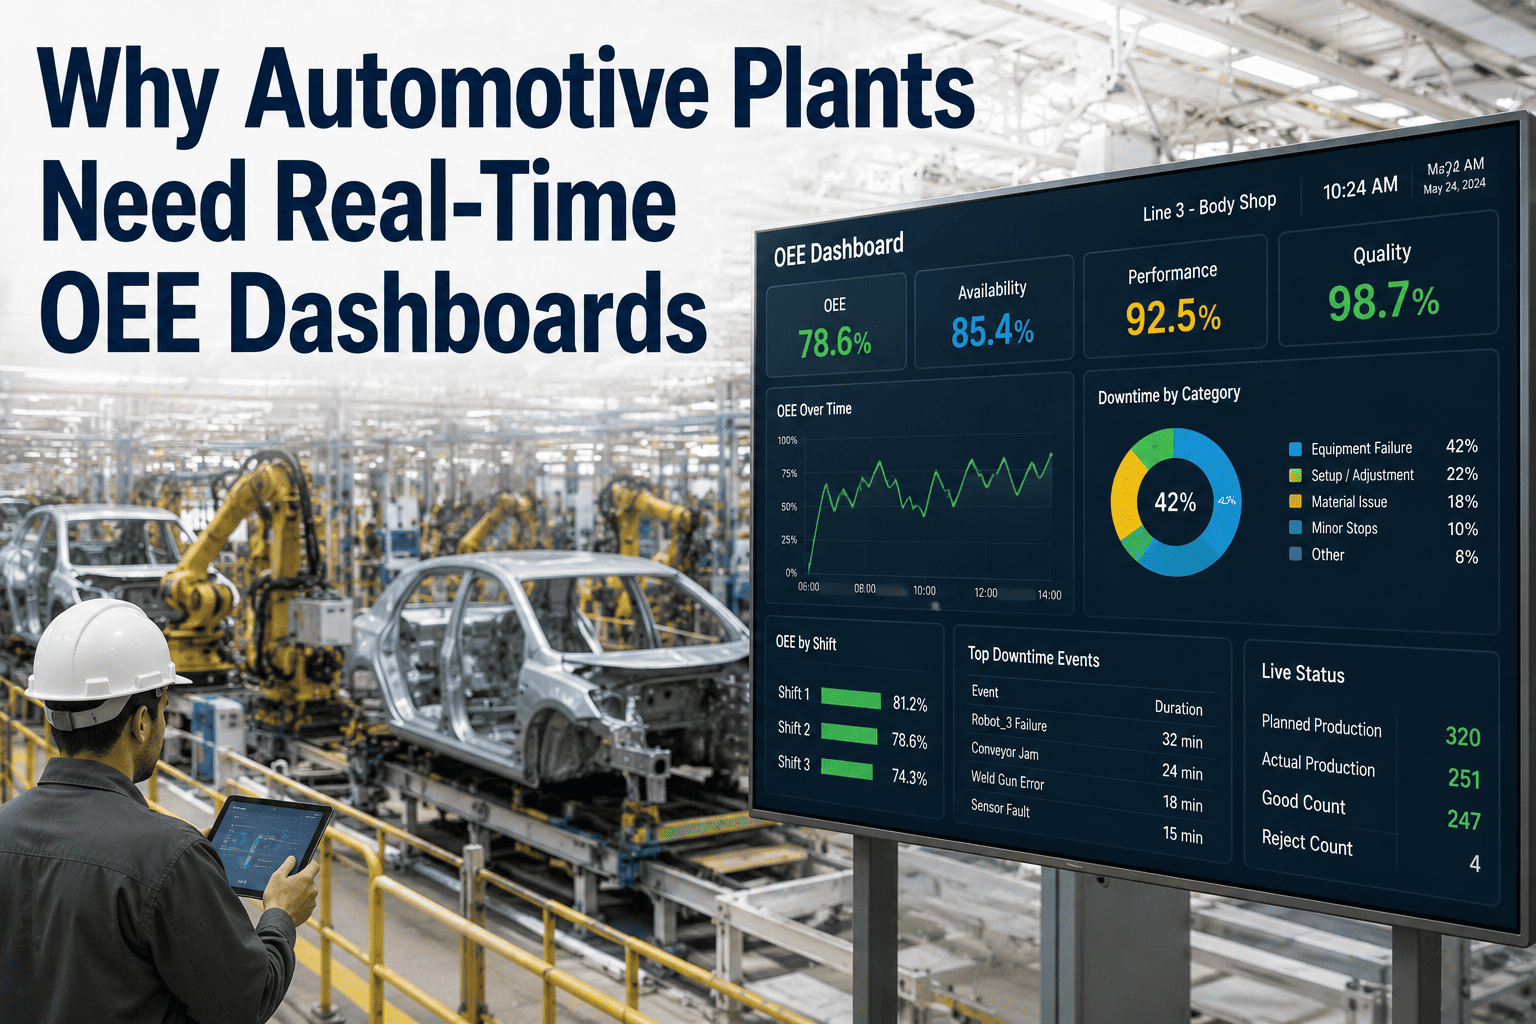
A plant-level OEE number is an average that hides the thing you need to know. When the daily report says the line ran at 68 percent, it tells you the plant has a problem — but not which of the three shifts lost the points, not which supervisor owns the fix, and not what to put at the top of tomorrow's meeting. Shift OEE reporting turns that flat average into an accountable one. Break the same number out by shift and the picture changes: nights lost twelve points to a recurring changeover overrun, days held steady, and now there's a name on the gap and a specific thing to fix. That's the real job here — not to score the plant, but to decide what gets fixed tomorrow. You can book a demo to see it across your own shifts.
SHIFT OEE REPORTING · AUTOMOTIVE · OPERATIONS
The Plant Average Tells You There's a Problem. Shift OEE Tells You Whose It Is.
A shift-level OEE reporting model turns a single daily number into per-shift accountability — so losses get owned, the morning meeting has a real agenda, and the fix list is set by data instead of by whoever spoke last.
WHY THE PLANT NUMBER ISN'T ENOUGH
An Average Is Where Accountability Goes to Hide
A single plant OEE figure is useful for a trend line and useless for action. It blends three shifts, several supervisors, and every asset into one number that no single person can be asked to move. When the plant reports 68 percent, day shift assumes it's a night-shift problem, night shift assumes it's an equipment problem, and the number drifts for months because it belongs to everyone and therefore no one. Shift-level reporting breaks that stalemate by attaching every lost point to a specific shift, on a specific line, with a specific cause — which is the difference between knowing you have a problem and knowing what to do about it in the morning.
The automotive context makes this sharper than in most industries. A car plant runs around the clock across multiple lines and often several buildings, with different crews, different maintenance coverage, and different levels of experience on each shift. Those structural differences are exactly what a plant average erases — the night shift with the newest operators and the thinnest maintenance support will run differently from the day shift with the veterans, and until you see the two numbers apart, you can't tell whether a loss is a process problem to fix once or a shift-specific gap to coach and support. The average treats a training issue and an equipment issue as the same 68 percent.
The Shift That Drags Is Invisible
One weak shift can pull the plant average down while two strong shifts mask it. Only a shift-wise breakout shows that nights are the real story, not the plant.
No Name on the Loss
A plant number can't be owned. A shift number can — the supervisor who ran those eight hours can be asked, specifically, what happened and what changes tonight.
Patterns Wash Out
The changeover that overruns every night, or the quality dip every Friday afternoon, disappears into a daily average and survives for months unaddressed.
The Meeting Runs on Opinion
Without shift-wise numbers, the morning production meeting debates whose fault it was from memory — and the loudest supervisor, not the data, sets the agenda.
TWO DOCUMENTS, OFTEN CONFUSED
The Shift Report and the OEE Report Do Different Jobs
A lot of reporting confusion comes from treating one document as two. The shift report is a handover — it exists so the incoming supervisor starts with full operational context. The OEE report is a performance record — it exists so management can see how the shift actually ran. They share source data, but they serve different readers and different purposes, and shift OEE reporting sits precisely where they meet.
Shift Report
A Handover for the Next Supervisor
Emphasizes open issues, equipment status, pending work orders, and continuity — the context the incoming shift needs to take ownership on walk-in. Its audience is the next supervisor, and its job is that nothing gets dropped at the boundary.
OEE / Production Report
A Performance Record for Management
Emphasizes target versus actual output, schedule attainment, OEE by factor, and the root cause of any shortfall — the performance picture management acts on. Its audience is the plant leadership who decide where tomorrow's effort goes.
Shift OEE reporting is the bridge: it draws from the same live shift data that feeds the handover, but presents it as per-shift performance that rolls into the daily production summary. Get this connection right and one set of numbers serves both the supervisor at 6 a.m. and the plant head at 9.
See Every Shift's OEE, Owned and Explained
iFactory generates the handover view and the OEE performance view from one live data source — so the incoming supervisor and the plant head both work from the same shift numbers.
WHAT A SHIFT OEE REPORT MUST CARRY
A Number Without Its Reason Is Not a Report
The most common failure in shift OEE reporting is recording the result and not the cause. "Actual output: 847 units" tells the next shift and the morning meeting nothing they can act on. A shift OEE report earns its place only when every number carries the context that makes it actionable. These are the fields that turn a score into a decision.
01
OEE Broken Into Its Three Factors
Not just the composite score, but availability, performance, and quality separately — because a shift at 68 percent from downtime needs a completely different fix than one at 68 percent from speed loss or scrap. The factor split tells you which lever to pull.
02
Target vs. Actual, With the Gap's Cause
Planned output, actual output, schedule attainment, and the root cause of any shortfall — a shift report that logs the actual without the target and the reason provides no actionable information at all.
03
Downtime, Coded by Reason
Every stop attributed to a reason code — changeover, breakdown, material shortage, minor stop — so the losses can be Pareto'd across shifts rather than logged as undifferentiated minutes nobody can analyze.
04
Work Orders and Open Actions
Any maintenance intervention referenced by work-order number, plus the open actions carried forward — so the next shift doesn't re-investigate a fault maintenance already touched, and nothing falls into the gap between shifts.
THE CADENCE THAT MAKES IT MATTER
The Report Only Works If It Drives the Morning Meeting
Shift OEE data that nobody reviews is just history. The value comes from a rhythm: every shift produces its numbers, and every morning those numbers set the day's agenda. In a three-shift automotive operation, the daily direction-setting meeting is where the manager-on-duty sees what the last three shifts did and turns the losses into today's fix list.
1
Each shift closes with its OEE. At shift end, the numbers are captured with their factor split, downtime codes, and shortfall causes — while the detail is fresh, not reconstructed later.
2
Handover carries the open issues forward. The incoming supervisor acknowledges the report and takes ownership of the unresolved actions — a clean accountability transfer at every boundary.
3
The morning meeting reviews all three shifts. The manager-on-duty compares shift-wise OEE side by side, sees which shift lost what and why, and the biggest loss becomes the day's priority.
4
Actions are assigned and tracked to close. Each fix gets an owner and a due point, and the next day's report shows whether it worked — closing the loop instead of restarting the debate.
Why entries improve the moment they're read
There's a behavioral effect worth naming: when supervisors know every shift's numbers will be reviewed side by side each morning, the quality of the entries improves on its own. A downtime code logged as "misc — 45 min" doesn't survive a meeting where the other two shifts coded their losses precisely. The review cadence isn't just how the data gets used — it's what makes the data honest in the first place, because transparency across shifts puts the onus on each one to account for its own hours.
WHERE SHIFT REPORTING BREAKS DOWN
Why Paper and Spreadsheets Can't Hold Shift Accountability
Most plants already do shift reporting in some form — a logbook, a spreadsheet, a verbal briefing. The trouble is that these methods lose exactly the things shift OEE accountability depends on. Here's where they fail.
The Number Arrives Too Late
A spreadsheet compiled hours after the shift means the morning meeting reviews stale data, and the causal detail is already fading from memory by the time anyone looks.
No Cross-Shift Comparison
Three separate logbooks can't be laid side by side, so the pattern that only appears when you compare shifts stays invisible — the exact insight shift reporting exists to surface.
Handover Without Acknowledgement
A report nobody has to confirm they read is a report nobody owns. Without an acknowledgement step, open issues quietly evaporate at the shift boundary.
Manual Entry, Inconsistent Coding
When downtime reasons are typed freehand each shift, the codes don't match across shifts and can't be Pareto'd — so the biggest recurring loss never rises to the top.
HOW iFACTORY DOES SHIFT OEE REPORTING
One Live Source, Every Shift Accountable
iFactory captures OEE continuously and presents it by shift, so the handover view and the performance view come from the same data and the morning meeting runs on numbers instead of memory. It's built for the automotive reality of three shifts, multiple lines, and often several buildings.
1
OEE captured live, split by shift. Availability, performance, and quality are computed continuously from line data and attributed to the shift that ran them — no manual tally at shift end.
2
Downtime coded consistently. Stops are captured against a standard reason-code set across every shift and line, so losses Pareto cleanly and the biggest recurring one is always visible.
3
Handover with enforced acknowledgement. The incoming supervisor confirms receipt on any device, creating a timestamped ownership record and carrying open actions across the boundary.
4
Shift-wise dashboard for the morning meeting. All three shifts side by side, with factor split and top losses ranked — the agenda builds itself, and yesterday's actions show whether they worked.
1000+
Industrial clients running iFactory across operations
99.9%
Platform uptime for continuous OEE capture
6-12 wks
Typical time from manual logs to live shift reporting
FREQUENTLY ASKED QUESTIONS
What Operations Teams Ask About Shift OEE Reporting
Why report OEE by shift instead of just tracking the plant number?
Because the plant number tells you there's a problem but not who owns it or what to do about it. A single daily figure blends three shifts and several supervisors into one average that no individual can be asked to move, so a weak shift hides behind two strong ones and the number drifts for months. Breaking OEE out by shift attaches every lost point to a specific shift, line, and cause — which is what makes the morning meeting actionable, because now there's a named owner and a specific fix rather than a debate about whose fault it was. Shift-level reporting doesn't add work so much as it makes the work you already do accountable.
Book a demo to see the shift-wise view.
What's the difference between a shift report and an OEE report?
They serve different readers. A shift report is fundamentally a handover document — its structure emphasizes open issues, equipment status, and pending actions, and its purpose is to give the incoming supervisor complete operational context so nothing gets dropped at the boundary. An OEE or production report is a performance document — it emphasizes target versus actual output, schedule attainment, OEE by factor, and downtime analysis, and its audience is the management team deciding where tomorrow's effort goes. In practice many plants need both, drawn from the same shift data: the handover view for the supervisor and the performance view for leadership. The key is that they come from one source, so the 6 a.m. supervisor and the 9 a.m. plant head aren't working from different numbers.
Support can show both views from one data set.
How long should filling in a shift OEE report actually take?
The performance data itself should be automatic — availability, performance, and quality computed from live line data rather than tallied by hand — so the supervisor's job is to add the qualitative context, not to calculate the numbers. When the OEE, output, and downtime sections auto-populate, a supervisor only needs to confirm the figures and add the causal notes and open-issue detail, which on a typical automotive line is a few minutes rather than the half-hour a manual spreadsheet demands. If your shift report takes long enough that supervisors resent it or rush it, the format is either too complex or the data isn't being captured automatically — and rushed reports are the ones that hide the very losses you're trying to surface.
How does shift OEE reporting drive the daily production meeting?
It gives the meeting its agenda. In a three-shift operation, the daily direction-setting meeting is where the manager-on-duty reviews what the last three shifts did — and with shift-wise OEE laid side by side, the losses rank themselves, so the biggest one becomes the day's priority automatically rather than emerging from whoever argues hardest. Each action gets an owner and a due point, and the next day's report shows whether it worked, which closes the loop instead of restarting the same debate. There's also a discipline effect: when supervisors know their shift's numbers will be compared with the other two every morning, the quality and honesty of the entries improves on its own, because a vague downtime code doesn't survive that comparison.
Does this connect to our line controls, MES, and ERP?
Yes — shift OEE reporting is only as good as the data feeding it, so the reporting layer connects to the systems that already hold that data. iFactory reads from line controls and machine data for the availability, performance, and quality inputs, links active work and production orders to the ERP for WIP traceability and cost accounting, and ties maintenance interventions to their work-order numbers so a fault isn't investigated twice across shifts. That connection is what lets the report auto-populate its performance sections and lets a shift number trace back to the specific line, order, and cause behind it. Integration is scoped to fit the control and business systems you already run rather than replacing them, so shift OEE reporting sits on top of your existing floor.
Give Every Shift a Number It Owns
iFactory reports OEE shift by shift from one live source, enforces accountable handover, and builds the morning meeting's agenda automatically — so losses get owned, fixes get tracked, and the plant average finally starts moving.