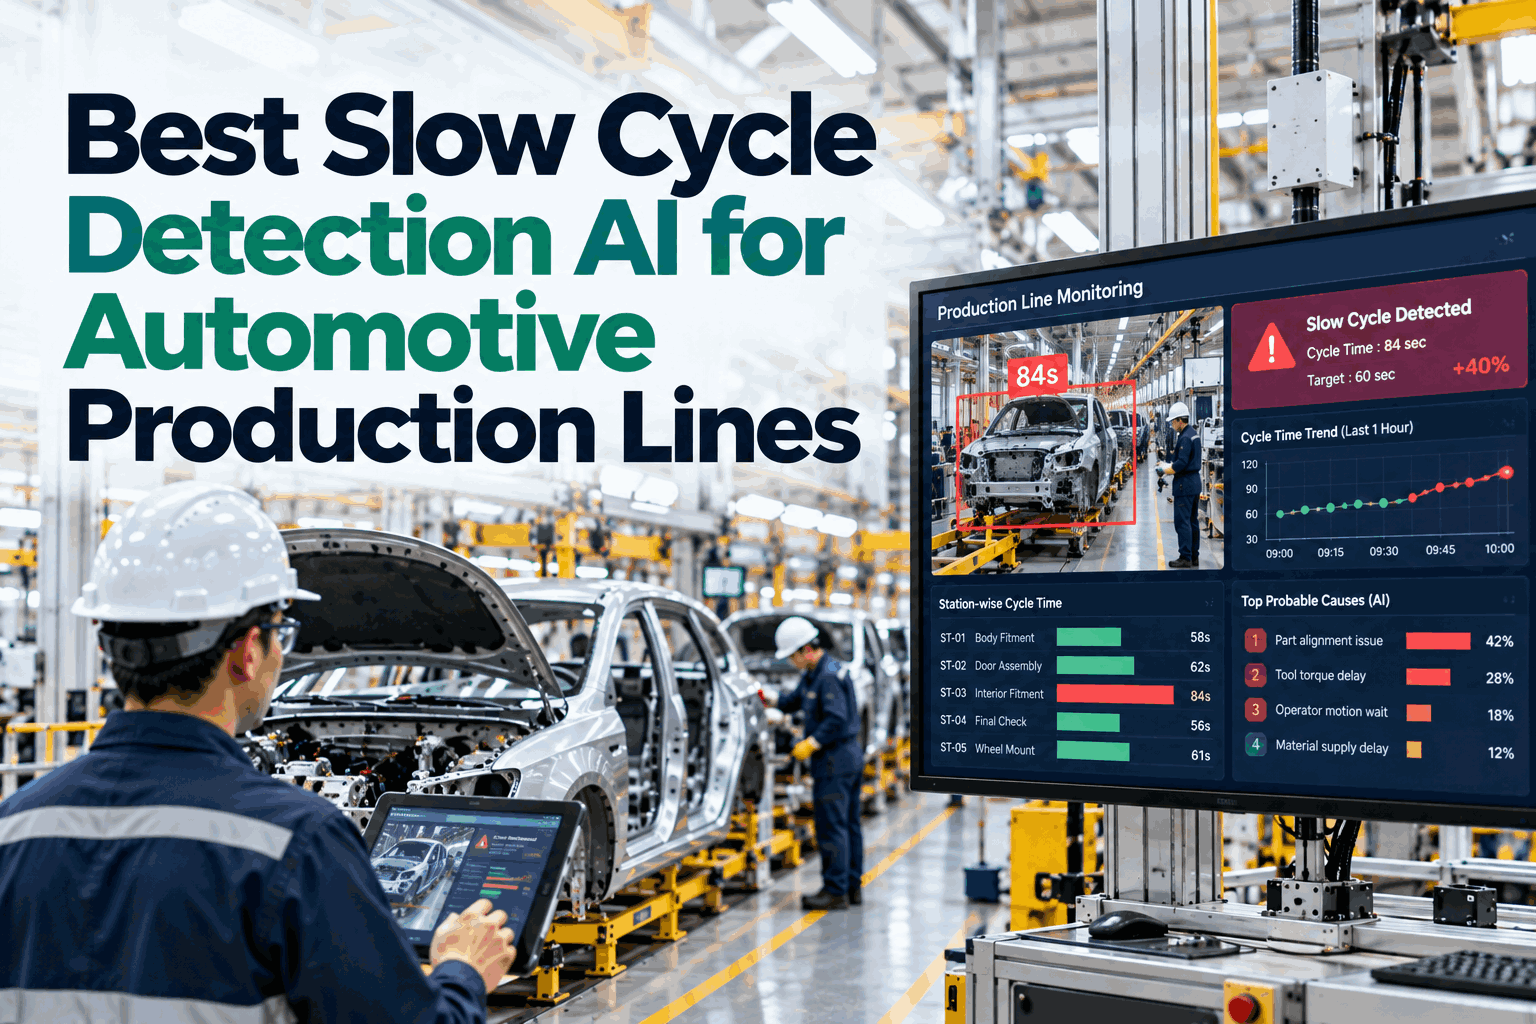
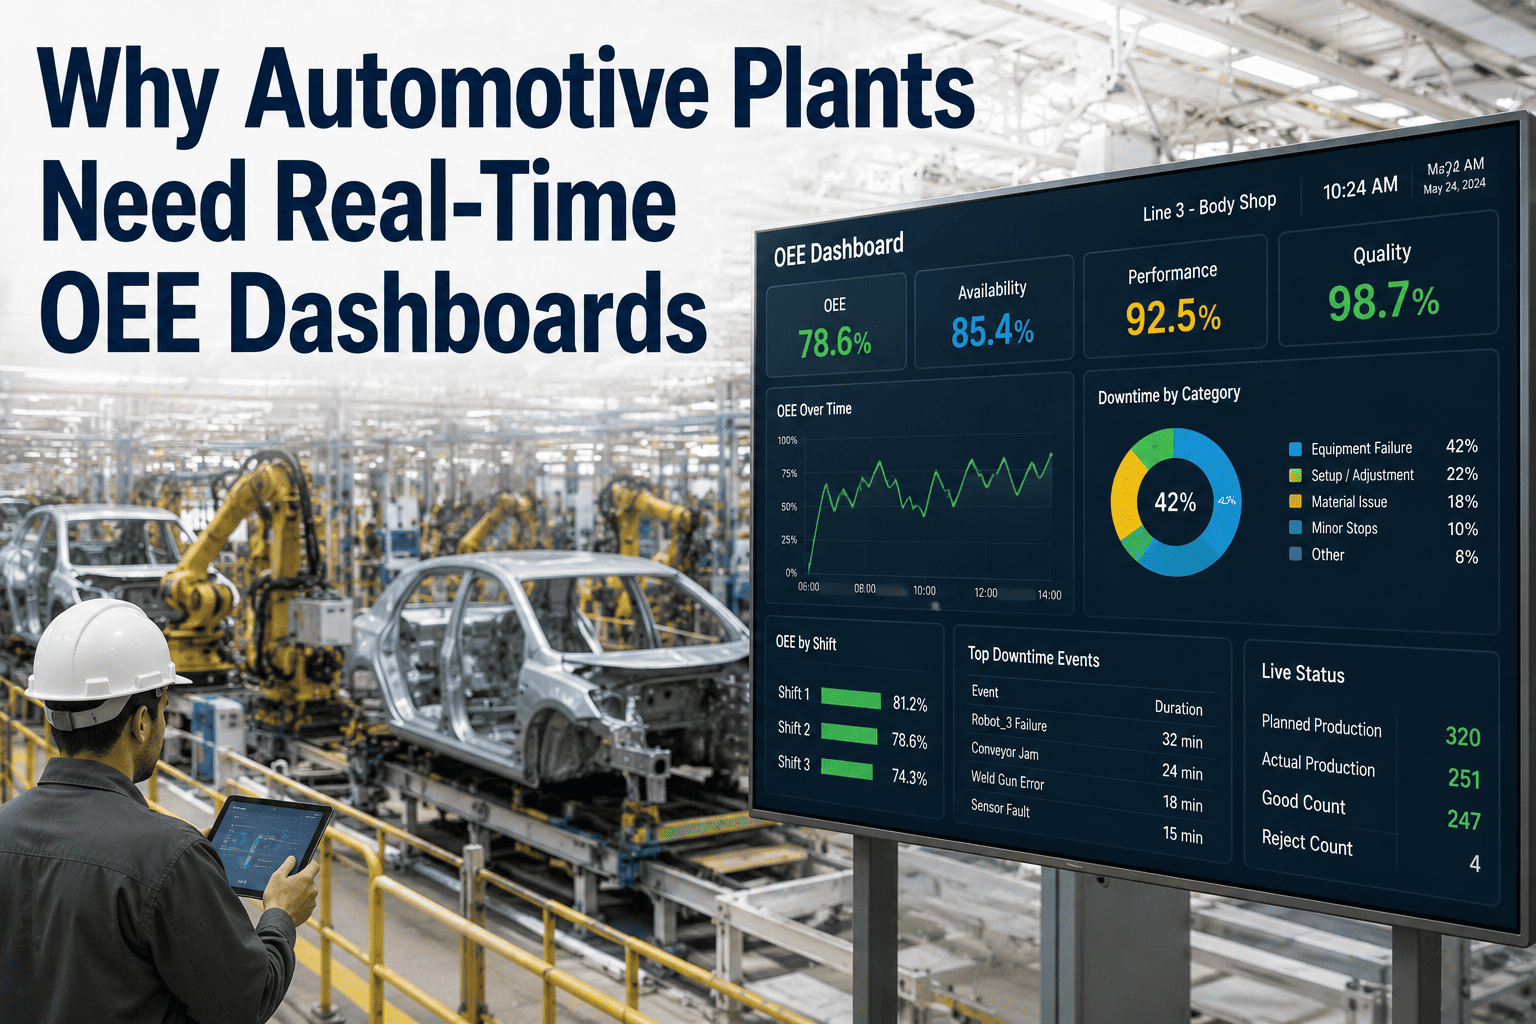
It is 10:00 on the morning shift and an operator glances at the screen above the line. JPH is tracking two units behind target, first-time quality just dipped below 95%, and a station three bays down has logged its third micro-stop in twenty minutes. None of this is a surprise — because it is all on one screen, updating every minute. That is the difference a live dashboard makes. Plants without real-time visibility average 33% more unplanned downtime and 2.4 times higher scrap than facilities running live KPIs, because by the time a problem shows up in tomorrow's report, it has already cost a shift of output. The fix is not more data. A line generates hundreds of data points an hour. The fix is the right handful of numbers, in front of the right people, at the right moment — and a real-time execution dashboard is how operators stay ahead of the line instead of chasing it.
iFactory Production Execution
Top KPIs Every Automotive Plant Manager Should Track Live
JPH, OEE, FTQ, scrap, fall-off rate and more — the ten numbers that belong on a single hourly dashboard, so the floor catches problems while there is still time to fix them.
85%+
World-class OEE target
33%
More downtime without live KPIs
2.4×
Higher scrap when flying blind
24%
Higher OEE with formal KPI program
What an Operator Actually Sees at the Line
Forget the executive roll-up. An operator dashboard is glanceable, current-shift, and brutally focused — three to five numbers that say whether this hour is on track. Here is the live picture the floor needs, updating in real time, color-coded so a problem reads from across the bay.
Line 3 — Final Assembly — Morning Shift
LIVE · 10:00
JPH (Jobs / Hour)
58
Target 60
First Time Quality
94.6%
Target 96%
Shift Attainment
98%
On schedule
Active Downtime
7 min
Station 14 fault
Scrap This Shift
0.4%
Target <0.5%
On target
Watch — drifting
Action needed now
The Ten KPIs That Earn Their Place on the Screen
Track more than a dozen and nobody reads the board; track fewer than seven and you lose the visibility to improve. These ten cover the questions every shift has to answer: are we producing enough, is it good, and are we using the line well?
01JPH — Jobs Per Hour
The heartbeat of an auto line. Actual units off the line each hour versus takt-driven target. The first number anyone checks.
02OEE
Availability × Performance × Quality in one score. Auto plants typically run 55–75%; world-class is 85%+. The master productivity metric.
03FTQ / First Pass Yield
Share of units built right the first time, no rework. The most direct read on process and operator effectiveness.
04Scrap Rate
Unsalvageable parts as a share of production. Catch it at 0.5% and it's a tweak; ignore it and it becomes 5% and a crisis.
05FOR — Fall-Off Rate
Units that fall out of the standard flow for repair or rework before final. A leading indicator of downstream rework load.
06Unplanned Downtime
Stopped minutes per shift with reason codes. The single biggest controllable drain on JPH, and the one operators can act on fastest.
07Availability
Share of scheduled time the line is actually running. Thin-buffer auto lines need 95–98% on bottleneck operations to hold takt.
08Schedule Attainment
Planned units versus actual for the shift. Tells you in real time whether you'll make the build plan or owe recovery overtime.
09Cycle Time
Actual station time versus takt. Creeping cycle time is how performance loss hides inside an OEE that still looks fine.
10Andon Response Time
How fast a raised call gets resolved. A missed alert turns into hours of scrap; routing speed is a KPI in its own right.
Want this exact set of metrics wired to your line and color-coded for your targets? Book a 30-minute dashboard walkthrough and we'll configure a live operator view on your data.
The Same Data, Three Audiences
The single biggest mistake in dashboard design is showing everyone the same screen. Operators do not need plant-wide roll-ups; executives do not need station-level cycle time. Effective dashboards are tiered — each level sees the slice it can act on, at the cadence that matches its decisions.
Tier 1Operator
Station-level · sub-minute refresh
3 to 5 glanceable numbers: current JPH, this-hour downtime with cause, current SKU and cycle time, shift target versus actual. Large, high-contrast, readable across the bay.
Tier 2Supervisor
Zone-level · hourly
OEE by line, downtime Pareto, FTQ and scrap trend for the shift, Andon calls by station. Enough to redirect people and chase the top loss right now.
Tier 3Plant Manager
Plant-level · daily / weekly
Plant OEE, schedule attainment, cost-per-unit trend, on-time delivery, safety. The roll-up for steering and reporting, not for floor reaction.
What "Good" Looks Like in an Auto Plant
Benchmarks are starting points, not finish lines — calibrate to your own line. But these orders of magnitude tell you whether a number needs attention, is average, or is genuinely world-class for automotive manufacturing.
KPI
Needs Attention
Average
World-Class
OEE
Below 65%
65–85%
85%+
Availability (bottleneck)
Below 90%
90–95%
95–98%
First Pass Yield
Below 90%
90–96%
98%+
Scrap Rate
Above 2%
0.5–2%
Below 0.5%
Data accuracy (manual logs)
30–50%
Automated capture
Near real-time, automatic
From Number on a Screen to Fix on the Floor
A KPI only earns its place if it triggers action. The point of a live dashboard is to compress the loop between a metric drifting and someone doing something about it — from tomorrow's report to this hour's shift.
The Live KPI Action Loop
1
Capture
Auto Data
Counts, states, and quality pulled from the line — no paper logs, no 30% error
2
Surface
Glanceable
The right 3 to 5 numbers per audience, color-coded against target
3
Alert
Andon & Route
A drift or fault raises a call routed to the person who can resolve it
4
Resolve
Same Shift
Problem fixed and logged with cause while there's still output to save
Why It Pays Back
Live KPI visibility is not a reporting nicety — it converts straight into uptime, yield, and cost. The numbers below come from KPI and dashboard field data across manufacturing in 2025 and 2026.
24%
Higher OEE
for plants with formal KPI programs vs none
18%
Better on-time delivery
with structured measurement in place
33%
Less unplanned downtime
vs plants without real-time OEE dashboards
2.4×
Lower scrap
with live monitoring vs flying blind
These gains start with getting the right numbers off paper and onto a live screen. Want to see the operator board configured to your line? Talk to our production engineers.
Frequently Asked Questions
How many KPIs should actually be on an operator screen?
Three to five. An operator board is for instant reaction, not analysis — current JPH, this-hour downtime with cause, current SKU and cycle time, and shift target versus actual cover it. Roll-ups and trends belong on the supervisor and plant tiers, not the line.
What is a realistic OEE target for an automotive plant?
Most discrete automotive operations run 55 to 75%, with world-class at 85% or higher. Don't chase a single plant-wide number, though — plant-level daily OEE is for reporting. Real improvement comes from OEE measured per line or machine at hourly or shift granularity.
Should rework count against scrap or against quality?
Pick one and stay consistent. Rework wastes time but the part eventually becomes good, so count rework time as either a performance loss or a first-pass-yield (quality) loss — never both. Double-counting it is one of the most common ways OEE numbers get quietly distorted.
How accurate is the data if operators log it on paper?
Roughly 30 to 50% accurate at best. Manual downtime logs miss micro-stops, get backfilled from memory, and arrive too late to act on. Automatic capture from the line is what makes the rest of the dashboard trustworthy — without it, you're improving against fiction.
What's the difference between FTQ and scrap rate?
FTQ measures how often you build it right the first time with no rework — a process-health read. Scrap rate measures how much material is lost entirely. A unit can hurt FTQ (needed rework) without becoming scrap, so tracking both shows whether your problem is process variation or outright waste.
Stop Reading Yesterday's Report.
See Your Plant's KPIs Live — On a Real Operator Board, in 30 Minutes
Bring your line's targets and reason codes. We'll stand up a live, tiered dashboard — JPH, OEE, FTQ, scrap, downtime, all color-coded — and show your floor exactly what they'd see at 10:00 on a Tuesday. Your numbers, glanceable, in real time.
10
Live KPIs on one board
3
Tiers, one source of truth
<1 min
Operator refresh cadence
85%+
OEE world-class line