A production line does not have to stop to lose cars. If one station takes two seconds longer than it should on every cycle, the line still runs, no alarm sounds, nobody writes anything in the shift log, and about fifteen fewer vehicles come off the end. That is a slow cycle, the quietest loss in an automotive plant. This guide explains what slow cycle detection AI does: how it spots a small deviation from target cycle time, how it finds the step that got slower, and how it names the one station that is really to blame. It also sets out what to look for when choosing a system, and where iFactory fits. To see it on your own line, book a cycle review.
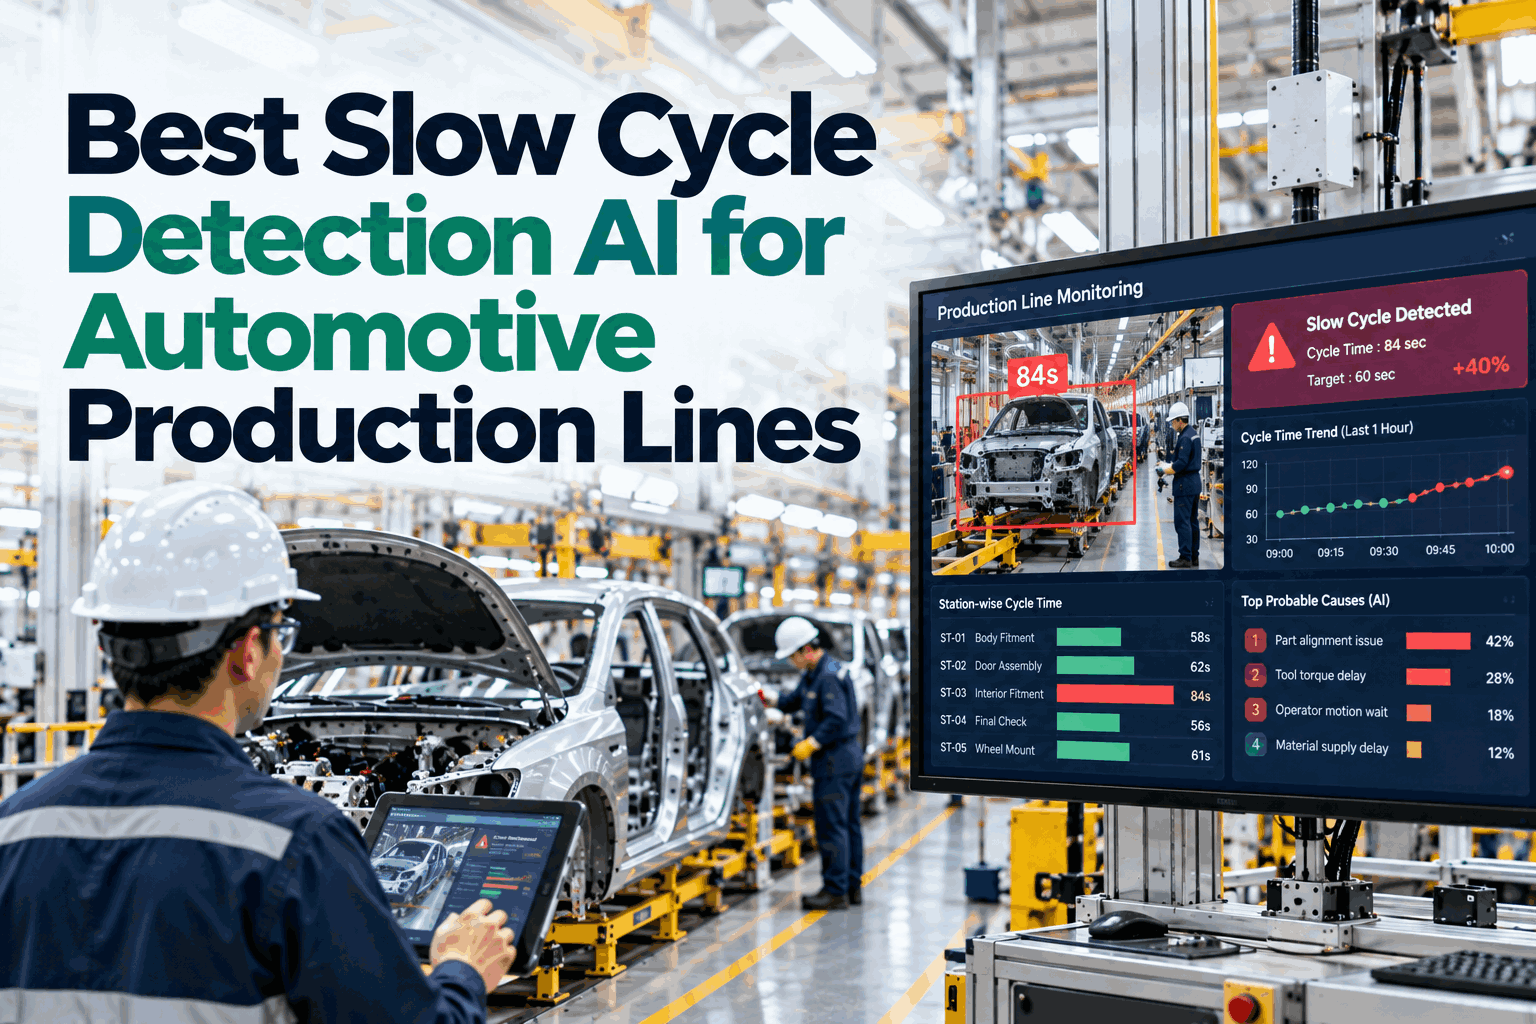
Best Slow Cycle Detection AI for Automotive Production Lines
Find the station that is a little late on every cycle, the step inside it that changed, and the likely reason, before the shift ends short.
- Catches drifts of a second or two, not only stops
- Shows which step inside the cycle got slower
- Names the station at fault, not the ones left waiting
The arithmetic of two seconds. Nothing broke and nothing stopped, so on paper nothing happened.
What a Slow Cycle Is, and Why Nobody Sees It
A slow cycle is a cycle that finished. It just finished late.
The standard definition is simple: the equipment runs slower than its ideal cycle time. Wear, poor lubrication, off-grade material and inexperience are the textbook causes. The trouble is that a slow cycle looks exactly like a normal one unless somebody is timing it, and on a line with hundreds of stations nobody is. Our support team can show how your stations are timed today.
From cycle 13 every cycle is about two seconds long. No single cycle looks alarming. The pattern is the problem.
Five reasons it stays hidden
- No alarm. The cycle ends inside the controller's time limit.
- Averages. A shift average blends slow hours with normal ones.
- Buffers. Stock between stations soaks up the delay for a while.
- Habit. People adjust to the new rhythm within a day.
- Old targets. If the target was set loosely, slow looks like on time.
How AI Detects a Slow Cycle
Learn what normal looks like for each station and each model. Then watch for small changes that last.
The method is easy to describe and hard to do by hand. Every cycle of every station is timed from signals the controllers already produce. The AI learns the usual time for each model on each station, and flags the moment that usual time moves. To see it running on your own stations, book a live session.
Time every cycle
Start and finish signals from the controller, for every body, on every shift.
Learn the baseline
The normal time for this station building this model, not one target for all.
Spot the shift
A small change that persists matters more than one long cycle.
Rank by vehicles
Order the findings by cars lost, so the costly one is first.
Three shapes a slow cycle takes
The step
Normal yesterday, two seconds slower today. Something was changed: a setting, a program, a part.
The creep
A tenth of a second a week, for months. Something is wearing out.
The scatter
The average holds but cycles vary more. Material, part fit or manual work is uneven.
Why a fixed limit fails
Say model A needs 58 seconds at a station and model B needs 61. Put one limit at 60 seconds and every B is flagged, while an A that has slowed to 59.5 passes.
A baseline for each model at each station avoids both mistakes. It is also what makes a one-second change visible at all.
Why special statistics help
Ordinary control charts are built to catch big, sudden jumps. For a small shift that lasts, they are slow: about 44 samples on average, in one published comparison.
Charts designed for small shifts catch the same change in about 10. On a line, that is ten minutes instead of most of an hour.
A new model year, a new variant or a changed process gives a station a new normal. Good software notices that the mix has changed, proposes a fresh baseline, and waits for an engineer to approve it. Without that step, every launch drowns the line in false alerts, and people stop reading them.
Root Cause: Which Step Inside the Cycle Got Slower
Knowing a station is two seconds slow is half the answer. The other half is which two seconds.
A cycle is a chain of steps: the part arrives, clamps close, the robot moves in, the process runs, everything retreats, the part leaves. The controller already knows when each step starts and ends. Compare each step with its own baseline and the slow one stands out. Ask our diagnostic specialists how this maps onto your controllers.
Illustrative. Both clamp moves are slower and nothing else has changed, which points at the air supply or the clamps, not the robot or the weld.
The usual suspects
What Two Seconds Cost
The sum is simple, and it surprises most people the first time. Put your own cycle time and shift pattern into it.
Station-Level Attribution: Finding the One That Matters
On a connected line, when one station is slow, every station looks slow.
Stations after the slow one wait for parts. Stations before it cannot release theirs. Measure the full cycle at each and all five show the same two seconds. The useful question is different: how long did each station spend on its own work? Only one will be over target. To run this on your line data, book an attribution session.
Illustrative. Five stations look equally slow. One is. Maintenance should go to UB-30 and nowhere else.
Two questions for every slow station
- Is it its own work? Separate working time from time spent waiting or blocked.
- Does it limit the line? A slow station only costs vehicles if it is the bottleneck, or is eating the buffer in front of one.
Rank what is left by vehicles lost per shift. The list is usually short.
What about manual stations?
A controller can time a robot. It cannot time a person fitting a harness. For manual work the usual route is a camera and vision AI that measure each work cycle.
Toyota announced 500 such AI devices across 14 North American plants. Done well, the aim is to fix the station, the tool or the part presentation, not to time the person.
What to Look For in Slow Cycle Detection AI
Eight things the best systems do. Ask any vendor, including us, to show each one on your line.
There is no league of slow cycle products to rank, and a vendor's own ranking would be worth little. What can be judged is whether a system does these eight things on real data from your stations. iFactory is built to do them, sitting above the controllers and MES you already have. Our integration team can confirm what your line already provides.
Times every cycle by itself
No stopwatch studies, no sampling, no operator input.
Keeps a baseline for each model
At each station, so mixed production does not cause false alerts.
Catches small lasting shifts
A second that persists, not only a cycle that is wildly long.
Breaks the cycle into steps
So the finding is "clamps", not "station slow".
Separates work from waiting
Starved and blocked time is never charged to the wrong station.
Ranks by vehicles lost
Bottleneck first. A long list of equal alerts helps nobody.
Explains itself in plain words
What changed, since when, the likely cause and what to check first.
Re-learns after planned changes
New model year or variant: a new baseline, approved by an engineer.
One set of data, three views
- Team leader. Which of my stations is running slow right now, and which step.
- Maintenance. A short ranked list with the likely cause and first check for each.
- Shop manager. Vehicles lost to slow running this week, by line and by station.
iFactory advises. Line controls, robot programs and safety systems stay as they are.
Turnkey AI: Delivered, Connected and Live in 6–12 Weeks
You do not build this. It arrives ready.
iFactory ships as a pre-configured NVIDIA AI server, racked and ready, with the software pre-loaded. Rack it, plug in power and Ethernet, and the AI is live on your network.
Our team handles cabling, network setup, PLC and SCADA integration, operator training and 24×7 remote monitoring. The server sits inside your own network, so line data stays on site. For a scope matched to your lines, request a turnkey quote.
Ship, network and data
Server installed. Cycle and step signals read from the controllers on one line. Model and variant codes linked to each cycle.
Model training and pilot
Baselines learned for each station and model. First findings checked on the floor with maintenance, and alert levels tuned.
Go-live and training
Ranked slow-cycle list live for the pilot line. Team leaders and maintenance trained. 24×7 remote monitoring begins.
Frequently Asked Questions
What is a slow cycle?
A cycle that completes, but takes longer than the station's ideal cycle time. Nothing stops and no fault is raised. In OEE terms it is a performance loss, sometimes called reduced speed. Because each one costs only a second or two, slow cycles are usually the least visible loss on a line.
How is a slow cycle different from a short stop?
In a short stop the station halts briefly, often for a jam or a blocked sensor, and an operator clears it. In a slow cycle the station never halts; it simply runs under rate. Short stops show up as gaps. Slow cycles show up only when every cycle is timed.
How does AI detect slow cycles?
It times every cycle from controller signals, learns the normal time for each model at each station, and watches for a small change that lasts. It then compares each step inside the cycle with its own baseline to show where the extra time went.
What causes slow cycles on automotive lines?
Most often wear and settings. Air cylinders and clamps slow as seals wear or pressure falls. A robot speed override is left low after maintenance. A sensor takes longer to confirm. A process parameter is changed. At manual stations, part presentation and tooling are the usual reasons.
Does every slow station cost output?
No. Only a station that limits the line, or that is using up the buffer in front of the one that does. A slow station with time to spare costs nothing today, though it may be an early sign of wear. Good software ranks findings by vehicles lost for exactly this reason.
What happens at a model-year change?
Cycle times change, so the baselines must change too. The software should recognise the new model or variant, propose a baseline from the first steady cycles, and ask an engineer to approve it. Until then it should hold back alerts for that model, not flood the line with them.
How long does it take to go live?
Six to twelve weeks from delivery for a first line. We need a place for the server with power and Ethernet, read access to controller signals and model codes, and time with your maintenance and line teams. To check your set-up first, contact our team.
Bring One Line That Runs but Falls Short
In thirty minutes we look at a line that rarely stops and still misses its count. We show how its stations would be timed, and what a first ranked list would contain. You keep the outline either way.
- 1Target and actual vehicles per shift for the line
- 2A station list with design cycle times
- 3Your controller makes and what they record
- 4The models and variants that run on the line
- 5Any station your team already suspects