Your line is only as fast as its slowest station. If takt is 58 seconds but Engine Decking is quietly running 59, then 60, the entire line produces at the slower pace — you are paying for twelve stations and getting the throughput of the one that drifted over. The maddening part is that this is almost invisible from the floor: every station looks busy, the cars keep moving, and the lost units never show up as a stoppage. They just never get built. Traditional time studies can't catch it either — a manual study can burn 48 hours to yield 15 minutes of data. AI cycle-time monitoring watches every station against takt continuously, lights up the ones creeping over, and helps you rebalance before the drift becomes lost throughput — on-prem, live in 6 to 12 weeks.
iFactory AI Line Balance
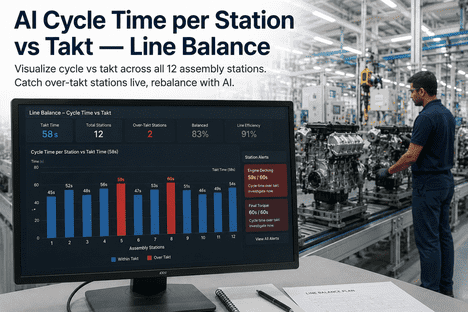
Cycle Time per Station vs Takt, Live
Visualize cycle time against a 58-second takt across all 12 assembly stations, catch over-takt stations the moment they drift, and rebalance with AI — running on a single on-prem server.
60s
Engine Decking, over takt
6-12wk
to go-live, on-prem
Takt Is What You Need. Cycle Is What You Get.
Takt time is the pace customer demand sets — one finished unit every 58 seconds. Cycle time is what each station actually takes. The whole job of line balancing is keeping every station's cycle at or under takt, because the moment one creeps past, that station becomes the bottleneck and sets the speed of everything behind it.
Takt Time
Available production time divided by demand — the drumbeat the line must hold. Here, a unit every 58 seconds.
Cycle Time
The real time a station needs to finish its work. Balanced lines keep this at or just below takt at every station.
The Bottleneck
The single longest-cycle station. It alone determines actual throughput, no matter how fast the others run.
Line Balance
Distributing work so cycle times sit close to takt across all stations — world-class auto lines reach 92 to 95%.
One Slow Station Drags the Whole Line
The cost of imbalance is brutally simple. Picture twelve stations at a 58-second takt, eleven of them comfortably under — and Engine Decking at 60. The line now runs at 60, not 58. Every other station finishes early and waits, accumulating idle time you are paying for in labor and floor space while building fewer cars than demand requires.
60s
Sets the pace
When Engine Decking runs 60s against a 58s takt, the whole line produces at 60s — two seconds lost on every single unit.
11
Stations wait
Every other station finishes early and sits idle, burning paid labor and floor space while the bottleneck catches up.
Hidden
No stoppage
Nothing alarms because the line never stops — the lost units simply never get built, invisible to the floor.
Cars
Never built
Across a shift, those seconds compound into units of demand you committed to but did not produce.
See All 12 Stations Against Takt at a Glance
iFactory turns the whole line into one live picture: every station's cycle time plotted against the 58-second takt line, updating continuously. Stations under takt read normal; any station that crosses the line is highlighted in red the instant it does. Engine Decking at 59s gets a warning; at 60s, a clear over-takt alert — no waiting for an end-of-shift report.
Live Cycle vs Takt
Each station's real cycle time shown against the 58s takt line, refreshed continuously instead of sampled by hand.
Red Over-Takt Highlight
Any station crossing takt turns red on the board the moment it does, so the bottleneck is impossible to miss.
Station-Level Alerts
Engine Decking at 59s raises a warning; 60s fires a clear alert — graduated signals before drift becomes loss.
Micro-Stoppage Capture
Short halts of five to thirty seconds that paper studies miss are logged precisely, revealing hidden drag.
Want to see your own stations plotted against takt in real time? Book a demo and we'll put a live line balance board in front of you.
From Over-Takt Alert to AI Rebalance
Catching the bottleneck is half the win — the other half is fixing it. iFactory closes the loop: detect the over-takt station, analyze why its cycle ran long, suggest how to redistribute work, and confirm the line came back under takt. A creeping station gets corrected instead of quietly bleeding throughput.
1
Detect Over-Takt
Continuous measurement flags the station crossing takt the moment it happens — Engine Decking at 60s.
2
Diagnose the Cause
Variance analysis shows whether the delay is material, manpower, or station overload, not just that it's slow.
3
Suggest Rebalance
AI proposes redistributing work elements toward under-takt stations to bring the bottleneck back in line.
4
Confirm Under Takt
Live readings verify every station is back at or below 58s — throughput restored to demand.
Why AI Beats the Stopwatch
The old way is a clipboard and a stopwatch, run occasionally because it is expensive in engineer hours. It produces a snapshot, not a signal — by the time the study is done, the line has moved on. AI watches every station, every cycle, all the time, turning line balance from a periodic project into a live control.
Manual time study
A Snapshot, Too Late
Around 48 hours of effort for 15 minutes of data
Run occasionally, so drift goes unseen between studies
Misses micro-stoppages and short variances entirely
Bottleneck found long after it cost you units
iFactory AI line balance
A Live Signal
Continuous, 24/7 station-level cycle measurement
Over-takt drift flagged the moment it appears
Micro-stoppages and variance logged precisely
Rebalance acted on while it still saves the units
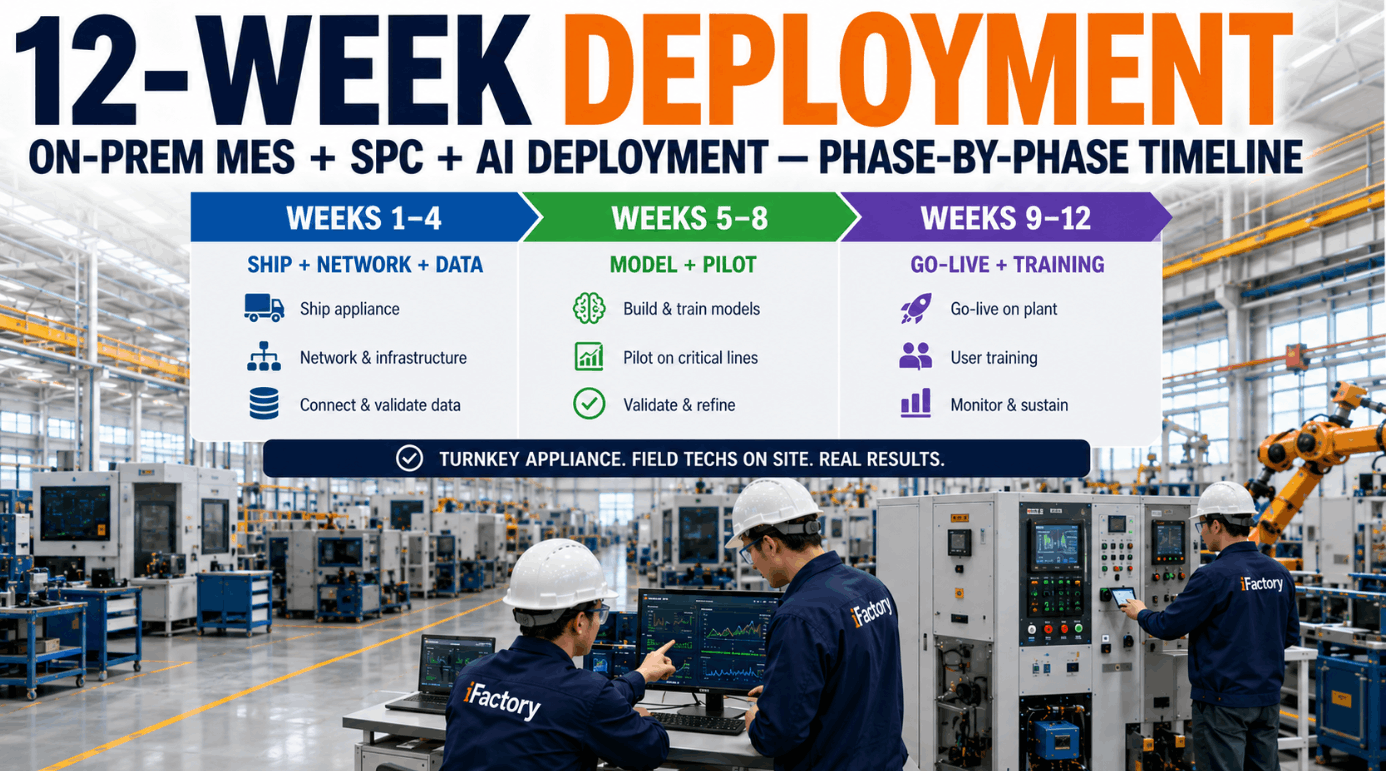
On-Prem AI, Live in 6 to 12 Weeks
Line data and station performance are core operational IP. The iFactory AI runs on a pre-configured edge server on-premise, with all processing inside your firewall and no external egress required to operate. It ships racked and ready with the software pre-loaded — and a structured deployment puts it live on your line in a single quarter, not a multi-year program.
1
Rack the edge server
A pre-configured edge AI server slots into your plant, shipped pre-validated with the line-balance software pre-loaded.
2
Connect station data
Read-only links to station and line data let the AI learn each station's real cycle baseline against takt.
3
Board goes live
The live cycle-vs-takt board runs on-prem inside your firewall — your line data never leaves the building.
What Live Line Balance Delivers
Watching cycle against takt continuously converts directly into higher throughput, less idle waste, and a bottleneck you fix while it still matters. These reflect outcomes manufacturers report after moving from manual studies to continuous, station-level cycle monitoring.
5%+
UPH improvement
units-per-hour gains within weeks of continuous measurement
Live
Bottleneck found
over-takt stations surfaced the moment they drift, not later
Less
Idle waste
balanced stations stop waiting on a creeping bottleneck
92-95%
Balance target
the world-class line-balance efficiency band, kept in view
Curious where your line is losing units right now? Talk to our line team and benchmark your stations against live AI balance.
Frequently Asked Questions
What's the difference between cycle time and takt time?
Takt time is what you need — available production time divided by customer demand, here a unit every 58 seconds. Cycle time is what each station actually achieves. A balanced line keeps every station's cycle at or below takt. When one station's cycle exceeds takt, it becomes the bottleneck and sets the throughput of the entire line, regardless of how fast the others run.
How does one station at 60 seconds slow a 58-second line?
The slowest station governs the whole line. With eleven stations under a 58s takt and Engine Decking at 60s, the line produces at 60s — two seconds lost on every unit. The other eleven stations finish early and wait, accumulating idle time you pay for in labor and floor space. Nothing stops, so the lost units are invisible; they simply never get built.
What does the red over-takt highlight actually show?
All twelve stations are plotted live against the 58s takt line. Stations under takt read normal; any station that crosses takt is highlighted in red the moment it does. Graduated alerts give you warning before loss — Engine Decking at 59s raises a warning, and 60s fires a clear over-takt alert, so you act on drift instead of discovering it in an end-of-shift report.
Why not just run a time study?
Manual time studies are expensive in engineer hours — roughly 48 hours of effort can yield as little as 15 minutes of usable data — and they produce a snapshot run only occasionally, so drift between studies goes unseen. They also miss micro-stoppages of five to thirty seconds. AI measures every station continuously, flags over-takt drift the moment it appears, and lets you rebalance while it still saves the units.
Does our line data leave the plant, and how long to deploy?
No data leaves. The AI runs on a pre-configured edge server on-premise with all processing inside your firewall and no external egress, and the integration is read-only. The server ships racked and ready with software pre-loaded, and a structured deployment puts the live board on your line in 6 to 12 weeks. The fastest way to see fit is a demo on your own stations — book one and bring your takt and station list.
Find the Slow Station Before It Costs You Cars.
See Cycle vs Takt Across Your Line
Bring your takt and station list. We'll show all 12 stations plotted live against takt, the red over-takt highlight catching Engine Decking the moment it crosses, and the AI rebalance that brings it back under 58s — all on an on-prem server, live in 6 to 12 weeks.