Injection Molding SPC — Cavity Pressure, Cycle Time, Mold Temp Live

By Henry Green on June 9, 2026

injection-molding-spc-—-cavity-pressure,-cycle-time,-mold-temp-live

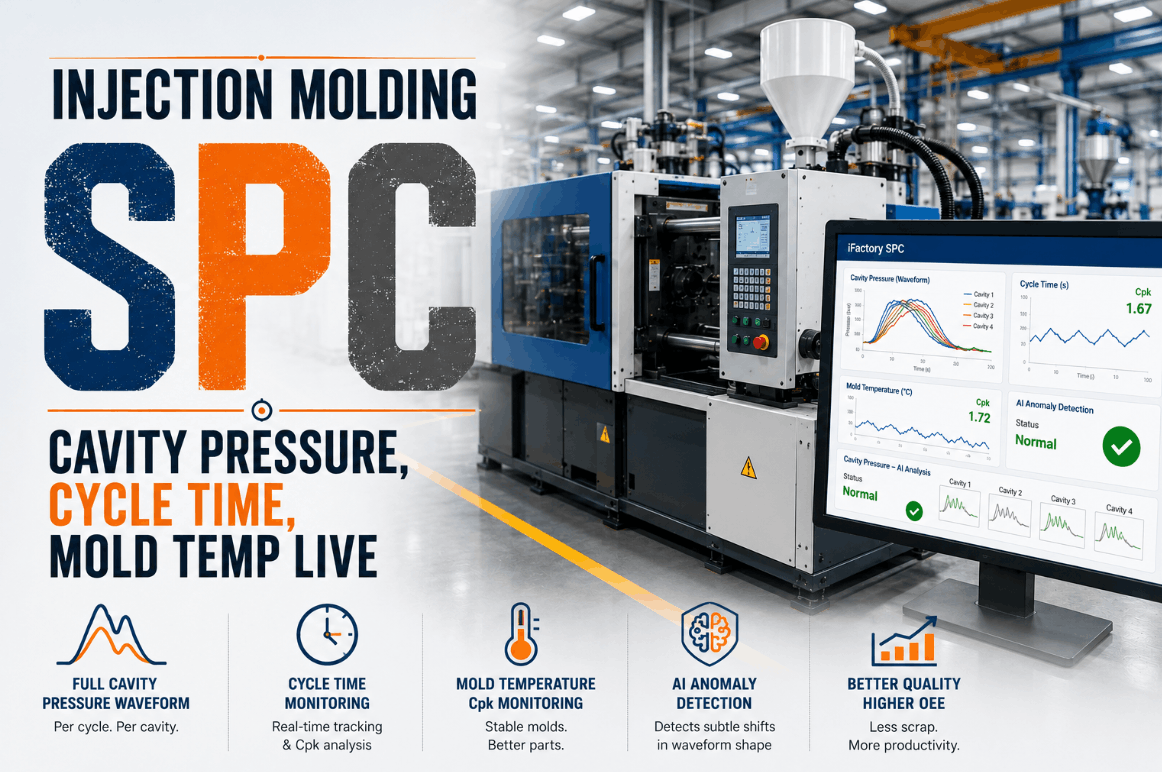
Every injection molding machine generates a full cavity-pressure waveform per cycle — a signature of everything that happened inside the mold during fill, pack, and hold — yet most quality teams still monitor molding quality through a single peak-pressure value recorded in a spreadsheet, comparing it against a static specification limit that reveals nothing about waveform shape, curve area, or the subtle process drifts that precede dimensional non-conformance by hundreds of cycles. The result is predictable: cavity imbalance goes undetected until parts fail at assembly, short-shot conditions are flagged by cold inspection after 200+ bad parts have already been produced, and mold temperature drift across a shift change causes Cpk to erode from 1.67 to 0.89 before anyone notices — costing molding facilities tens of thousands of dollars in scrap, sortation labor, and emergency mold maintenance per incident. iFactory changes this entirely by capturing the full cavity-pressure waveform per cycle, per cavity, along with mold temperature trends, cycle time stamps, and injection velocity profiles — training ML models on your plant's historical molding data to detect waveform anomalies 50–200 cycles before the parts they produce would fail QC inspection.

See how injection molding facilities capture full cavity-pressure waveforms and run AI anomaly detection per cavity with iFactory — ML models trained on your molding line's historical quality data. Book a Demo

The Hidden Cost of Blind Injection Molding — What Peak-Pressure SPC Misses

Injection molding is a process defined by curves, not single points. The cavity-pressure waveform describes the rate of fill, the timing of switchover from injection to packing, the shape and duration of the pack and hold phases, and the residual cooling profile — each segment of the curve encoding a specific quality attribute of the molded part. A peak-pressure-only SPC system collapses this rich process signature into a single scalar value, discarding the waveform shape information that distinguishes a stable process from one drifting toward defect conditions. In conventional molding facilities, cavity-pressure data, mold temperature trends, cycle time logs, and injection velocity settings are monitored in isolation — if they are monitored at all — with no correlation layer that fuses these signals into a unified quality picture per cavity per cycle.

Full Waveform Data Discarded for Single-Point Monitoring
Peak cavity pressure alone cannot distinguish between a waveform with correct fill slope but low pack plateau and a waveform with fast fill overshoot and correct pack plateau — two entirely different process conditions producing different part quality outcomes, both invisible to peak-value SPC charts.
Cavity Imbalance Undetected Until Post-Production Inspection
Multi-cavity tools produce a distribution of cavity-pressure waveforms that shift relative to each other as mold temperature gradients evolve, gate wear progresses, or venting conditions change. Without per-cavity waveform overlay and anomaly detection, imbalance produces bad parts at full production rate until dimensional inspection catches the deviation.
Mold Temperature and Cycle Time Drift Treated as Isolated Parameters
Mold surface temperature deviations of 5–8 degrees Celsius and cycle time extensions of 2–4 seconds interact to shift cavity-pressure curve shape in ways that single-parameter threshold systems cannot correlate. The quality team sees a Cpk drop but has no visibility into which parameter combination caused the shift.
No Learning Loop From Dimensional and Visual QC Results
Every failed part at the CMM station or visual inspection bench contains precursor data in the cavity-pressure waveforms, mold temperature trends, and cycle time logs from 50–200 cycles before the defect occurred. Without a platform that learns from waveform-to-defect correlations across confirmed QC events, each new defect investigation starts from machine-setting guesswork.
$35K–$120K
Average scrap and sortation cost per quality incident at a mid-size molding facility
200+
Bad parts produced before cold inspection detects a drift in cavity pressure waveform shape
0.78
Average Cpk loss across a shift change when waveform SPC is not in place

How iFactory Captures Full Cavity-Pressure Waveforms for AI-Driven SPC

iFactory connects directly to injection molding machine controllers, cavity-pressure sensors, mold temperature probes, and process monitoring systems — ingesting the complete waveform per cycle, per cavity, along with mold temperature, cycle time, injection velocity, and screw position data into a unified time-series data model with no data loss and no manual CSV transfers. The platform trains ML models on your plant's specific correlation patterns between waveform shape features and dimensional quality outcomes, producing real-time SPC dashboards that detect process drift 50–200 cycles before QC inspection would register a non-conformance.

01
Full Waveform Ingestion From Cavity-Pressure Sensors and Machine Controllers
iFactory ingests complete cavity-pressure waveforms — from injection start through fill, pack, hold, and cooling — from piezoelectric cavity sensors and machine controller data via OPC-UA and analog-input integration. Each cycle produces a full time-series waveform per cavity, time-stamped and tagged with cavity ID, job ID, and material lot.
02
Waveform Feature Extraction and ML-Based Baseline Modelling
Instead of storing only peak pressure, iFactory extracts waveform shape features — fill slope, switchover pressure, pack plateau area, hold decay rate, and area under the full curve — training ML baseline models on your plant's historical waveforms per cavity, per mold, per material. Real-time deviations from the per-cavity baseline trigger SPC alerts calibrated to your specific mold behavior.
03
Multi-Cavity Waveform Overlay and Imbalance Detection
Waveforms from all cavities in a multi-cavity tool are overlaid in real time with per-cavity baseline envelopes. The platform detects when a specific cavity's waveform shape diverges from the cavity population mean — indicating gate wear, vent blockage, or cooling imbalance — and alerts the setup team with the specific cavity requiring attention.
04
Mold Temperature and Cycle Time Correlation to Waveform Drift
Mold surface temperature trends per zone and cycle time variations are fused with waveform data to identify multi-parameter drift patterns — a 6-degree mold temperature rise combined with a 1.5-second cycle time reduction producing a specific waveform shape shift that precedes short-shot conditions. Predictive alerts recommend corrective machine adjustments before defects are produced.
05
Dimensional QC Feedback Loop Into Waveform Training Models
CMM dimensional data and visual QC results are imported alongside cavity-pressure waveforms. The platform learns which waveform shape features correlate with specific dimensional non-conformances — identifying waveform anomaly signatures that precede out-of-tolerance conditions by an average of 150 cycles per confirmed correlation event.
06
Real-Time Quality Dashboard With Per-Cavity Predicted Cpk
iFactory presents per-cavity waveform overlays, predicted Cpk trends based on waveform-derived quality inference, ranked cavity imbalance alerts, and recommended process adjustments on a single screen. Quality leads and setup technicians act on waveform-based predictions rather than waiting for cold-inspection results to confirm a process drift.

Key Injection Molding Defects That Require Full Waveform AI Detection

Injection molding defects originate from distinct phases of the cycle — and each defect category manifests as a specific waveform shape deviation that peak-pressure-only SPC systems cannot distinguish. The following table maps the most common molding defects to their cycle-phase root causes, the waveform signature iFactory detects, and the corrective action the platform recommends.

Defect Type Root Cause in Molding Cycle Waveform Signature Detected by iFactory AI Recommended Corrective Action
Short Shot Insufficient shot volume; premature switchover from injection to pack; gate freeze before cavity is fully filled Waveform shows reduced fill slope in injection phase; switchover pressure below per-cavity baseline; pack plateau truncated or absent Increase shot size; delay V/P switchover by 3–5 mm; verify material feed consistency at barrel throat
Flash Excessive injection pressure during fill; mold clamping force insufficient for cavity pressure during pack phase; worn parting line Waveform shows elevated fill slope; pack plateau pressure exceeds per-cavity baseline by 12%+ with extended hold duration Reduce injection velocity in pack phase; verify clamp tonnage; inspect parting line for wear
Sink Marks / Voids Insufficient pack pressure or hold time; gate freeze before pack phase complete; melt temperature too high causing excessive shrinkage Waveform shows normal fill slope but reduced pack plateau area; hold decay rate steeper than baseline; reduced area under full curve Increase pack pressure by 8–12%; extend hold time by 1–2 seconds; reduce melt temperature in 5-degree increments
Warpage Non-uniform cooling across mold zones; cavity-to-cavity temperature gradient exceeding 8 degrees; ejection temperature too high Waveform shape divergence between cavities in multi-cavity tool; correlation with mold temperature zone deviation; elevated residual waveform area after hold phase Balance mold temperature controller zones; increase cooling time for affected cavities; verify ejector pin timing
Burn Marks Trapped air in cavity during fill; injection velocity too high for venting capacity; material degradation from excessive shear heat Waveform shows injection pressure spike during fill phase exceeding expected slope by 20%+; cycle time compression reducing natural vent time Reduce injection velocity in final 15% of fill; verify vent depth and cleanliness; reduce injection acceleration profile
Flow Lines / Weld Lines Melt temperature too low; injection velocity insufficient; mold surface temperature gradient causing non-uniform flow front Waveform fill slope below baseline with extended fill duration; switchover pressure low despite normal shot size; correlation with mold temperature zone readings Increase melt temperature in 10-degree increments; raise injection velocity; balance mold temperature across flow zones

iFactory's AI waveform detection does not replace your existing QC processes — it augments them by correlating every dimensional non-conformance and visual defect with the cavity-pressure waveform, mold temperature, and cycle time data that preceded it. This is the difference between knowing you produced bad parts and knowing exactly which waveform shape deviation caused them, which cavity produced them, and how to adjust the process to prevent the next cycle. Book a Demo to see how iFactory captures full cavity-pressure waveforms for AI-driven injection molding SPC.

From Waveform Data to Closed-Loop Quality Control: Deployment Roadmap

Closing the loop between cavity-pressure waveforms and part quality outcomes has historically required custom data engineering projects that take 4–8 months. iFactory delivers a structured migration path that moves molding facilities from disconnected waveform data silos to unified, ML-driven quality control in 5 weeks — with measurable Cpk improvements and defect reduction beginning in week 3.

Weeks 1–2
Data Audit and Waveform Model Architecture
Quality assessment of cavity-pressure sensor configuration, machine controller data availability, mold temperature zone mapping, and QC data sources — identifying waveform capture gaps and data alignment requirements
Per-cavity waveform baseline model architecture designed for each mold tool, material type, and job configuration in production
OPC-UA and analog-input integration planning with machine controllers, cavity-pressure sensor systems, and QC data sources
Weeks 3–4
ML Model Pilot and Quality Dashboard Activation
Deploy trained waveform anomaly detection models to highest-volume or highest-scrap mold tools — short-shot prediction, cavity imbalance detection, and sink-mark forecasting
Real-time SPC dashboard delivered to quality lead workstation with per-cavity waveform overlay, predicted Cpk trends, and ranked process drift alerts
First waveform-based predictive quality interventions executed — machine parameter adjustments triggered by ML waveform alerts before defects reach QC inspection
Week 5
Full Production Rollout and Quality Baseline
Expand waveform anomaly detection to all active mold tools, all cavity positions, and all defect categories tracked by QC processes
Automated quality reporting and corrective action tracking integrated with plant CMMS for mold maintenance scheduling and tooling change triggers
Baseline report delivered — Cpk improvement per cavity, defect rate reduction by defect category, and quality team time savings measured from week 3 pilot data
QUALITY ROI IN 3 WEEKS: MEASURABLE RESULTS FROM WEEK 3
Molding facilities completing the 5-week program report an average of 41% reduction in scrap rates and 58% reduction in time-to-root-cause for quality incidents within the first 3 weeks of full production rollout — with per-cavity Cpk improvements of 0.4–0.7 points validated across monitored defect categories by week 3 pilot testing.
41%
Scrap reduction in first 3 weeks
58%
Faster root cause identification
0.4–0.7
Cpk improvement by week 3 pilot

What Injection Molding Quality Leads Say About iFactory Waveform SPC

The following testimonials are from quality lead managers at injection molding facilities currently running iFactory's full waveform SPC platform in the United States.

Before iFactory, we were monitoring cavity pressure the same way we had for 12 years — peak pressure logged once per cycle into a spreadsheet, compared against a fixed spec limit that had not been updated since the tool was qualified. We had no visibility into waveform shape whatsoever. When our Cpk dropped on a five-cavity medical device tool, our best guess took three shifts and 5,000 bad parts to isolate: cavity 3 had a gate wear pattern that shifted its waveform pack plateau. The peak pressure was still within spec. The waveform shape was telling a completely different story. iFactory captured that gate wear signature in the waveform anomaly detection on day 3 of their pilot and flagged cavity 3 before a single bad part reached QC. In our first 8 weeks live, the system identified 14 waveform drift patterns that would have produced scrap events — we intervened on all 14. Our overall scrap rate dropped 38%, and our quality team now investigates waveform shape deviations instead of chasing bad parts.
Quality Engineering Manager
Medical Device Injection Molding, Midwest USA
The most valuable feature of iFactory for our operation is the multi-cavity waveform overlay. We run 16-cavity tools for automotive connector production, and cavity imbalance has been our single largest quality headache — always intermittent, always hard to reproduce, always found by the customer before our QC caught it. With iFactory's per-cavity waveform baselines and real-time anomaly detection, we saw cavity 12 drifting from the population mean three hours before any dimensional issue was measurable. The waveform shape told us it was a cooling imbalance on that cavity specifically. We adjusted the mold temperature controller zone for cavity 12, the waveform corrected within 12 cycles, and the customer never saw a bad part. That is the difference between reactive quality and predictive quality — and it is the reason we are expanding iFactory to all 22 of our molding machines this year.
Quality Lead, Injection Molding Division
Automotive Connector Manufacturing, Southeast USA

Conclusion: Stop Molding Bad Parts by the Thousands — Your Waveform Data Already Predicts Them

Injection molding facilities generate a complete process record with every cycle — a cavity-pressure waveform that encodes every significant event that occurred inside the mold from injection start to ejection. The vast majority of molding operations discard that waveform information, recording only the peak pressure or nothing at all, while scrap accumulates, cavity imbalance goes undetected, and quality teams react to defects that were predictable 200 cycles before they occurred. The gap between world-class molding quality and the industry average is not a sensor availability gap. It is a waveform intelligence gap — the missing analytical layer that connects what the cavity-pressure curve shape is saying to what the dimensional inspection results are confirming.

iFactory closes that waveform intelligence gap in five weeks. Full waveform ingestion per cycle per cavity, ML-based baseline models trained on your plant's specific waveform shapes, multi-cavity imbalance detection, mold temperature and cycle time correlation, and continuous model improvement from every QC confirmed non-conformance — deployed without disrupting production or requiring custom data engineering. Book a Demo to see how iFactory captures full cavity-pressure waveforms for AI-driven injection molding SPC.

Capture Full Cavity-Pressure Waveforms Per Cycle. Deploy AI-Driven SPC in 5 Weeks. Results in Week 3.
iFactory gives injection molding quality leads ML models trained on their own waveform data, real-time per-cavity SPC dashboards, cavity imbalance detection, and predictive quality alerts — fully deployed in 5 weeks, with measurable scrap reduction starting in week 3.
Full Waveform Per Cycle
Per-Cavity ML Baselines
Multi-Cavity Imbalance Detection
Mold Temp & Cycle Time Correlation
41% Avg. Scrap Reduction

Frequently Asked Questions

iFactory integrates natively with piezoelectric cavity-pressure sensors from Kistler, Priamus, and RJG via analog and digital inputs, plus machine controllers from Engel, Arburg, Husky, KraussMaffei, Nissei, and Milacron via OPC-UA and Euromap protocols.
iFactory begins producing meaningful waveform anomaly detection with 1,000–2,000 cycles of historical waveform data per cavity, with accuracy improving significantly as the model accumulates more per-job, per-material waveform samples.
Yes — iFactory's ML architecture includes job-class and mold-tool classifiers that segment training data by job ID, material type, cavity count, and cycle time profile, maintaining separate waveform baselines for each unique production configuration.
No — iFactory augments your existing cavity-pressure monitoring infrastructure by adding per-cavity ML-based waveform anomaly detection, multi-parameter correlation with mold temperature and cycle time, and predictive quality alerts layered on top of the sensor data those systems already provide.
Role-based training modules are delivered during weeks 3–4 of deployment; quality leads and setup technicians achieve platform proficiency in under 90 minutes, with ongoing support and model performance reviews included in the deployment package.

Share This Story, Choose Your Platform!