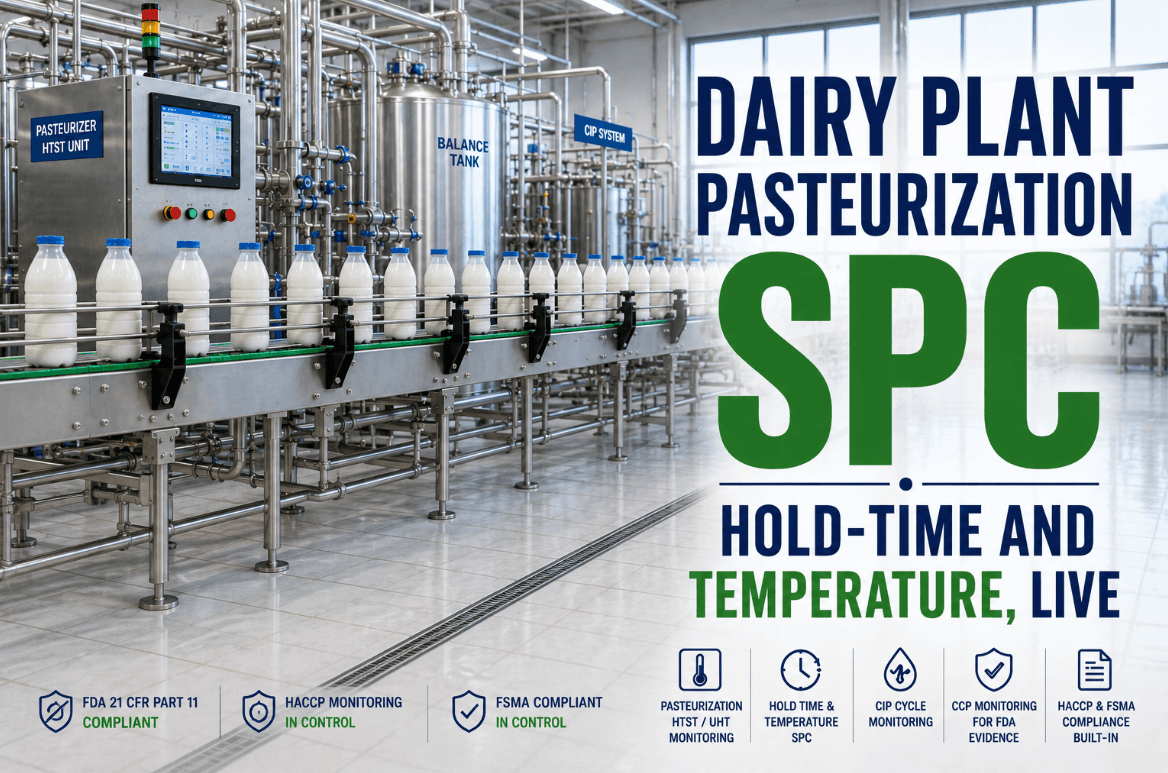
Pasteurization is the most regulated, most audited, and most consequential thermal process in any dairy plant — and its SPC program is only as strong as the data infrastructure supporting it. HTST hold-time deviation, CIP cycle anomaly, and CCP temperature drift are not theoretical failure modes; they are the root causes behind FDA 483 observations and product recall events that reach back to holding tube sensors that were never trended, only logged. Dairy plant managers running disconnected SCADA historians and quarterly manual audits are operating a compliance program that was designed for a different era of regulatory scrutiny. Book a Demo to see how iFactory AI streams HTST, UHT, CIP, and CCP data into validated SPC with FDA-grade evidence from a single dashboard.
Pasteurization Hold Time, CIP Cycles & CCP Monitoring — Validated SPC, Live
iFactory AI connects HTST/UHT sensors, holding tube data, CIP cycle parameters, and CCP records into a single FDA-validated SPC dashboard — so your quality team acts on process signals, not end-of-shift reports.
Why Pasteurization SPC Is an FDA Compliance Imperative, Not a Quality Option
FDA's Grade A Pasteurized Milk Ordinance (PMO) and 21 CFR Part 1240 define pasteurization temperature and holding time as legally mandated Critical Control Points — not quality targets. A single documented hold-time shortfall or temperature drop below the minimum lethal threshold is a regulatory non-conformance that can trigger an FDA 483 observation, a plant shutdown notice, or a Class I recall depending on downstream distribution. Yet the overwhelming majority of U.S. dairy plants manage these parameters with historian trend screens and manual logsheets, neither of which provides the statistical process control framework required to demonstrate validated, sustained process capability to FDA investigators.
iFactory AI's dairy plant connector integrates directly with HTST and UHT system sensors, holding tube temperature transmitters, flow diversion valve (FDV) position signals, and CCP data historians. The platform converts raw process streams into validated X-bar/R charts, Cpk calculations, and Western Electric rule violation alerts — in real time, every shift. Book a Demo to review your current SPC gap against FDA PMO requirements.
| CCP / Parameter | Regulatory Reference | Critical Limit | SPC Control Method | iFactory Alert Trigger |
|---|---|---|---|---|
| HTST Pasteurization Temp | 21 CFR 1240.61 / PMO | ≥161°F (71.7°C) | X-bar/R Chart, Cpk | 1 rule violation — immediate |
| Holding Tube Time | PMO Section 16 | ≥15 seconds | Individual-MR Chart | Sub-limit deviation alert |
| UHT Process Temperature | 21 CFR 113 / PMO | ≥280°F / 2 seconds | X-bar/S Chart | Temperature drop >0.5°F |
| CIP Caustic Concentration | Plant HACCP Plan | Per validated protocol | Individual-MR Chart | Out-of-specification batch |
| Flow Diversion Valve (FDV) | PMO Section 16 | Fail-safe position verified | Event log + SPC correlation | Unplanned diversion event |
| CIP Rinse Conductivity | FSMA / Plant HACCP | ≤residual limit | X-bar/R Chart | Conductivity trend breach |
CIP Cycle Monitoring: The Most Undercontrolled Process in Dairy SPC
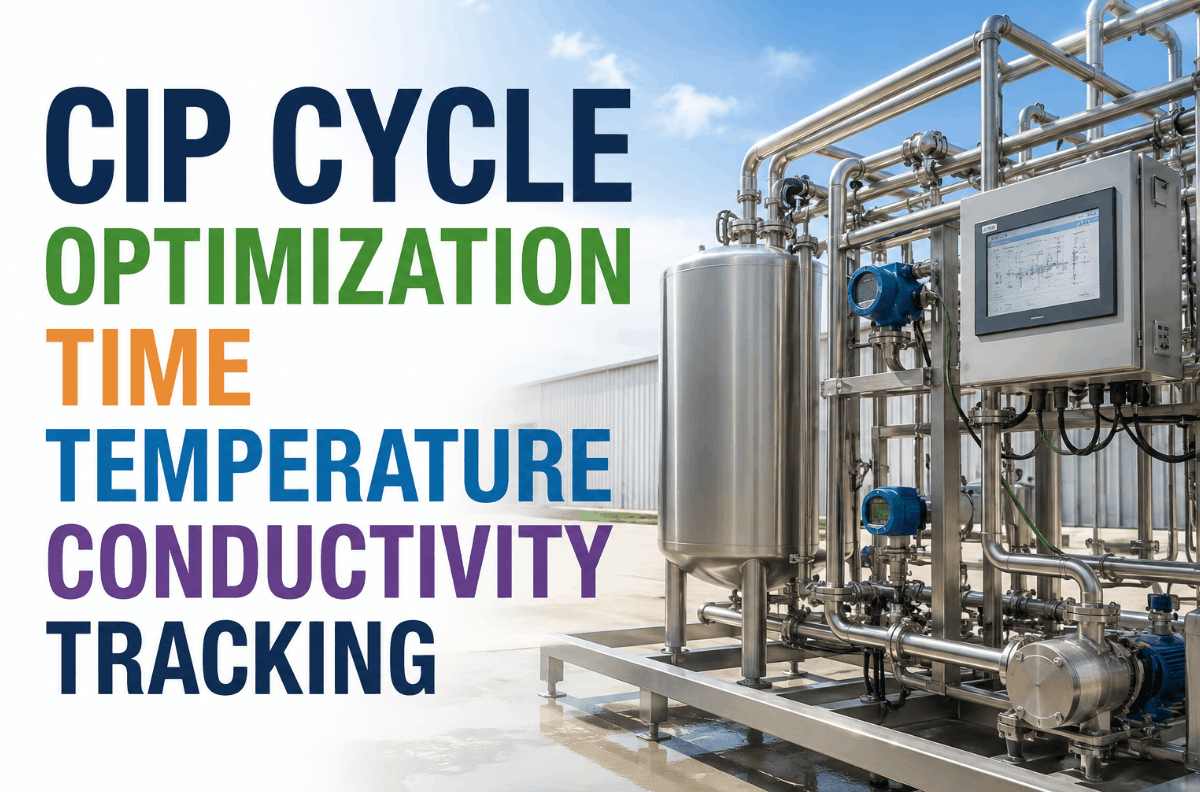
Clean-in-Place (CIP) cycles are the sanitary backbone of every dairy processing line — and the most statistically uncontrolled process in most plants. Temperature, caustic concentration, flow rate, and contact time are all critical parameters under FSMA Preventive Controls and plant HACCP plans, yet the majority of facilities validate CIP at commissioning and then assume it runs to specification indefinitely. Process drift in CIP caustic concentration or rinse cycle duration creates cumulative biofilm risk that does not show up until a micro hold or environmental monitoring exceedance triggers an investigation.
HTST and UHT — Different Processes, Same SPC Discipline Required
High-temperature short-time (HTST) and ultra-high-temperature (UHT) pasteurization operate on different thermal profiles and serve different product categories, but both demand the same continuous, validated SPC infrastructure to satisfy FDA oversight and internal food safety management. The critical distinction for SPC program design is that HTST processes a continuous flow subject to real-time FDV logic, while UHT operates at higher temperatures requiring tighter sensor response windows. Book a Demo to see how iFactory handles both process architectures from a single platform configuration.
FDA-Validated SPC Evidence: What Inspectors Actually Look For
An FDA inspection of a Grade A dairy facility is not a document review — it is an evidence review. Investigators under the PMO and FSMA framework are trained to look beyond the control chart printed on a clipboard and ask for the underlying data: sensor calibration records, control limit derivation documentation, deviation investigation logs, and statistical process capability summaries that demonstrate the process is not merely meeting critical limits but is consistently capable of doing so over time. Most dairy quality programs cannot produce this evidence in real time because the data exists in three or four separate systems that were never designed to communicate.
iFactory streams holding tube outlet temperature and calculated hold time from HTST timing pump speed and tube geometry into live Individual-MR and X-bar/R control charts. Control limits are derived from validated process qualification data, and Western Electric rule violations trigger immediate quality alerts — not end-of-batch exception reports.
- Sub-second sensor polling with 1-minute SPC subgroup calculation cadence
- Automatic FDV diversion event correlation on holding tube temperature drop
- Hold-time Cpk trending across product changeovers and seasonal flow variations
- Shift-based statistical summary with Nelson/Western Electric rule violation log
- FDA PMO Section 16 compliance report generation per batch and per shift
iFactory maps each CCP in the plant's HACCP plan to a specific sensor or calculated parameter. Critical limits, monitoring frequency, and corrective action workflows are configured to mirror the validated HACCP plan — so every CCP monitoring record produced by the platform is audit-ready against the written HACCP documentation without reconciliation.
- HACCP plan CCP registry with one-to-one sensor mapping per critical limit
- Automated corrective action record generation on critical limit exceedance
- CCP monitoring frequency verification — confirms sensor data rate meets plan requirements
- Cross-CCP correlation analysis identifying multi-parameter deviation patterns
- FSMA Preventive Controls verification activity log with electronic sign-off
iFactory calculates short-term (Cpk) and long-term (Ppk) process capability for every monitored CCP parameter on a rolling basis. Capability indices update automatically with each new subgroup, providing a live view of process stability that supports both internal quality reviews and external regulatory evidence submissions.
- Live Cpk/Ppk dashboard per CCP parameter, product, and processing line
- Sigma level trending with control limit recalculation triggers at defined intervals
- Capability study export in AIAG SPC reference format for regulatory submissions
- Product-specific Cpk benchmarking across shifts, lines, and seasonal production periods
- Automatic alert when Cpk falls below 1.33 floor for any FDA-critical parameter
Every SPC record, CCP monitoring log, CIP cycle report, and corrective action entry generated by iFactory is stored as a 21 CFR Part 11-compliant electronic record with audit trail, electronic signature chain, and tamper-evident time stamps. During an FDA inspection, a complete evidence package for any time period can be exported in minutes — not assembled over hours from disconnected systems.
- 21 CFR Part 11 audit trail on all records — creation, modification, and review events logged
- Electronic signature workflow for FSMA verification activities and HACCP review records
- Time-bound evidence export — produces complete SPC package for any date range on demand
- FDA 483 observation response package template with linked supporting data export
- Long-term data archive with cryptographic integrity verification for legal hold scenarios
Disconnected Dairy Quality Systems: The Structural Root Cause of FDA 483 Observations
A fragmented dairy quality program — SCADA historian for pasteurization data, spreadsheet-based CIP logs, a separate LIMS for micro and lab results, and paper HACCP monitoring records — does not fail at the sensor level. It fails at the linkage level. When an FDA investigator asks whether there is a statistically validated relationship between your CIP cycle performance and your finished product micro hold rate, the answer requires data integration that disconnected systems cannot provide. iFactory's unified dairy platform closes every gap in that evidence chain.
HTST & UHT SPC
Real-time X-bar/R and Individual-MR charts for holding tube temperature, hold time, and FDV events. Cpk calculated live against FDA critical limits.
CIP Cycle SPC
Phase-segmented SPC on caustic concentration, temperature, flow rate, and rinse conductivity. Deviation-triggered production hold integration.
HACCP CCP Monitoring
HACCP plan-mapped CCP monitoring with corrective action workflows, verification logs, and FSMA Preventive Controls documentation — all linked to sensor data.
FDA Evidence Records
21 CFR Part 11 electronic records with audit trail, e-signature, and on-demand export for FDA inspections, 483 responses, and internal audit programs.
Dairy SPC Is Not a Software Purchase — It Is a Regulatory Evidence Strategy
FDA investigators auditing Grade A dairy facilities under the PMO and FSMA framework are not looking for a chart on a wall. They are looking for a validated, continuous, statistically defensible record of process capability across every CCP in the HACCP plan — and they expect that record to cover HTST hold time, CIP cycle performance, and CCP temperature control as an integrated body of evidence, not as three separate filing systems. The facilities that receive 483 observations in dairy are not the ones with bad processes. They are the ones with good processes and inadequate documentation infrastructure.
iFactory AI's dairy plant connector addresses the documentation gap directly: real-time SPC on HTST and UHT pasteurization parameters, phase-segmented CIP cycle monitoring, HACCP-mapped CCP tracking, and 21 CFR Part 11 electronic records — all in one platform, all inspection-ready, all the time.
Replace Disconnected SCADA Logs with One FDA-Ready SPC Platform
iFactory connects HTST/UHT sensors, CIP cycle data, CCP monitoring records, and 21 CFR Part 11 electronic logs into a single dairy SPC dashboard — validated, real-time, and inspector-ready on demand.
Dairy Pasteurization SPC — Frequently Asked Questions
Build a Validated, FDA-Ready Dairy SPC Program with iFactory AI
iFactory connects every critical data stream in your dairy plant — pasteurization temperature, holding tube time, CIP cycles, and CCP records — into a single real-time SPC dashboard that survives any FDA inspection.