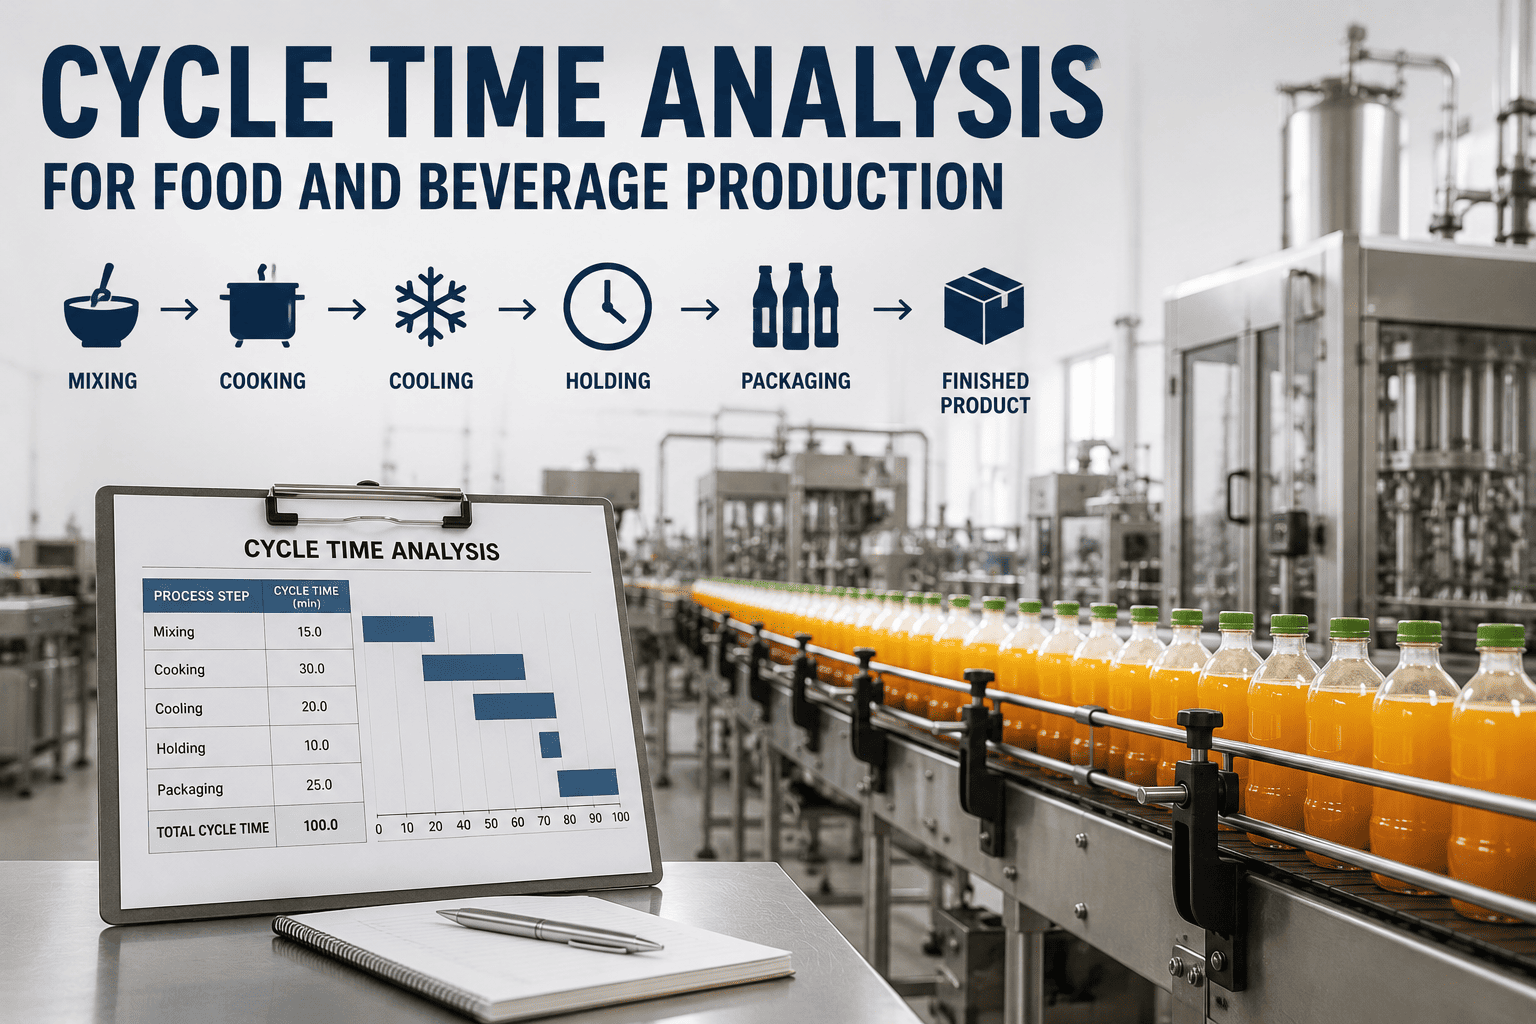
Walk any food or beverage plant and ask how long it takes to make a product, and you will hear the processing time — the cook, the fill, the seal, measured in minutes. Map the whole journey from raw material receipt to the truck leaving the dock, and the answer is days. The difference is not work; it is waiting. Lean practitioners measure this with process cycle efficiency — value-added time divided by total lead time — and the numbers are brutal: most processes run at 5 to 10%, meaning 90 to 95% of the calendar a product is alive, it is adding no value. It sits as raw material aging in a warehouse, waits in WIP between the cooker and the filler, holds in quarantine for a micro or QA release, queues as pallets before dispatch, and stalls every time a handwritten batch record has to be re-keyed into a spreadsheet before the next step can start. None of that shows up on a production dashboard, because the dashboard tracks the machines, not the gaps between them. Value stream mapping exists to make those gaps visible — to lay the entire flow on a single time-ladder that separates touch time from wait time so you can finally see where the days go. iFactory builds that map from live plant data instead of a one-day Gemba walk, and keeps it current so the delays you fix stay fixed.
End-to-End Cycle Time Mapping · Food & Beverage
Days Disappear Between the Steps, Not Inside Them
Receiving, QA hold, WIP queues, and dispatch swallow most of your lead time while your dashboard only watches the machines. iFactory maps the full value stream from live data and exposes the wait time hiding between every step.
5-10%
Typical process cycle efficiency
90%+
Of lead time adds no value
15-25%
Lead-time cut with real-time MES
8
Wastes a value stream map exposes
Sources: Toyota Production System / VSM methodology · McKinsey MES lead-time research · Lean Six Sigma PCE benchmarks · Plant Engineering F&B lean studies · iFactory Deployment Data 2026
The Value Stream Time-Ladder
This is the single picture that reframes the whole conversation. A value stream map lays every step in sequence and draws a time-ladder underneath: the top of the step is value-added touch time, the gap before it is wait time. In a food plant, the touch-time blocks are tiny and the wait-time gaps between them are enormous. Below is a representative sauce or beverage line, dispatch on the right — notice how little of the bar is actually processing.
Raw material aging~24h wait
WIP queue~8h wait
QA / micro hold~36h wait
Dispatch queue~12h wait
Value-added touch time — ~4.5h total
Wait time between steps — ~80h total
The Four Places Days Hide in a Food Plant
Every long food and beverage cycle is the sum of the same four wait pools. None of them are cooking or filling problems — they are flow and information problems, each invisible on a line-level OEE screen and each obvious the moment the whole stream is laid end to end.
Ingredients sit in the warehouse long before the first process touches them. Over-ordering, FIFO discipline gaps, and supplier batching inflate raw-material inventory time that the customer never pays for.
Hides as: warehouse stock, not "production time"
02
WIP & Scheduling Queues
Cooked or mixed product waits hours before filling because of batch scheduling and changeover sequencing. The filler looks like the bottleneck; the real loss is the queue feeding it.
Hides as: a "busy" downstream machine
Finished goods wait for micro results and QA release before they can ship. When records are fragmented, release teams spend their time gathering data rather than deciding, and the hold stretches.
Hides as: "that's just how long QA takes"
04
Dispatch & Information Delay
Pallets queue before the dock, and the whole flow stalls whenever a handwritten batch record is re-keyed into a spreadsheet, or ERP updates the schedule just once a day.
Hides as: paperwork and "the system"
Want to know which of these four pools is eating the most calendar in your plant? Book a 30-minute cycle-time mapping session on a sample of your real flow.
Material Flow Is Half the Map. Information Flow Is the Other Half.
A flowchart shows the sequence of machines. A value stream map adds the layer most plants miss: the information flow that triggers each step. Half of food-plant delay is not material waiting on a machine — it is a step waiting on a signal, a release, or a re-keyed record. Mapping both is what makes the hidden delays visible.
Material Flow
What the product does
Moves through receiving, cook, fill, pack, palletize, ship
Piles up as WIP and finished-goods inventory between steps
Visible on the floor — but the waiting isn't measured
Information Flow
What triggers each step
Orders and schedules sent once a day from ERP
QA release signals that gate dispatch
Batch records re-keyed by hand before the next step starts
A One-Day Gemba Walk vs a Living Map
Classic VSM is a snapshot — a team with clipboards captures one day, draws a current-state map, and it is stale within a week. That is enough to find gross waste once, but not to manage flow continuously. iFactory builds the map from live plant data and keeps it current, so the time-ladder reflects today, not last quarter.
Capability
Manual VSM Walk
iFactory Living Map
Data source
One-day clipboard snapshot
Live timestamps across the whole stream
Wait-time accuracy
Estimated, averaged, optimistic
Measured per step, per batch, per SKU
How current it stays
Stale within a week
Updates continuously as flow changes
Information-flow delay
Hard to quantify by hand
Captures re-keying and release lags
Proving an improvement worked
Re-walk the line, argue the numbers
Before-and-after lead time, trended
From a Three-Day Cycle to Flow
A representative sauce-and-condiment plant believed its cycle time was the few hours of cook and fill its production board showed. Mapping the full stream told a different story: over three days end to end, with QA hold and raw-material aging dwarfing everything that happened on a machine. Attacking the wait pools — not the processing — is what moved the number.
Before · Machine View
Cycle time believed~Hours (touch time)
Actual end-to-end3+ days
Process cycle efficiencyUnder 10%
Biggest delayUnknown / blamed filler
The board tracked machines; the days lived in the gaps.
After · Stream View
Cycle time seenFull ladder, VA vs wait
Lead-time reduction15-25% year one
Targeted poolsQA hold & raw aging
Biggest delayRanked by measured hours
Same recipe, same machines — days back from the white space.
What Mapping the Whole Stream Returns
15-25%
Lead-time reduction in year one
Ranked
Wait pools by measured hours
Live
Value stream, current not stale
VA vs Wait
Split visible at every step
Frequently Asked Questions
Isn't our cycle time fixed by the cook, fill, and pack times?
Those touch times are largely fixed — and they are a tiny fraction of the end-to-end cycle. In most processes, value-added time is only 5 to 10% of total lead time; the other 90%-plus is raw-material aging, WIP queues, QA hold, dispatch queues, and information delays. That is the time iFactory targets, which is why lead time falls without changing your recipe or your equipment.
Book a demo to see your own value-added ratio mapped.
What is a value stream map and how is it different from a flowchart?
A flowchart shows the sequence of steps — receiving, cooking, filling, packing. A value stream map adds the data that matters: cycle time, changeover, WIP, and crucially a time-ladder beneath the steps that separates value-added touch time from the wait time between them. It also maps information flow — the orders, schedules, and release signals that trigger each step — so you see delays caused by a missing signal, not just a busy machine. That is what makes the hidden days visible.
We already did a VSM workshop. Why do we need this?
A manual VSM walk is a one-day snapshot that is stale within a week — useful to find gross waste once, but not to manage flow. iFactory builds the map from live plant timestamps and keeps it current, measuring wait time per step, per batch, and per SKU rather than estimating it from a clipboard. That turns VSM from a workshop artifact into a living instrument you can use to prove an improvement actually worked.
Ask support how it connects to your systems.
How much lead time can we realistically recover?
Food manufacturers implementing real-time visibility and MES-style monitoring commonly cut production lead times 15 to 25% in the first year, with more available as scheduling and QA flow are addressed. Because the gains come from removing waiting rather than speeding up processing, they don't require capital equipment or recipe changes — the recoverable time is sitting in the white space between your steps right now.
Does this help with QA and micro-hold delays specifically?
Yes — QA and micro hold is one of the largest wait pools in food and beverage, and much of it is not testing time but data-gathering time, when release teams chase records across disconnected systems before they can decide. By mapping the hold as measured hours and surfacing where the release process actually stalls, iFactory shows whether the delay is the test itself or the information flow around it — and the latter is usually where the recoverable days are.
Your Cycle Time Is Longer Than Your Board Says
Map the Whole Stream and See Where the Days Actually Go
Book a 30-minute session with a cycle-time specialist. We'll build a value stream time-ladder for a sample of your real flow, separate touch time from wait time, rank the four wait pools by measured hours, and show how much lead time is recoverable without touching your process.
Time-Ladder
VA vs wait at every step
4 Pools
Ranked by measured hours
Live
From plant data, not a snapshot
Both Flows
Material and information delay