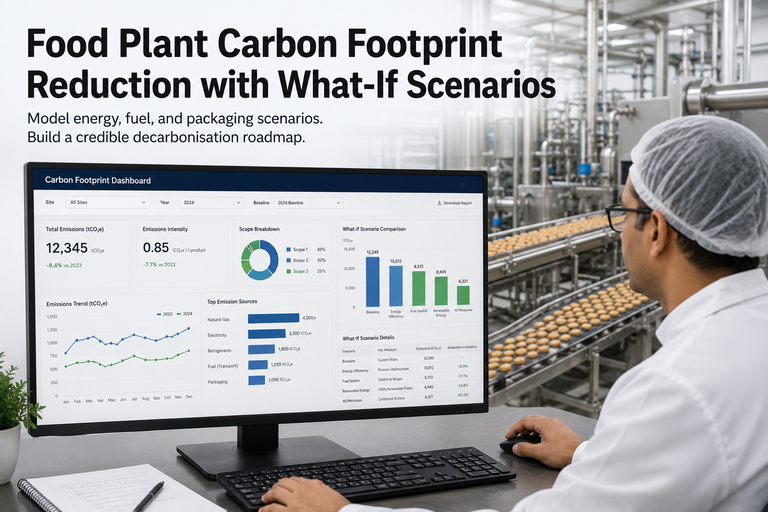
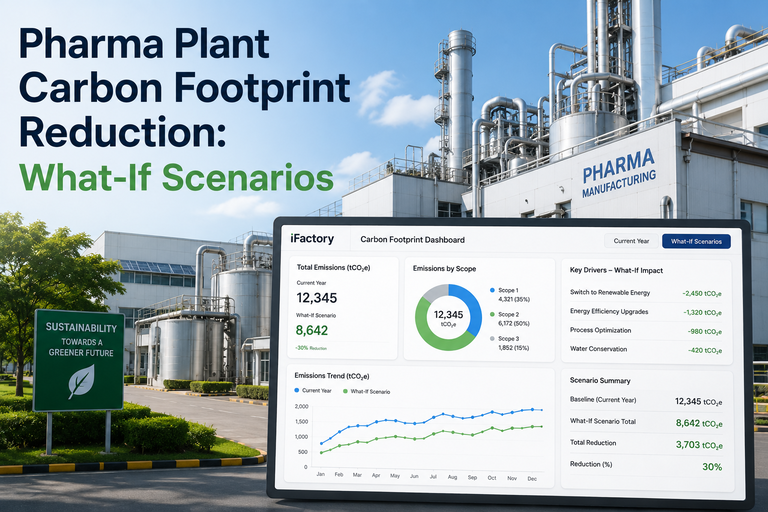
Food Plant Carbon Footprint Reduction with What-If Scenarios
By James C on May 29, 2026
A food manufacturer can run the most efficient plant in its category and still fail its biggest customer's requirements. The reason is scope 3. For food and beverage businesses, the indirect emissions across the value chain — agriculture, ingredients, transport, packaging — can account for up to 95% of the total carbon footprint, and retailers are no longer asking suppliers to report them politely. With California's disclosure law landing in 2026, the EU's CSRD and deforestation rules tightening, and SBTi's Net-Zero V2 demanding 100% coverage of operational emissions, "we'll get to it" is now a commercial risk. The hard part is not the ambition — it is knowing which lever actually moves the number, and at what cost. That is exactly what what-if scenario modeling answers, and a carbon scenario platform turns a vague net-zero pledge into a credible, costed plan.
iFactory Energy & Sustainability
Food Plant Carbon Footprint Reduction with What-If Scenarios
Model energy, fuel, refrigeration, and packaging decisions before you commit capital — and build a scope 3 reduction plan credible enough for your retail customers and SBTi.
For years, scope 3 reporting was voluntary and easy to defer. That window has closed. A wave of disclosure rules and customer mandates has turned supply-chain decarbonisation from an ESG nicety into a condition of doing business — especially for suppliers to large retailers and brands chasing their own science-based targets.
Retailer Mandates
Major grocers are committing to net zero in scope 3 and pushing reduction requirements down to suppliers — your carbon data is now part of the contract.
California & CSRD
Companies over $1B operating in California must disclose scope 1, 2, and eventually 3 from 2026; the EU's CSRD expands mandatory ESG reporting across large operators.
SBTi Net-Zero V2
Requires a target covering 100% of scope 1 emissions and zero-carbon electricity for scope 2 — generic renewable certificates no longer count.
EUDR & Trade Rules
Placing cocoa, coffee, soya, or palm oil on the EU market now requires deforestation compliance — a direct scope 3 supply-chain obligation.
Where the Carbon Actually Sits
You cannot plan a reduction without knowing the shape of the problem. In food and beverage, the footprint is dramatically lopsided toward the value chain — which is why a plant-only energy program, however good, will never satisfy a scope 3 target on its own. This is the breakdown that should anchor every strategy.
Scope 3 — value chain: ingredients, packaging, logistics, waste
The Levers You Can Actually Pull
Decarbonisation is not one decision — it is a portfolio of moves across energy, fuel, refrigeration, and packaging, each with a different cost and a different carbon payoff. These are the levers with the strongest evidence behind them in food and beverage plants.
Energy10-90%
Better-designed fans, pumps, and mixers can cut process energy 50-90%; pump controls and simple operating practices save 10-30%. On-site solar can reach ~30% cost and emission reduction where the resource and regulation allow.
Refrigeration16-27%
Switching from pure to mixed refrigerants cuts refrigeration energy 16.3-27.2%; transcritical CO2 systems replace high-GWP HFCs and address refrigerant-leak emissions that hit scope 1 directly.
Fuel / HeatSite-specific
Electrifying heat removes natural gas where the grid is clean; biomass cogeneration from co-located residues (husk, bagasse) displaces fossil fuel at near-zero feedstock cost. Waste-to-heat converts production waste into process energy.
PackagingEmbedded CO2
Lightweighting, switching from petroleum-based plastics to recyclable or compostable materials, eliminating unnecessary layers, and reuse programs cut embedded scope 3 emissions and waste at once.
Want to see which levers move your number the most, ranked by cost? Book a 30-minute scenario walkthrough and we'll model your plant's options live.
Why What-If Scenarios Beat a Wish List
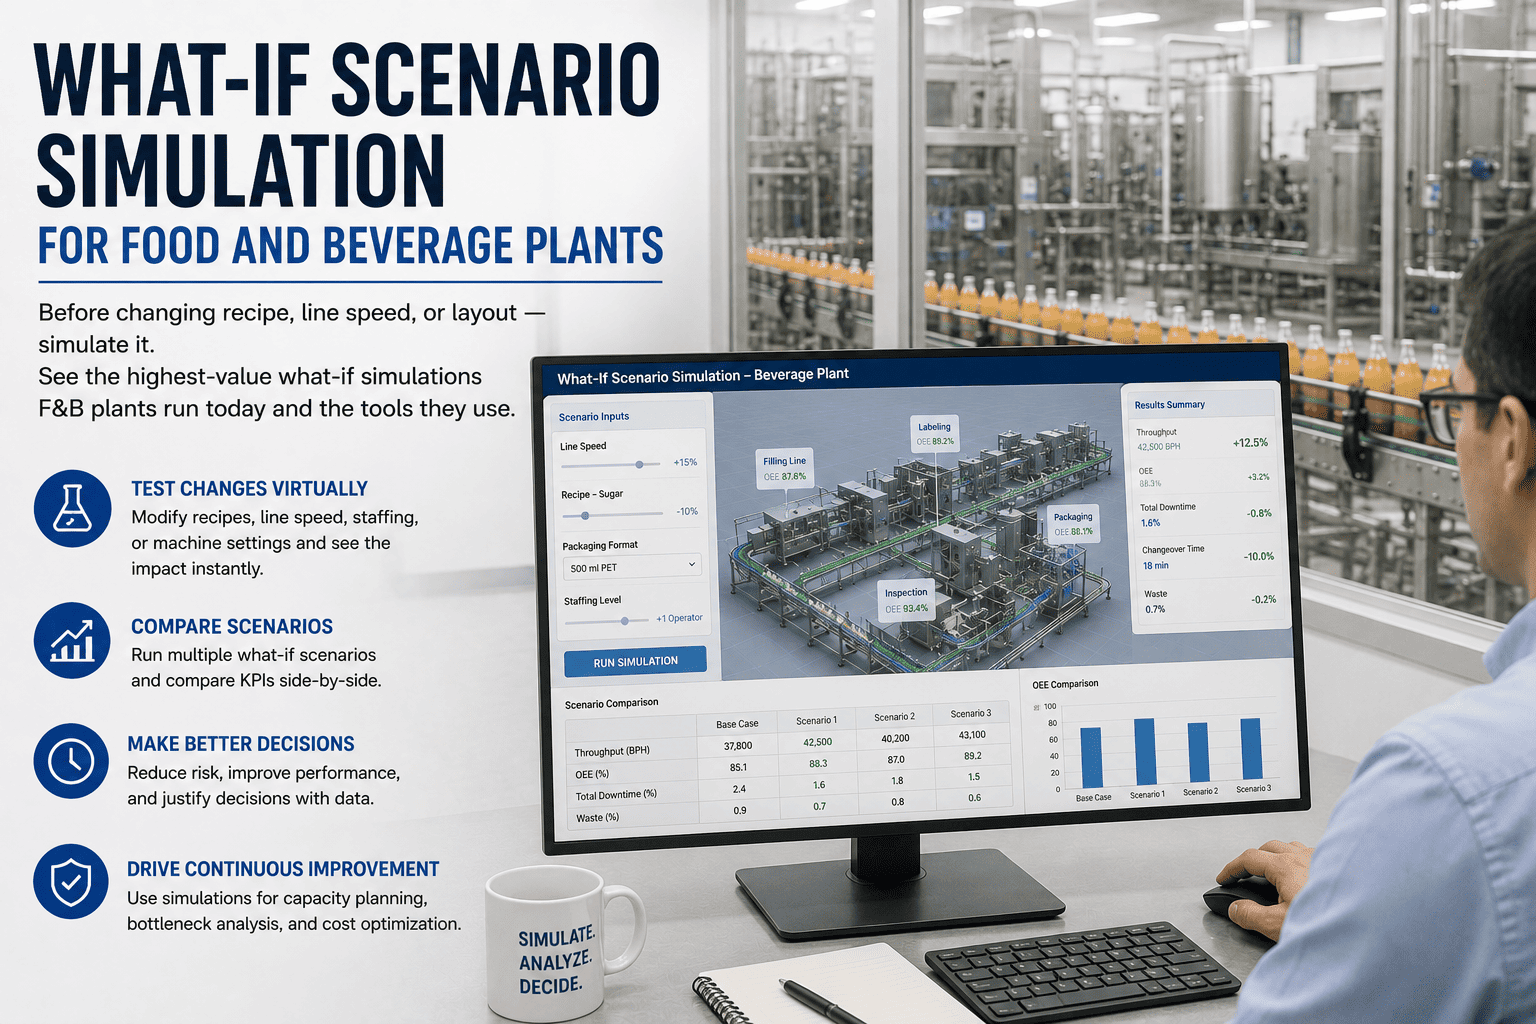
A net-zero pledge without a costed plan is just a press release. The discipline that turns ambition into a defensible roadmap is the marginal abatement cost curve — for each measure, you model how much carbon it removes and what it costs per ton, then rank them. What-if scenarios let you test that ranking against the variables you do not control, like the grid emission factor, before you spend a rupee or a dollar of capital.
Marginal Abatement Cost Curve — Cheapest Carbon First
Bars below the line save money while cutting carbon — do these first. Bars above cost money per ton — sequence them as grid and capital conditions improve.
The Variables a Scenario Has to Test
The reason you model rather than guess is that the answer shifts with conditions you do not fully control. The same electrification project can be a clear win or a marginal one depending on a single input. A good what-if scenario stress-tests the plan against each.
Grid Emission Factor
Electrification only abates as much as the grid is clean. A 25% cleaner grid can drop cold-chain electrification abatement cost by roughly $18/tCO2e — model both today's grid and its trajectory.
Capital & Asset Cycles
Tie capital-heavy measures to replacement cycles. Biomass cogeneration amortised over a 20-25 year asset life carries a far lower cost per ton than a forced early retrofit.
Regulation & Incentives
Local rules can cap solar and wind, halving the savings a technical model predicts. Scenarios must reflect the regulatory ceiling, not just the engineering potential.
Feedstock & Fuel Prices
Co-located residue at near-zero opportunity cost changes the entire economics of on-site heat. Energy price assumptions swing which levers clear the bar.
From Pledge to Costed Plan
What-if scenario planning is a repeatable loop, not a one-off study. The goal is to reach the end of the exercise with a ranked, costed, scenario-tested roadmap you can put in front of a retail customer or an SBTi reviewer with confidence.
The What-If Decarbonisation Loop
1
Baseline
Measure
Build the scope 1, 2, and 3 inventory across energy, fuel, refrigeration, and packaging
2
Model
Run Scenarios
Test each lever's cost and abatement under varying grid, capital, and price assumptions
3
Rank
Build the MACC
Sequence measures cheapest-carbon-first, resilient levers before niche ones
4
Commit
Costed Roadmap
A defensible plan for customers and SBTi, revisited as conditions shift
What Credible Modeling Delivers
Scenario-led decarbonisation is not just compliance theatre — it protects margin, de-risks capital, and keeps you on retailer shelves. These figures come from techno-economic and abatement research across food and beverage manufacturing.
Up to 30%
Energy cost cut
with integrated renewables, saving up to €1.6M in favourable regions
50-90%
Process energy saved
from better fan, pump, and mixer design on some processes
16-27%
Refrigeration energy cut
switching pure to mixed refrigerants
~95%
Of footprint addressable
only once scope 3 is in the plan, not just the plant
Every credible target starts with a baseline and a scenario model, not a pledge. Want your plant's abatement curve built? Talk to our energy engineers.
Frequently Asked Questions
Why can't we just focus on our own plant's energy use?
Because scope 1 and 2 together are typically under 10% of a food and beverage company's footprint — up to 95% sits in scope 3, the value chain of agriculture, ingredients, transport, and packaging. An excellent on-site energy program is necessary but nowhere near sufficient for a scope 3 target. The plan has to reach upstream into sourcing and packaging, which is exactly where retailer mandates focus.
What is a marginal abatement cost curve and why use one?
A MACC ranks every decarbonisation measure by its cost per ton of CO2 removed, weighted by how much it can remove. It tells you the order to act: measures that save money while cutting carbon (efficiency, controls) come first, capital-heavy ones later. It turns a long wish list into a sequenced, costed plan — the format regulators and SBTi reviewers expect.
Is electrifying heat always the greener choice?
Not automatically. Electrification only abates as much as your grid is clean — on a high-carbon grid, the saving can be partial, a structural ceiling that won't lift until the grid decarbonises. That's why scenarios model both the current grid emission factor and its trajectory; a 25% cleaner grid can meaningfully change the economics of cold-chain electrification.
How do what-if scenarios help with capital decisions?
They stop you from stranding capital. By testing each lever against grid, price, and regulatory assumptions before you commit, you avoid forced early retrofits and instead tie capital-heavy measures to natural asset-replacement cycles — which dramatically lowers cost per ton. The scenario shows you what to do now versus what to stage for when conditions improve.
Will renewable energy certificates satisfy our scope 2 target?
Increasingly not. SBTi's Net-Zero V2 raises the bar: scope 2 electricity must come from verifiable zero-carbon sources, and generic renewable certificates no longer count toward a compliant target. That makes real procurement choices — on-site generation, high-quality power purchase agreements — part of the scenario, not an afterthought you paper over with certificates.
Plan the Plan Before You Spend the Capital.
See Your Plant's Abatement Curve — on Your Own Data, in 30 Minutes
Bring your energy, fuel, refrigeration, and packaging data. We'll build your scope 1-2-3 baseline, model the levers under your grid and capital assumptions, and hand you a ranked, costed roadmap credible enough for your retail customers and SBTi review.