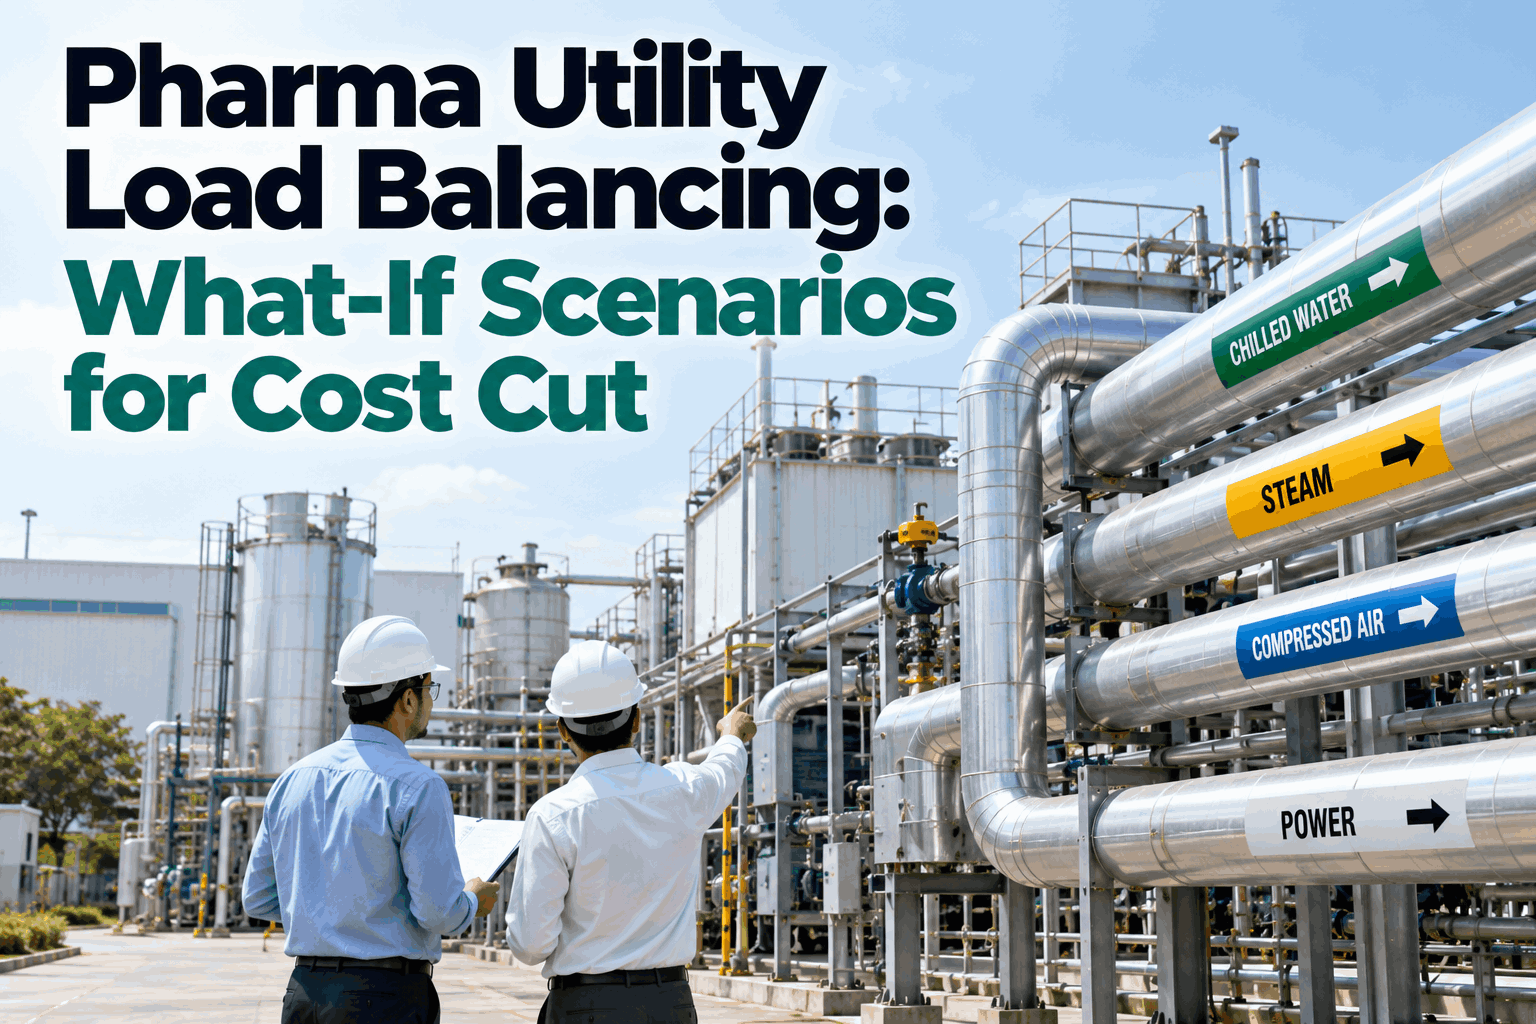
At 2:47 AM on a Tuesday in a sterile suite in Cork, the validated batch is 1,400 litres from target. The HVAC system — drawing 2.3 MW of electrical load — is ramping up fresh-air intake to meet ISO 8 classification, and the steam boiler, fired on natural gas, is dumping 4.8 tonnes of CO₂ per hour to keep the reactor jacket at 65°C. The sustainability director, who needs to file an investor-grade ESG report in six weeks, has no tool to answer the simplest strategic question: "What if we shifted this campaign to off-peak hours and recovered the condenser waste heat?" That blind spot — the inability to run what-if scenarios on the plant's actual carbon footprint — is costing pharma manufacturers measurable emissions, regulatory credibility, and millions in energy spend. This page is about closing that gap.
Stop Guessing Your Pharma Plant's Carbon Footprint — Run What-If Scenarios on Real Production Data
iFactory lets your sustainability and operations teams model energy, fuel, and water scenarios on live plant data — without cloud dependency, without data science teams, and with a pilot live in 6–12 weeks.
Pharma's Carbon Footprint is a Black Box — and ESG Reporting is Now Investor-Grade
Pharma manufacturing is energy- and water-intensive. A typical oral solid dosage plant consumes 2–5 MW of electricity, 15–30 tonnes of steam per hour, and 200–500 GPM of purified water. Scope 1 emissions from natural gas boilers and Scope 2 from grid electricity dominate the footprint. Yet most sites rely on monthly utility bills and annual mass balances to estimate carbon — a lagging, aggregated view that cannot answer strategic "what-if" questions. The result: missed reduction opportunities, regulatory risk under CSRD and SECR, and no defensible data for investor presentations.
You can't model "what if we shift this campaign"
Without sub-hourly energy and production data linked together, you cannot simulate the carbon impact of moving a validated batch from night to day, or switching from natural gas to electric boilers. This leaves decarbonisation plans as guesswork — and auditors notice.
ESG reporting is backward-looking and manual
Spreadsheets, utility invoices, and emailed data from CMMS systems produce a carbon footprint that is weeks or months old. When the board asks "what are our options to hit net zero by 2035?", the only answer is a consulting report — not a live, interactive model.
Scope 3 is invisible at the plant level
Upstream emissions from raw materials and downstream from product distribution are typically calculated using industry averages. You have no way to test how a change in solvent supplier or a shift to reusable packaging affects your total footprint — until it's too late.
Cloud-based tools are blocked by IT and data governance
Pharma's validated environments, GxP constraints, and IP concerns mean most carbon modelling platforms cannot connect to live plant data. The result: analysis is done offline, in silos, with stale data that loses operational relevance.
iFactory: What-If Scenario Modelling on Your Live Plant Data — On-Premise, Zero Cloud
iFactory ingests data from your existing historians, PLCs, and BMS systems — on a secure NVIDIA appliance inside your plant network. In 6–12 weeks, your sustainability and operations teams can model carbon scenarios using real production data, not averages. No data leaves the plant. No IT project delays. No consulting fees for a single-use report.
Connect live data sources
iFactory connects to your OSIsoft PI, AspenTech, Siemens, or Rockwell historian — plus BMS, utility meters, and CMMS — in days, not months.
Define your baseline carbon footprint
Using EPA, GHG Protocol, and ISO 14064 methodologies, iFactory automatically calculates your Scope 1, 2, and 3 baseline from live process data — hourly, not annually.
Build what-if scenarios
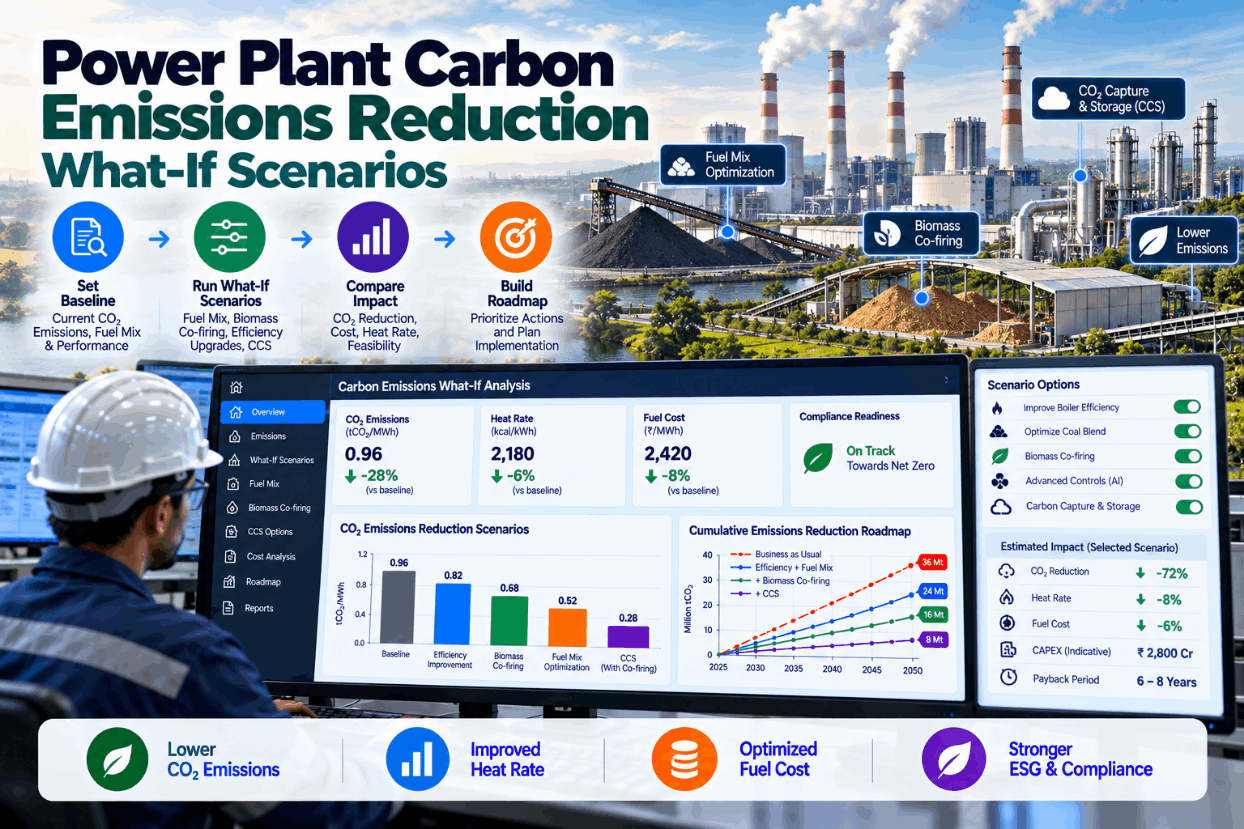
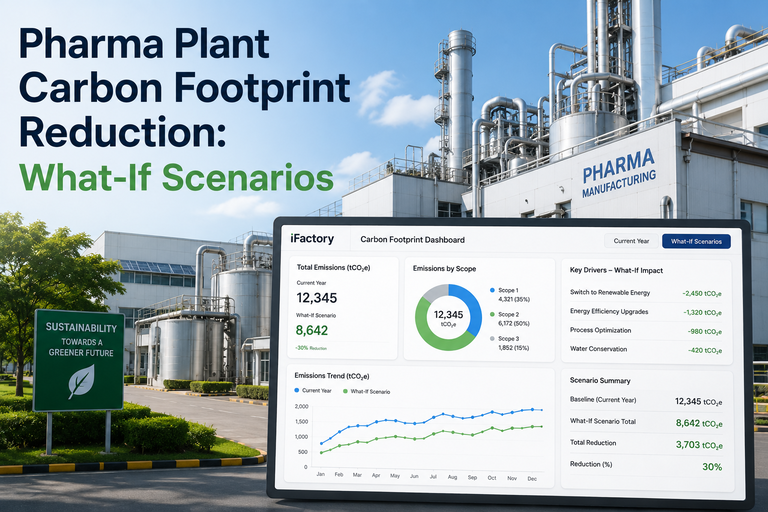
Your team models "what if we install a heat recovery system on the HVAC?" or "what if we switch to green electricity tariffs?" — and sees the CO₂ and cost impact in minutes.
Track, report, and iterate
iFactory generates investor-grade ESG reports, tracks progress against targets, and lets you refine scenarios as production schedules and energy markets change.
See how a major European pharma site identified 18% CO₂ reduction in 8 weeks using iFactory's what-if scenarios. Book a 30-min walkthrough and we'll show you live.
What-If Scenarios That Answer Real Pharma Decarbonisation Questions
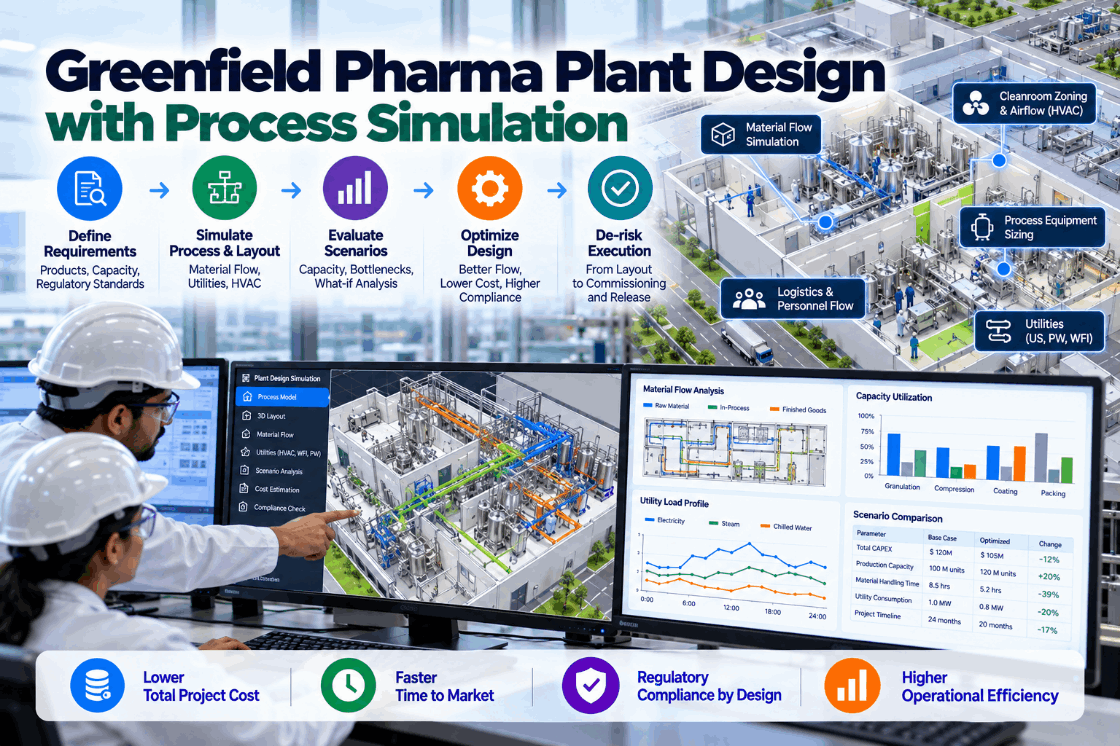
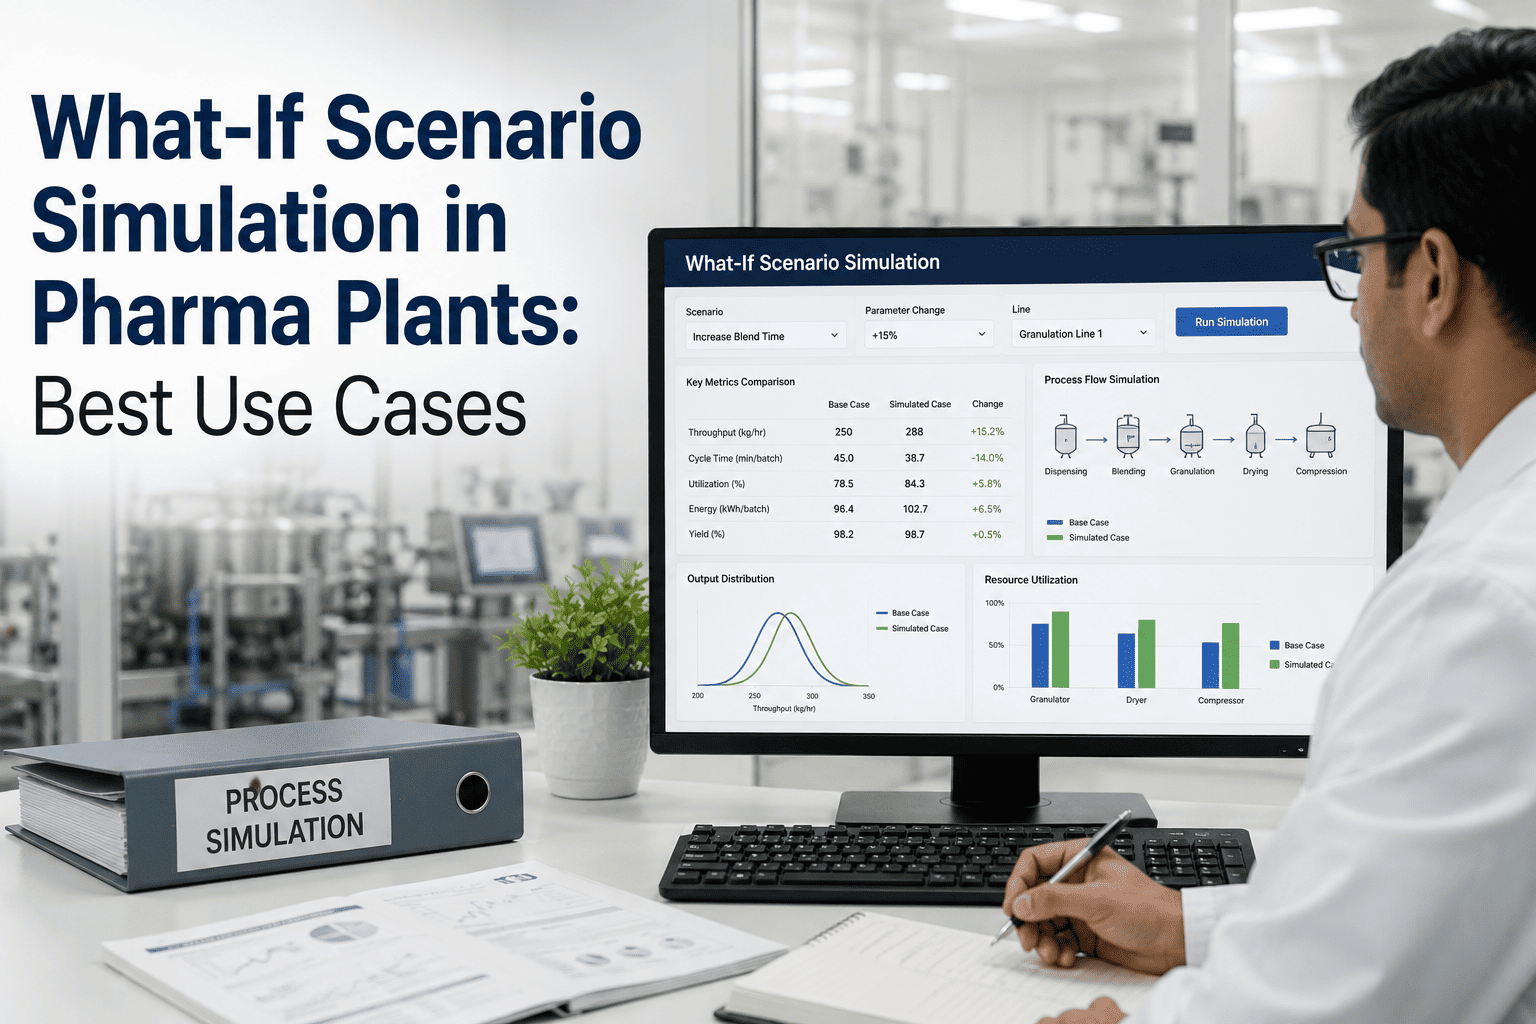
iFactory's scenario engine is purpose-built for pharma manufacturing — it understands batch schedules, cleaning cycles, HVAC classification, and utility interdependencies. Here is what your team can model in a single session.
Fuel switching & heat recovery
Model replacing natural gas boilers with electric or biomass. Simulate heat recovery from reactor exhaust to preheat process water. See the CO₂ reduction per campaign, plus the capital payback period.
Time-of-use & load shifting
What if you moved high-energy HVAC-intensive campaigns to off-peak hours? What if you added battery storage to shave peak demand? iFactory shows the carbon and cost impact per quarter.
Water recovery & reuse
Model the carbon footprint of installing a reverse osmosis reclaim loop on your WFI system. Compare the embodied carbon of single-use vs. reusable water systems across your product portfolio.
Scope 3: raw material sourcing
What if you shifted 30% of your API supply from air-freighted to sea-freighted? What if you sourced solvents from a supplier with a lower carbon intensity? iFactory integrates supplier emissions factors.
Batch scheduling & campaign optimisation
Model the carbon impact of consolidating campaigns to reduce cleaning cycles. Simulate the effect of a faster drying step on steam consumption. See the trade-off between throughput and emissions.
Investor-grade ESG reports
Generate TCFD-aligned, CSRD-compliant reports from your scenario models. iFactory exports data for audit trails and feeds directly into your existing ESG reporting platform.
Without iFactory vs. With iFactory: The Carbon Scenario Gap
The difference between a static annual carbon report and a live, interactive scenario model is the difference between a photograph and a simulation. Here is what changes.
Without iFactory
- Carbon footprint calculated from monthly utility bills — 6–8 weeks old
- What-if scenarios require a 3-month consulting engagement
- Scope 3 is estimated using industry averages, not actual supplier data
- ESG report is a static PDF — no audit trail, no live data link
- Decarbonisation plan is a PowerPoint slide, not a live model
With iFactory
- Carbon footprint calculated hourly from live process and utility data
- What-if scenarios modelled in minutes by your own operations team
- Scope 3 modelled using supplier-specific emissions factors and logistics data
- ESG report generated on demand with full audit trail and data lineage
- Decarbonisation plan is a live scenario model — updated daily
Measurable Results from Pharma Plant Carbon Scenario Modelling
iFactory customers — including a top-20 pharma manufacturer — have used what-if scenarios to identify and validate carbon reduction pathways. These are not projections. These are real outcomes from live plant data.
What You Get with iFactory — Built for Pharma, Deployed in Weeks
iFactory is not a SaaS tool that sits outside your plant. It is an on-premise, turnkey appliance that connects to your existing data infrastructure and delivers a working pilot in 6–12 weeks. Your data stays on your network. Your team owns the models. And we handle the rest.
End-to-end, not a toolkit
We connect to your data sources, build the models, train your team, and hand you a live scenario engine. You do not need data scientists or consultants.
Turnkey pilot in 6–12 weeks
From kick-off to a working pilot that models real carbon scenarios on your live data — in one quarter or less.
On-premise, zero cloud dependency
Runs on an NVIDIA appliance inside your plant network. No data ever leaves your control. No cloud security review. No GxP concern.
Pilot to ROI in one quarter
Our pharma customers typically identify enough carbon reduction potential in the first 8 weeks to justify the full deployment.
24x7 managed service
iFactory monitors the appliance, updates models, and provides support. Your team focuses on running scenarios, not maintaining infrastructure.
Built for pharma validated environments
iFactory runs alongside your existing MES, BMS, and historians without interfering with validated processes. No revalidation required.
Common Questions About Pharma Carbon Footprint Scenario Modelling
Your Pharma Plant's Carbon Footprint is a Strategic Asset — Model It, Don't Guess It
Stop relying on monthly utility bills and annual consulting reports. iFactory puts live what-if scenario modelling in your hands — in 6–12 weeks, on your network, with your data. Book a 30-minute walkthrough and we will show you how a pilot works for your site.