HVAC Energy Optimization in Pharma Plants Without Risking GMP
By James C on June 1, 2026
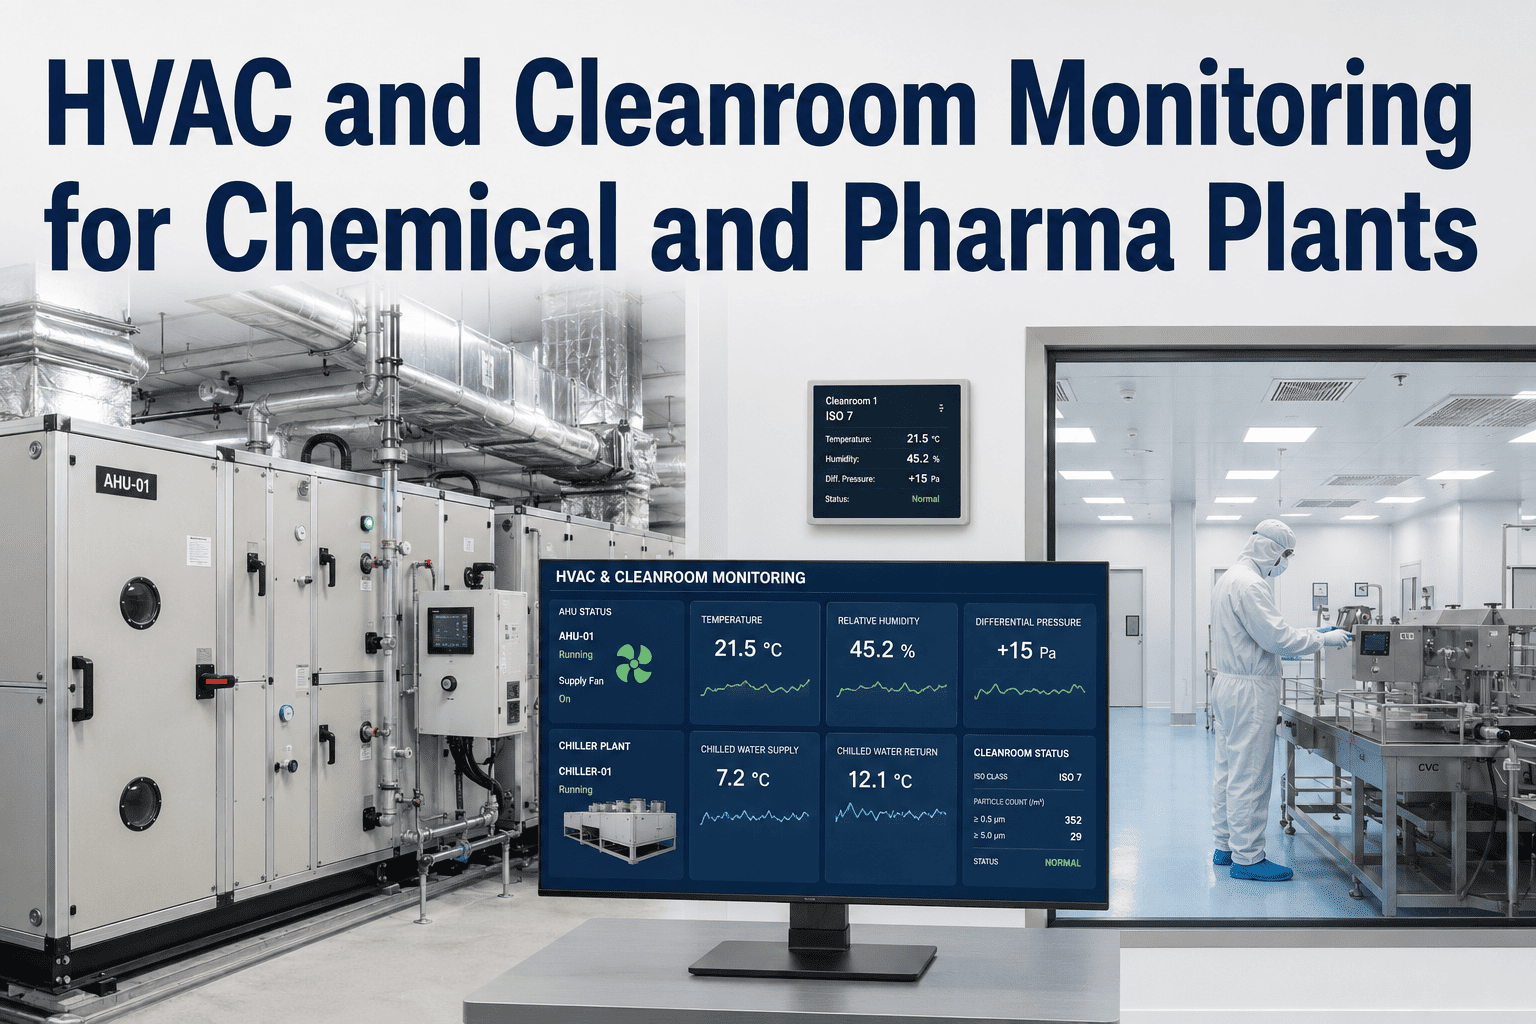
HVAC is the single largest line on a pharma plant's energy bill — not a contributor, the dominant one. Benchmarking studies put cleanroom HVAC at 36% to 67% of total facility energy, and in highly classified suites it can exceed everything else on site combined. The reason is structural: sterile environments demand 20 to 30 air changes per hour, AHUs run 24/7 at peak design load regardless of occupancy, and decades of "more is better" design left most plants pumping far more conditioned air than their GMP classification actually requires. The opportunity is equally structural. A 50% reduction in air change rate during unoccupied periods can cut HVAC energy 25 to 30% — and a validated, risk-based airflow strategy does it without touching cleanroom classification. The catch is that none of this is safe to do blind. You need live visibility into airflow, pressure cascade, particle counts, and energy draw, all at once, with the data trail to prove classification held the entire time. That is exactly what iFactory's energy intelligence layer does on top of your existing BMS and AHUs.
Pharma HVAC Energy Optimization
Cut HVAC Energy Without Breaking Cleanroom Classification
Pharma HVAC burns up to two-thirds of plant energy. iFactory finds the waste — oversized air changes, idle AHUs, drifting chilled water — and proves GMP held the whole time with a live, validated data trail.
Sources: ISPE Pharmaceutical Engineering · ISO 14644-16:2019 · Roche/Genentech ACR Reduction Study · EU GMP Annex 1 · iFactory Deployment Data 2026
Where the Energy Actually Goes
Before you can cut anything you have to see where it is going. In a typical classified pharma facility, HVAC dominates the energy mix — and within HVAC, fan power and air conditioning of supply air are the big two. Lighting and process equipment, the things people instinctively target first, are a rounding error by comparison. This is the breakdown that changes the conversation in the boardroom.
HVAC fan power & air handling~42%
Chilled water & cooling~15%
Humidification & reheat~8%
Process, lighting, other~35%
Representative mix for a classified oral solid dosage / sterile facility. HVAC share rises with cleanroom classification and falls with process intensity.
The Four Levers That Move the Bill
Every credible HVAC saving in a pharma plant comes from one of four levers. None of them require new capital equipment to start — they require knowing, minute by minute, whether the room can tolerate the change. That is the difference between a saving and a deviation.
Lever 01
Air Change Rate Setback
The biggest single lever. Most ISO 8 suites are validated at 20 ACH but only need 10 to hold classification. Dropping to 6 ACH when unoccupied for 30+ minutes — then flushing back before the next shift — is where the 25-30% comes from.
50% ACR cut → 25-30% HVAC energy saved
Lever 02
Setpoint & Reheat Discipline
Raising supply temperature 20°C to 22°C and widening humidity bands within GMP limits cuts cooling, reheat, and humidification load. Small setpoint moves compound into large annual numbers across thousands of operating hours.
Tighter bands = wasted energy you can reclaim
Lever 03
Pressure Cascade & Leakage
Excess differential pressure and leaking ductwork force AHUs to overwork. Holding 5-15 Pa where appropriate — not more — and sealing duct leaks lets fans draw less power for the same result.
Right-sized ΔP stops fans fighting leaks
Lever 04
Heat & Air Recovery
Energy recovery wheels and plate exchangers reclaim conditioning energy from exhaust air. Demand-controlled fresh-air fraction matches makeup air to real contaminant load instead of a worst-case constant.
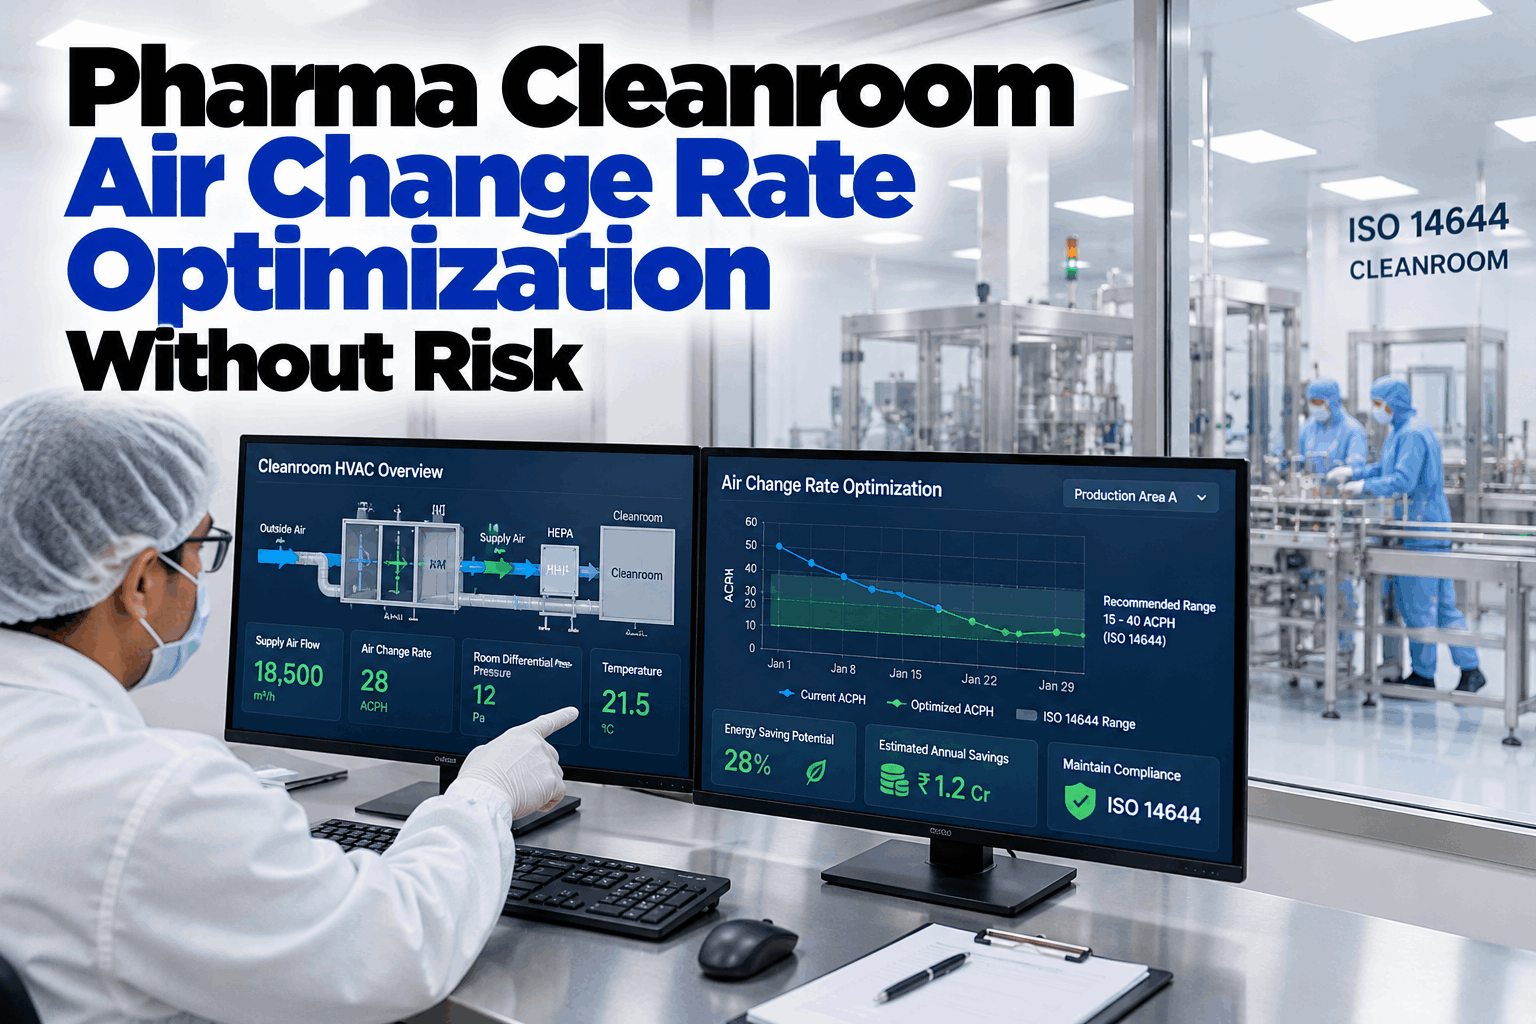
This is the mechanism behind the headline savings. The chart shows a single AHU's air change rate over a 24-hour cycle. During production the room runs full classification. The moment occupancy drops and sensors confirm particle counts are low, the system steps down — then ramps back and flushes the room to spec before the next shift clocks in. Every transition is validated, logged, and reversible.
Air Change Rate · 24-Hour Cycle · ISO 8 Suite
Validated min: 10 ACHSetback: 6 ACH
Shaded bands are occupied production hours at full classification. The valley between them is validated setback — the part of the day that quietly funds the whole program.
Saving vs Deviation — The Line iFactory Watches
The only reason plants don't do this already is fear: cut airflow wrong and you risk a reversed pressure cascade, a classification failure, and a requalification. iFactory removes the fear by watching both sides of the line continuously — the energy you are saving and the GMP parameters you must never breach — and reversing instantly if any margin tightens.
Parameter
Optimizing Blind
With iFactory Energy Intelligence
Particle counts during setback
Checked at next scheduled certification
Live monitored — setback reverses if counts rise
Pressure cascade integrity
Assumed stable, found out at audit
Continuous ΔP watch with auto-fail-safe
Room recovery time
Hoped to be within 15-20 min
Flush triggered early, recovery confirmed before shift
Energy saved
Estimated on a spreadsheet quarterly
Metered live by AHU, room, and shift
Audit evidence
Reconstructed manually under pressure
Timestamped, signed trail proving classification held
From Uncontrolled Bill to Validated Savings
A representative mid-size sterile facility, one AHU bank serving an ISO 8 packaging suite running two shifts. The room sat unoccupied roughly ten hours a night and every weekend — all at full air change rate, because no one could prove it was safe to step down.
Before · Constant Volume
Air change rate20 ACH, 24/7
Unoccupied hours at full load~3,600 hr/yr
HVAC share of suite energy63%
Setback in useNone
Nobody could prove classification would hold, so nobody touched it.
Validated setback
After · Demand-Controlled
Air change rate10 occupied / 6 setback
Classification held100% of monitored time
HVAC energy reduction~28%
Audit prep timeWeeks → hours
Same product, same classification, a quarter less HVAC energy.
Built for the Standards Auditors Actually Cite
An energy program that risks your GMP status is a non-starter. Every iFactory optimization ships inside the framework regulators already expect — the savings are a by-product of doing monitoring properly, not a workaround.
EU GMP Annex 1
Sterile environment monitoring — continuous particle and pressure data, not periodic snapshots
ISO 14644-16
Energy efficiency in cleanrooms — the standard that explicitly sanctions these optimizations
FDA 21 CFR Part 11
Electronic records and signatures on every setback event and recovery confirmation
ISO 14644-1
Cleanroom classification by particle concentration — proven held throughout setback
EU GMP Annex 15
Qualification and validation — change-controlled ACR reduction with documented QPP
Will reducing air change rates put our cleanroom classification at risk?
Not when it is done with live monitoring. Most suites are validated well above the air change rate they actually need to hold classification — studies show ISO 8 rooms running at 20 ACH frequently maintain spec at 10. iFactory only steps airflow down when sensors confirm particle counts and pressure cascade have headroom, and reverses instantly if any margin tightens. The classification is protected by data, not by overspending on airflow. Book a demo to see the fail-safe logic on live data.
How much energy can we realistically save?
The headline lever is air change rate setback during unoccupied periods, which cuts roughly 25-30% of HVAC energy when a 50% ACR reduction is validated. Since HVAC is commonly 36-67% of total facility energy, that flows through to a meaningful cut in the overall plant bill — especially in facilities running two shifts with long unoccupied windows overnight and at weekends.
Do we need to replace our AHUs or BMS to start?
No. iFactory is an intelligence layer that connects to your existing AHUs, dampers, VFDs, and building management system. It reads airflow, pressure, particle, and energy data, surfaces the waste, and orchestrates setback through controls you already have. Capital upgrades like energy recovery wheels can come later — the first wave of savings comes from running what you own correctly. Ask support about your specific control stack.
How do we prove to auditors that classification held during setback?
Every setback event, recovery flush, and the continuous particle and pressure data behind it are timestamped, electronically signed, and stored as an audit trail. Instead of reconstructing evidence under pressure, you hand the auditor a complete record showing the room met its ISO classification throughout every optimized period. This is what turns audit prep from weeks into hours.
What about humidity, reheat, and chilled water — or is this only about airflow?
Airflow is the largest lever but not the only one. iFactory also tracks setpoint discipline, reheat and humidification load, pressure differentials, duct leakage signatures, and chilled water efficiency — correlating them so you can see which one has the most reclaimable energy in your specific plant rather than chasing the wrong fix.
Your AHUs Are Running Full Load on an Empty Room Right Now
See Exactly Where Your HVAC Energy Is Leaking — and How Much Is Safe to Reclaim
Book a 30-minute session with an energy specialist. We will connect to sample data from one suite, map your four levers, model the setback savings, and show you the validated trail that keeps your classification intact the entire time.