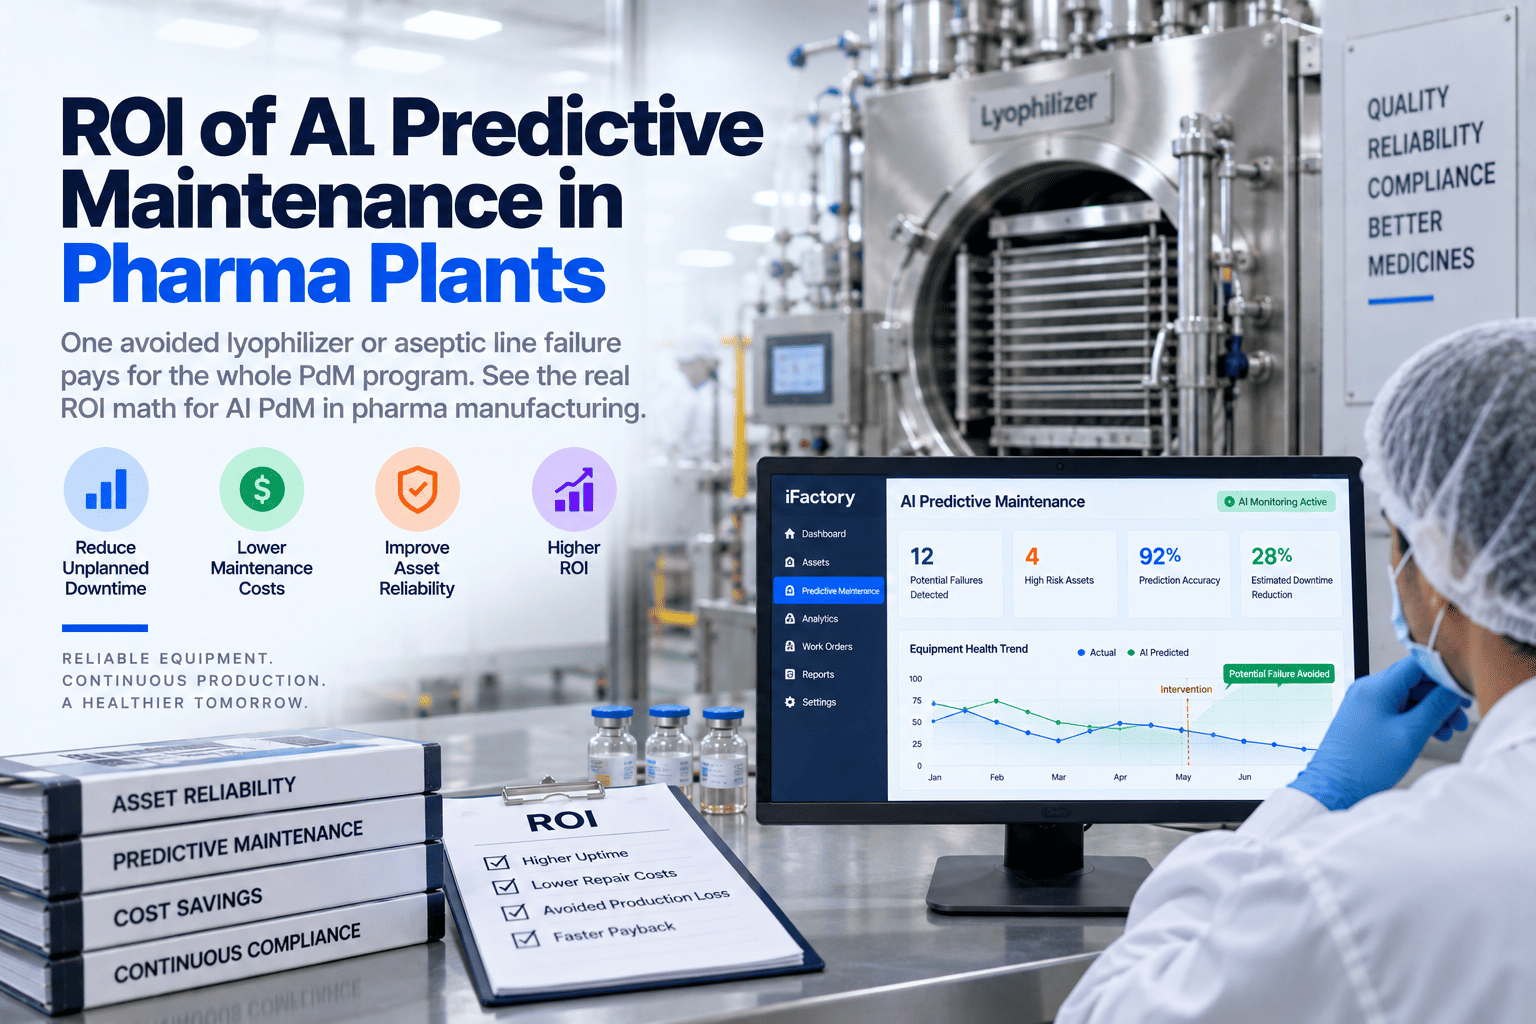
A tablet press running just 2% out of spec rarely announces itself. It does not stop the line. It quietly produces tablets until a QC review catches the drift — and by then it is no longer a maintenance problem, it is a batch failure, a regulatory hold, and an investigation that can shut a line for days. The difference between a plant that catches that drift weeks early and one that discovers it in QC comes down to three things: what sensors are installed, what data they feed, and whether the maintenance team acts on the signal before the failure. That is the whole promise of predictive maintenance — but in a GMP environment, it has to deliver reliability without breaking validation. This guide covers how a pharma predictive maintenance program actually works: the sensors, the models, and the validation steps that make it hold up to an FDA inspection.
iFactory Reliability Intelligence
Predictive Maintenance for Pharma Plants: A Complete Guide
Catch equipment drift weeks before it becomes a deviation — the sensors, AI models, and CSV-ready validation path that make predictive maintenance work inside a regulated GMP plant.
25-30%
Less unplanned downtime
2-4 wk
Failure warning lead time
61%
Fewer 483 equipment observations
3-6 mo
Typical pharma ROI payback
Why Pharma Is Different
Predictive maintenance works on the same physics everywhere — a bearing about to fail sounds the same in a cement plant as in a sterile suite. What makes pharma unique is the consequence of a miss and the constraint on the fix. A failure does not just cost production; it can cause a quality deviation and a regulatory event. And you cannot simply bolt a sensor onto a validated machine and start trusting its output — every sensor that touches a GMP decision becomes part of the validated system. That tension, reliability versus validation, is the entire design problem.
Preventive Only
Fixed Schedule, Blind Between Intervals
Maintenance happens on the calendar, whether the asset needs it or not
Failures that develop between PM intervals go undetected until they break
Over-maintenance wastes labor and creates its own contamination risk
Predictive Layer
Condition-Driven, Always Watching
Sensors track actual condition continuously, not a fixed date
Drift caught 2 to 4 weeks before failure, while the fix is still cheap and scheduled
Intervene only when needed — less downtime and less over-maintenance
The right answer for pharma is not either-or. It is a validated hybrid: preventive maintenance for regulatory compliance obligations, predictive monitoring on top for critical-asset reliability.
What to Sensor, and What It Catches
Predictive maintenance starts with putting the right sensor on the right asset. Pharma's critical equipment each has a characteristic failure signature — and the sensor choice follows the failure mode, not the other way around. Here is where the highest-value monitoring sits.
Tablet Press
Compression force per station, drive & turret vibration, motor temperature, shaft torque
Catches force drift and punch wear with 15 to 30 minutes' lead time — driving rejection rates from ~2.4% toward 0.3%.
Pumps & Mixers
Vibration signature, motor current draw, impeller torque
Detects bearing wear, imbalance, and seal degradation before content uniformity is affected.
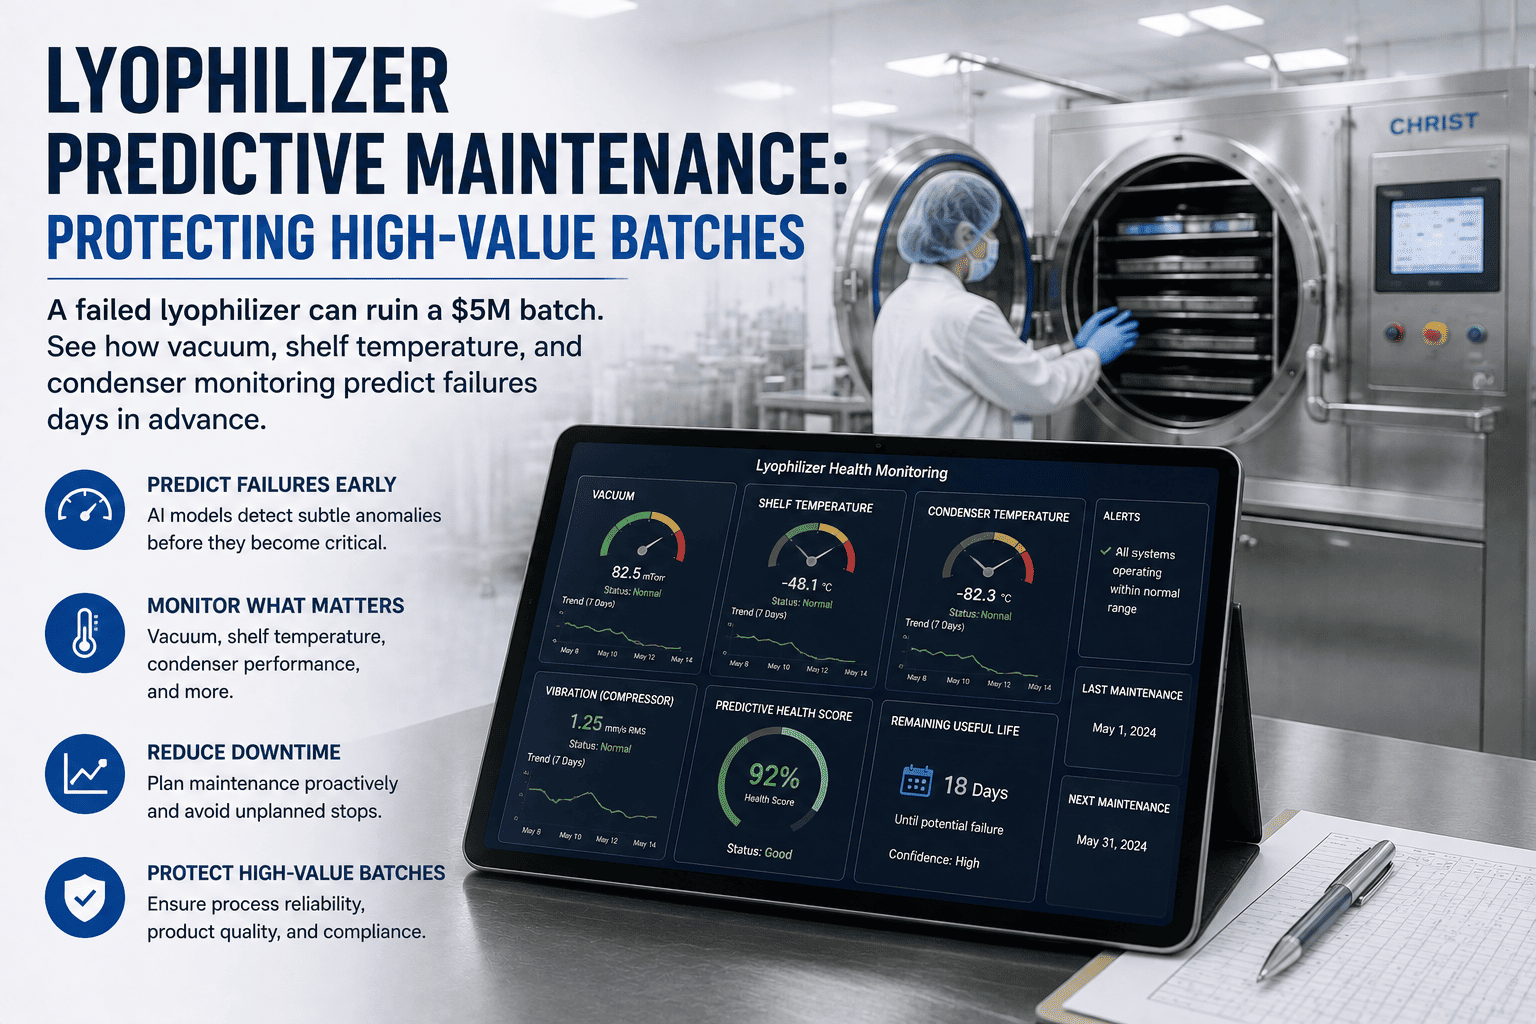
Lyophilizer / Autoclave
Condenser & shelf temperature, vacuum level, compressor condition
Predicts compressor wear and valve failure that can destroy an entire parenteral batch.
Cleanroom HVAC
Vibration on fans/motors, temperature, humidity, pressure
Flags utility-system degradation that threatens the controlled environment and GMP classification.
Want to know which of your assets gives the fastest predictive win? Book a 30-minute reliability walkthrough and we'll map sensors to your critical equipment.
How the Prediction Actually Happens
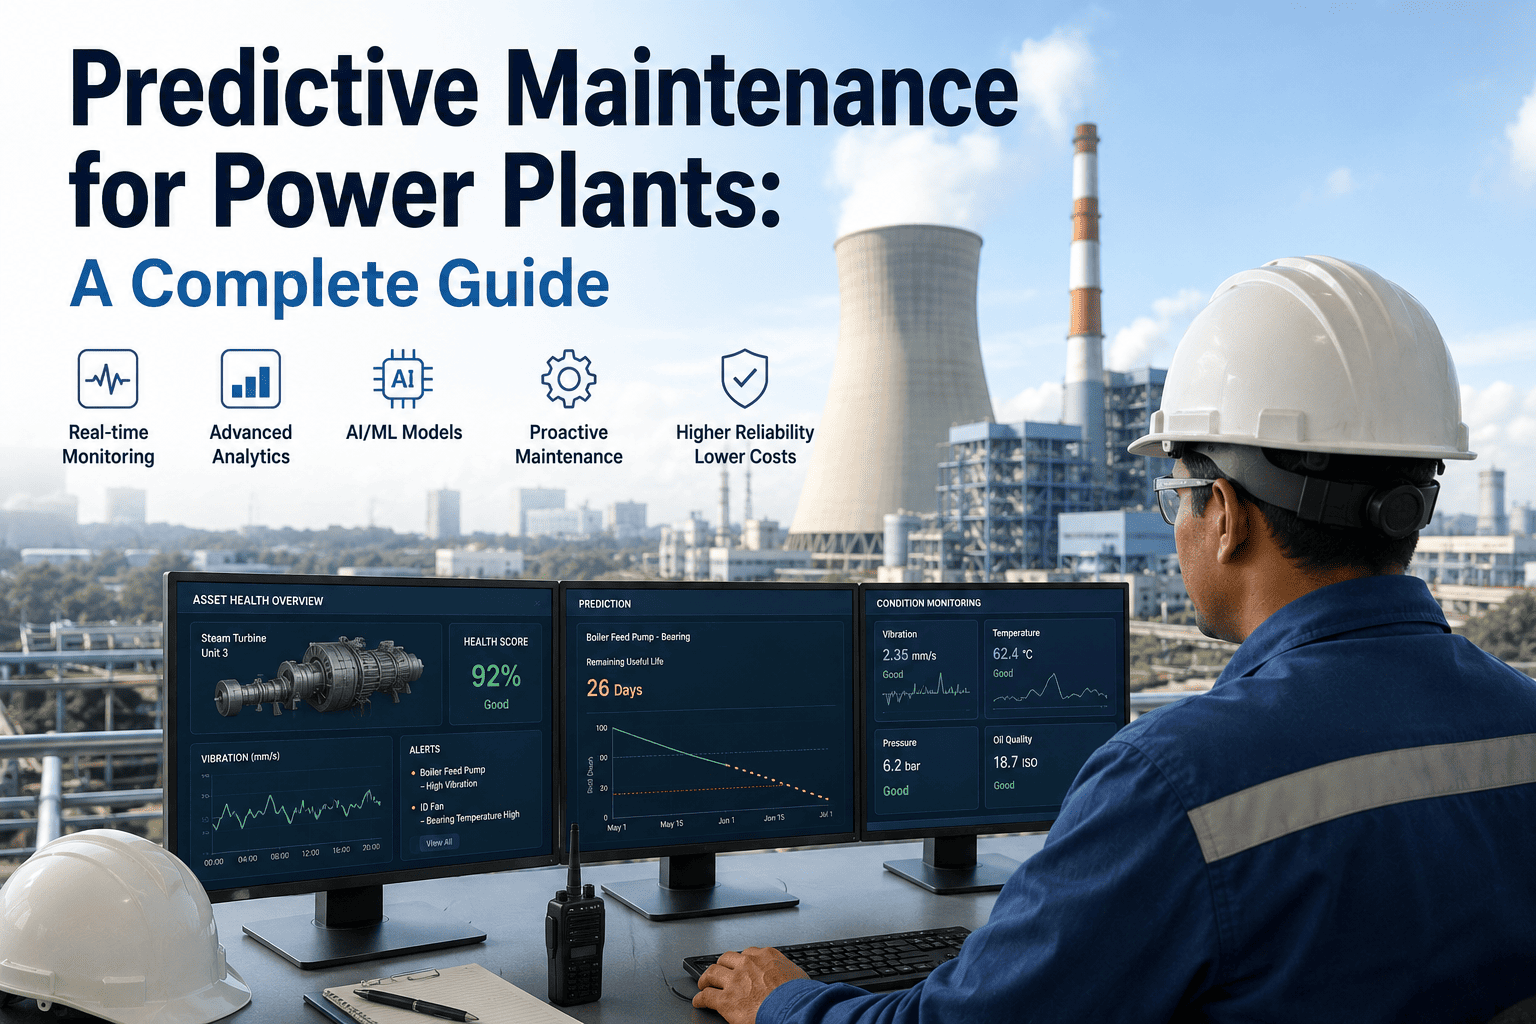
Sensors only generate data. The prediction comes from running that data through fault models that know what failure looks like. Modern pharma PdM uses an Asset Health Index to score current condition and Remaining Useful Life analytics to forecast time-to-failure — comparing live signatures against golden-batch and historical norms.
From Sensor Signal to Scheduled Work Order
1
Sense
Capture
Vibration, temperature, torque, pressure, current streamed continuously from critical assets
2
Model
Analyze
AI fault models score Asset Health Index and compare against golden-batch baselines
3
Predict
Forecast RUL
Remaining Useful Life analytics flag degradation 2 to 4 weeks out, before quality impact
4
Act
Auto Work Order
CMMS generates a scheduled, GMP-documented work order during planned downtime
The Validation Problem — and How to Solve It
This is where most pharma PdM projects stall. The barriers cited most often are limited failure data, and validation and re-validation requirements. A sensor that informs a maintenance decision in a GMP plant is not "extra instrumentation" — it carries qualification obligations. The way through is to treat every sensor as a classified, qualified asset from day one.
GAMP 5 Classification
Each sensor classified by impact — direct, indirect, or non-GMP — which sets how deep qualification and how often calibration must go.
IQ / OQ Evidence
Installation and operational qualification executed and captured: placement photos, acceptance results, calibration certificates per sensor.
NIST-Traceable Calibration
Product-quality-critical sensors (autoclave, lyophilizer temperature) need calibration traceable to NIST with out-of-tolerance escalation.
Threshold Justification
Alarm thresholds documented with engineering justification — trended against ISO 10816 severity zones for vibration.
URS Traceability
Sensor placement, baseline, and thresholds traceable to the User Requirement Specification, registered in the asset hierarchy.
21 CFR Part 11 Records
Every PdM-triggered intervention documented with electronic signature, timestamp, and an audit-ready trail.
Want a sensor-by-sensor validation roadmap that satisfies CSV from the first install? Talk to our reliability and compliance engineers.
What the Numbers Look Like
The business case for pharma PdM is one of the strongest in manufacturing, precisely because a single prevented failure can cover a year of platform cost. These figures come from documented PdM implementations and industry analysis across pharma and adjacent sectors.
25-40%
Lower maintenance cost
versus reactive or fixed-schedule strategies
70%
Less equipment downtime
in mature condition-based programs
20-40%
Longer asset life
from intervening before damage compounds
10:1+
Documented ROI
DOE benchmark, reaching 30:1 in mature deployments
A Phased Path to Predictive
You do not flip a plant from reactive to predictive overnight, and you should not try. The proven approach is a maturity ladder — start with one critical asset, prove value, validate, then widen. Pharma sites have reached production-grade PdM in roughly four to eight weeks per phase this way.
1
Reactive
Fix on failure. The baseline — expensive, unplanned, and quality-risky.
2
Preventive
Calendar-based PM. Compliant, but blind between intervals and prone to over-maintenance.
3
Condition-Based
Sensors on critical assets, thresholds and alarms. The first predictive step — one asset, validated.
4
Predictive
AI fault models, AHI and RUL, auto work orders. Drift caught weeks out, fix scheduled into planned downtime.
Frequently Asked Questions
Does adding PdM sensors break our equipment validation?
Not if they're handled as qualified assets. Each sensor is classified under GAMP 5 by impact, qualified through IQ/OQ with documented placement and calibration, and its alarm thresholds justified and traced to the URS. Done this way, the sensor strengthens your equipment-control posture rather than undermining validation — facilities with documented condition monitoring see about 61% fewer 483 observations on equipment control.
Do we replace preventive maintenance with predictive?
No — the optimal pharma strategy is a validated hybrid. Preventive maintenance satisfies regulatory obligations and produces the audit-ready completion records GMP requires, while predictive monitoring sits on top to catch failures that develop between PM intervals. You keep compliance and gain reliability instead of trading one for the other.
How far ahead can PdM actually warn us?
For mechanical degradation, typically 2 to 4 weeks — enough to schedule the fix into planned downtime. For fast-moving quality signals like tablet-press compression force, models can flag drift in the first few minutes of a batch with 15 to 30 minutes' lead time before quality impact, catching the problem before significant volume is produced.
What's a realistic ROI timeline for a pharma site?
Faster than most industries — typically 3 to 6 months to payback, because a single prevented major failure (a destroyed parenteral batch, a multi-day line hold) can cover the entire first-year platform cost. The US DOE benchmarks predictive programs at around 10:1 ROI, climbing toward 30:1 in mature deployments as models sharpen and coverage expands.
What stops most pharma PdM projects?
Two things: limited historical failure data to train models on, and underestimating validation and re-validation effort. Both are solvable by starting narrow on one well-instrumented critical asset, using AI models that compare against golden-batch baselines rather than needing thousands of failure examples, and building qualification evidence into the rollout from day one rather than bolting it on later.
Catch the Drift Before the Deviation.
See Pharma PdM Running on Your Critical Asset — in 30 Minutes
Bring the asset that keeps costing you batches. We'll show how sensors feed AI fault models, how Asset Health and Remaining Useful Life forecast the failure, and how the work order auto-generates with full Part 11 records — on a validated, CSV-ready path from one machine to the whole site.
2-4 wk
Failure warning lead
70%
Less downtime, mature