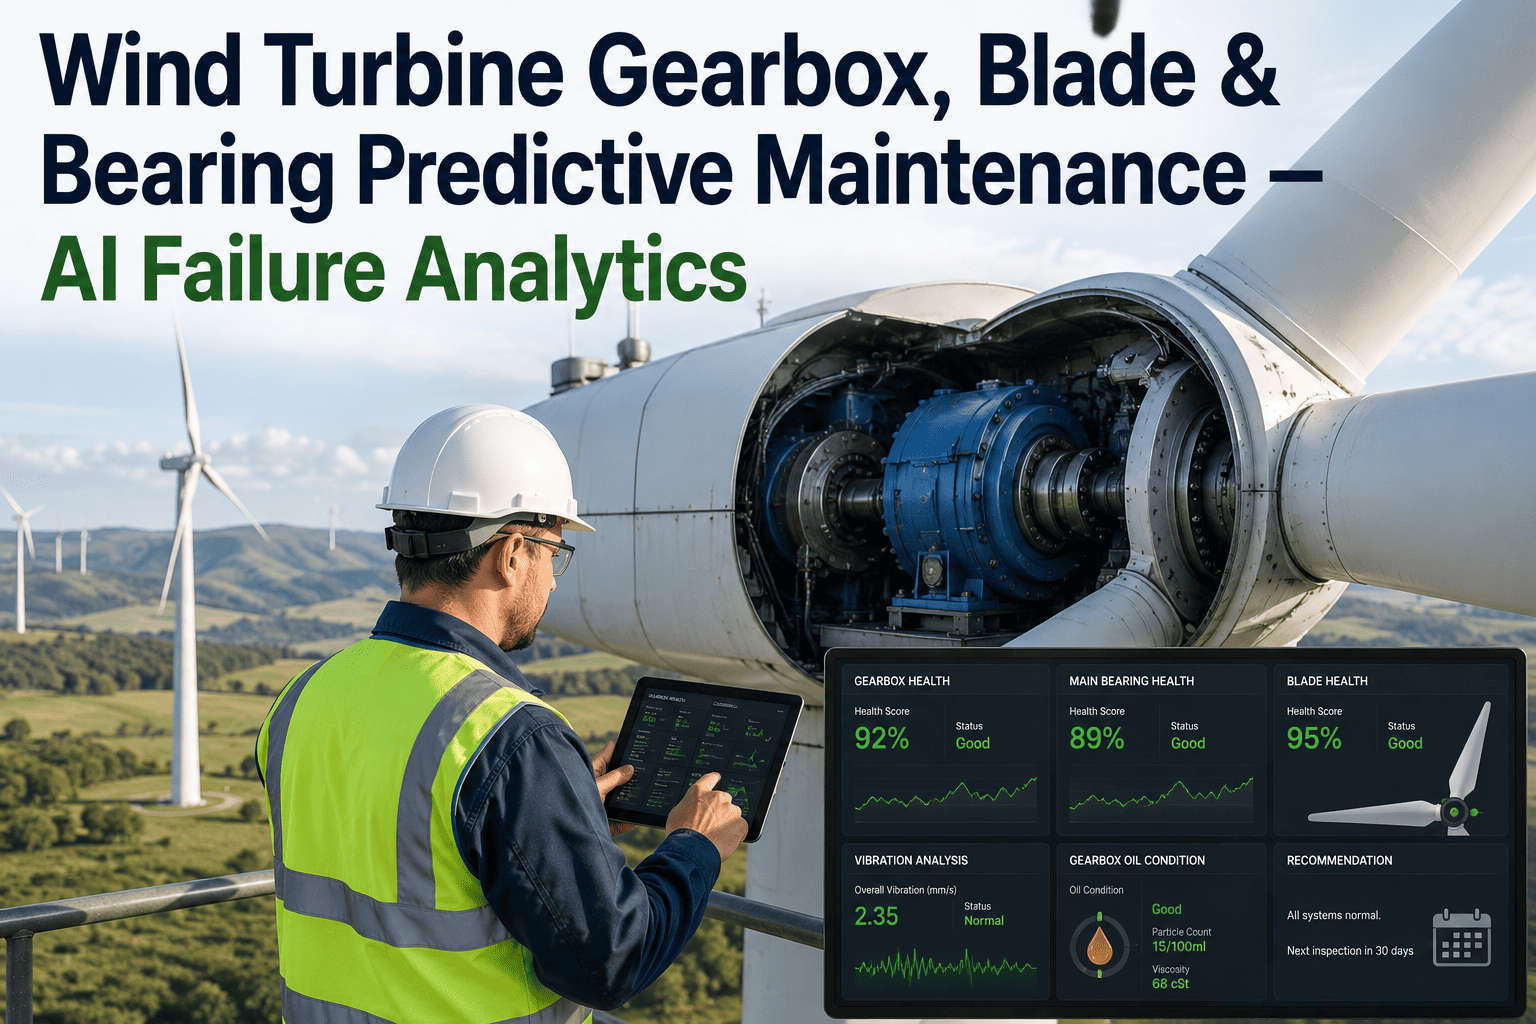
A main bearing temperature climbs four degrees above its normal band at two in the morning. The SCADA system logs it as one yellow flag among twenty others across the farm. By the time the morning crew reviews the trend, the bearing has already accumulated twelve thousand additional stress cycles at elevated temperature — and the gearbox oil sample drawn three weeks ago is still sitting unanalyzed at the port. That four-degree drift was the first signal of a failure that will eventually cost $320,000 in repairs and eighteen days of downtime. The signal was there; the system just was not listening the right way. An iFactory on-prem AI layer listens to every signal from every turbine simultaneously — SCADA temperatures, vibration patterns, oil particle counts — and predicts the failure months before it stops the rotor.
iFactory · Wind Power AI
Predict Gearbox, Blade, and Main Bearing Failures Months Before They Stop the Turbine
Your turbines already generate the signals that reveal developing failures. On-prem AI reads SCADA data, vibration signatures, and oil condition together — scheduling major replacements during low-wind windows instead of losing revenue to emergency stops.
Three Components, Three Failure Timelines, One AI Layer
A wind turbine has three major components that account for the vast majority of catastrophic downtime and repair cost: the gearbox, the blades, and the main bearing. Each degrades on its own timeline, each produces different warning signals, and each demands a different maintenance response. Managing them separately — one vendor for vibration, another for oil, a third for blade inspection — creates gaps. AI reads all three signal streams together and sees the interaction that isolated monitoring misses.
3-6 months for gear tooth damage, 6-12 months for bearing failure
Downtime if missed
18 days for a full rebuild
Blades
2-5% AEP loss from erosion
Primary failure
Leading edge erosion from rain at 250-350 km/h tip speed
Warning signals
Power curve deviation, pitch angle anomaly, drone image analysis
Revenue impact
Heavily eroded blades lose up to 5% annual energy production
Repair cost shift
$500-1,000 drone inspection vs $3,000-5,000 rope access
Main Bearing
Major crane mobilization required
Failure mode
Seal degradation, moisture ingress, grease breakdown
Warning signals
Temperature rise, SCADA anomaly patterns, vibration shift
Detection window
Up to 4 months from SCADA-based AI models
Critical threshold
Bearing temp above 80 C triggers warning, above 90 C is severe
The Real Cost of Waiting for the Alarm
Traditional condition monitoring catches failures — but too late. A vibration trend crosses the alarm threshold on Thursday night, the monitoring service reviews it on Monday, and by then the damage has progressed from a bearing replacement to a full gearbox rebuild. The economics are brutal: $320,000 in repair costs plus $126,000 in lost PPA revenue at $50/MWh — a total six-figure event that the SCADA data predicted days or weeks earlier, if anyone had been reading it the right way.
6-12 months before failure
Oil particle count begins trending upward. Gearbox bearing temperature shows occasional 2-3 degree spikes above normal band. AI detects the pattern — flags for planned maintenance during next low-wind window.
AI action: schedule replacement, order parts, book crane
3-6 months before failure
Ferrous particle count exceeds 10 mg/L. Vibration spectrum shows early spalling signature. Temperature spikes become more frequent. Traditional CMS may start showing alerts.
Without AI: alert noted, review scheduled for next quarter
Days before failure
Bearing temperature hits 90 C. Vibration alarm triggers at night. Monitoring service reviews on Monday. Bearing has seized — full gearbox rebuild now required. 18 days down, $320k repair, $126k lost revenue.
Every industrial-scale turbine already generates hundreds of SCADA variables at 10-minute intervals — temperatures, pressures, speeds, power output, pitch angles, yaw positions. The data is there; it was just never designed for condition monitoring. AI models built on this data detect anomalies by learning what normal looks like for each turbine in each wind condition, and then flagging when the signals deviate from that learned baseline. No extra sensors required for the first level of prediction — the model trains on what your turbines already collect.
SCADA Data Stream
Gearbox bearing temperatures
Generator winding temperatures
Rotor speed and power output
Pitch angle per blade
Nacelle ambient temperature
Yaw position and error counts
Vibration and Oil
Gearbox vibration spectrum
Main bearing vibration signature
Ferrous particle count (mg/L)
Oil viscosity and acid value
Oil contamination grade
Blade and Aero
Power curve deviation
Blade pitch asymmetry
Drone inspection imagery
Tower vibration frequency
Want to see what your SCADA data reveals about gearbox and bearing health? Talk to a wind AI specialist — we will run a retrospective analysis on your fleet's historical data.
Scheduling the Big Replacements in Low-Wind Windows
The difference between a predicted failure and an emergency failure is not just the repair cost — it is when you do the work. A gearbox replacement during a planned low-wind maintenance window costs the replacement itself. An emergency failure during peak season adds crane standby charges, expedited parts shipping, PPA curtailment penalties, and lost production from the highest-revenue months. AI prediction gives reliability engineers the one thing they need most: time to choose when the turbine comes down.
Emergency replacement
Component repair/rebuild
$320,000
Lost PPA revenue (18 days)
$126,000
Emergency crane mobilization
Premium
Expedited parts shipping
Premium
Total per event
$450k+
Planned replacement (AI-predicted)
Component replacement
$250,000
Lost revenue (low-wind window)
Minimal
Scheduled crane booking
Standard
Parts pre-staged on site
Standard
Total per event
~$260k
Blade Health: The Silent Revenue Leak
Blade degradation does not stop the turbine — it drains it. Leading edge erosion from rain, insects, and dust impacting the blade tips at up to 350 km/h roughens the aerodynamic surface, increasing drag and decreasing lift. Even moderate erosion reduces annual energy production by 2-5%, and heavily eroded blades can lose up to 5% of output year after year. Across a fleet, that is millions in lost revenue that never shows up as a single alarm. AI detects the loss by tracking power curve deviation — when a turbine starts underperforming relative to wind speed, the model flags the blade set for inspection before the erosion progresses from repairable to replacement.
Mild erosion
1-2% AEP loss
Protective coating repair during scheduled maintenance
Moderate erosion
2-5% AEP loss
Blade repair with polyurethane coating, drone-assessed
Severe erosion
5%+ AEP loss
Blade replacement required — crane mobilization, $100k+ per blade
AI catches erosion at the mild-to-moderate boundary by detecting power curve deviation in SCADA data — triggering a drone inspection that costs $500-1,000 instead of waiting for rope access at $3,000-5,000.
Want to quantify how much AEP your fleet is losing to blade erosion right now? Book a demo and we will run the power curve analysis on your SCADA history.
Why On-Prem for a Wind Farm
Wind farms generate terabytes of SCADA data annually — high-frequency, high-volume, and commercially sensitive. Running the AI on-premise at the farm or at a regional operations center keeps three things intact that matter to reliability engineers managing fleet availability under PPA contracts.
Latency
Fleet-wide anomaly detection needs to process hundreds of variables across dozens of turbines in near real-time. Local inference keeps the analytics loop tight enough to catch overnight temperature excursions before the morning shift review.
Data sovereignty
SCADA data, power curves, and failure histories are competitive intelligence. On-prem keeps fleet performance data inside your operations perimeter — your data never leaves your network.
Connectivity
Remote onshore and offshore farms do not have guaranteed high-bandwidth links. On-prem AI keeps predictive coverage running regardless of satellite or fiber connectivity to the operations center.
Frequently Asked Questions
What data does the AI need from each turbine?
The 10-minute SCADA data your turbines already log — gearbox bearing temperatures, generator winding temperatures, rotor speed, power output, pitch angles, yaw position, nacelle ambient temperature, and alarm event logs. For deeper drivetrain prediction, vibration spectrum data and online oil debris sensor readings improve detection windows. No additional sensors are required for the baseline SCADA-based model.
How far in advance can AI predict a gearbox failure?
Oil debris monitoring provides 3-6 months advance warning for gear tooth degradation and 6-12 months for bearing failures. SCADA-based temperature models detect anomalies 1-4 months ahead. Combined, the AI layer gives reliability engineers enough lead time to order parts, book crane access, and schedule the replacement during a low-wind maintenance window.
Can the AI detect blade erosion without drone flights?
Yes — the first detection layer is power curve deviation analysis from SCADA data. When a turbine's actual power output falls consistently below its expected curve for a given wind speed, the model flags the blade set for inspection. The drone flight then confirms the severity and location. AI prioritizes which turbines need inspection first, reducing unnecessary flights across the fleet.
Does this work with multiple OEM turbines on the same farm?
Yes. The model learns normal behavior for each turbine type independently — a Vestas V110 and a Siemens Gamesa SG 3.4-132 have different SCADA variable sets and different operating envelopes. The AI trains separate normality models for each type and detects deviations from each turbine's own baseline, not a generic fleet average.
What is the ROI timeline for deploying AI condition monitoring?
Industry data shows condition monitoring systems yield 20-30% O&M cost reductions with a 2-4 year payback period. A single avoided emergency gearbox failure ($450k+ all-in) can pay for the AI deployment across a 20-turbine farm. Turnkey on-prem deployment — pre-configured NVIDIA AI server, SCADA integration, model training on your fleet history — goes live in 6-12 weeks.
Your turbines already have the data. Let AI read it.
See Predictive Failure Analytics Running on Your Fleet
Bring your fleet's SCADA history. We will train models on your turbines, your wind conditions, and your component history — and show you every developing gearbox, bearing, and blade issue the data already contains. Turnkey on-prem AI: pre-configured server, live in weeks, 1000+ industrial clients, 99.9% uptime.