A ball bearing manufacturer in Europe was losing 3.8% of its output to scrap — defective parts discovered only after the full production cycle completed. Each scrapped batch meant wasted raw material, machine time, energy, and operator hours. The quality team investigated each failure reactively, tracing defects backward through dozens of process variables. After deploying AI-driven predictive quality analytics, machine learning models began predicting bearing quality up to one hour before the production cycle ended — giving operators time to adjust parameters while parts were still in process. Scrap dropped by 2% in the first quarter. Root cause investigations that once took days now took minutes, because the AI had already identified which process variables correlated with each defect pattern. The savings weren't just in material — they were in time, energy, and the engineering hours previously consumed by detective work that AI now did automatically.
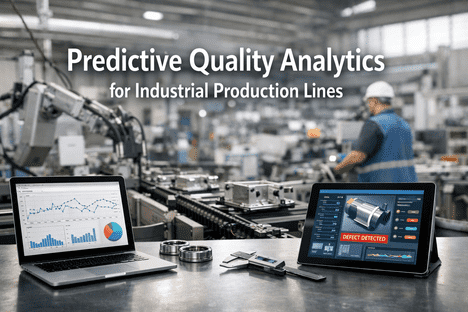
Quality Analytics
Stop Finding Defects.
Start Preventing Them.
Quality management is the top application of big data analytics in manufacturing — capturing 26.5% of the market. Yet most plants still discover defects after they've happened, not before. Predictive quality analytics uses AI to identify the process conditions that cause defects — and intervene before a single bad part is produced.
$14.3B
Manufacturing big data analytics market by 2030
26.5%
Market share held by quality management analytics
20%
Of revenue lost to cost of poor quality (avg. manufacturer)
18%
First-pass yield improvement with predictive quality AI
Sources: Grand View Research 2025 · IISE · Maruti Suzuki Predictive Quality Study · iFactory Platform Data 2026
The Reactive Quality Trap: Finding Defects Too Late
Most manufacturing quality systems are built to detect defects — not prevent them. SPC charts flag when a process has already drifted. Lab tests confirm what's already been produced. Customer complaints reveal what's already shipped. Every one of these is a lagging indicator. By the time you know something went wrong, the damage is done — material wasted, energy consumed, production time lost, and in the worst case, defective product in a customer's hands.
The Cost Cascade of Reactive Quality
Process Drift
$0
A subtle parameter shift — temperature, pressure, tool wear — begins. Invisible to operators and SPC charts.
Defect Production
$100
Hundreds of parts produced before drift is detected. In one case, 1,000 units made before a pneumatic cylinder drift was noticed.
Late Detection
$1,000
Defect found at end-of-line inspection or in the lab. Entire batch quarantined. Rework or scrap decision begins.
Customer Escape
$10,000+
Defect reaches customer. Warranty claim, recall, brand damage, lost contract. Intel estimates fixing a flaw in planning costs $100 — in production, $10,000.
Predictive Quality Breaks the Cascade
Predicts
AI models forecast product quality 15–60 minutes before the production cycle ends — before defects are created
Correlates
Analyzes 200–500 process variables simultaneously to identify which parameter combinations cause each defect type
Intervenes
Delivers real-time setpoint recommendations — adjust temperature by X°, reduce speed by Y% — while parts are still in process
Learns
Every production cycle adds data. Models continuously improve — accuracy increases month-over-month without manual retraining
Still discovering defects after they've been produced? See how predictive quality catches them before they happen — book a live demo.
Five Capabilities of Predictive Quality AI
Predictive quality analytics isn't one feature — it's a system of interconnected capabilities that transform quality from a detection function into a prevention function. Each capability compounds the value of the others.
01
In-Process Quality Prediction
15–60 min advance warning
ML models trained on your process data predict product quality before the cycle ends. Operators receive quality forecasts with confidence scores — enabling preemptive corrections that prevent defects instead of detecting them after the fact.
ALTEN predicted ball bearing quality 1 hour ahead — reducing scrap 2% in the first quarter
02
Root Cause Identification
Minutes, not days
AI correlates quality outcomes with hundreds of upstream variables — raw material properties, machine settings, environmental conditions, operator actions — to pinpoint the exact combination of factors causing each defect type.
Clear cause-and-effect analysis replaces weeks of manual investigation with instant root cause insight
03
Process Parameter Optimization
Continuous closed-loop
Beyond prediction, AI recommends optimal setpoints for every controllable parameter — temperature, pressure, speed, feed rate, chemical dosing — that maximize quality while minimizing energy and material consumption.
Appliance Lighthouse site cut defect rates by double digits with real-time AI parameter adjustment
04
Intelligent Sampling
Reduce inspection 60%+
Instead of 100% inspection or random sampling, AI directs inspection only to parts predicted to be at risk — dramatically reducing inspection effort while improving actual quality assurance compared to fixed sampling plans.
Predictive sampling focuses resources on high-risk production — catching more with less effort
05
Supplier Quality Prediction
Pre-production risk scoring
AI scores incoming material batches by correlating supplier history, material properties, and downstream production outcomes. Risky lots are flagged before they reach the line — preventing escaped defects at the source.
Maruti Suzuki improved first-pass yield 18% and reduced production defects 12% with predictive quality
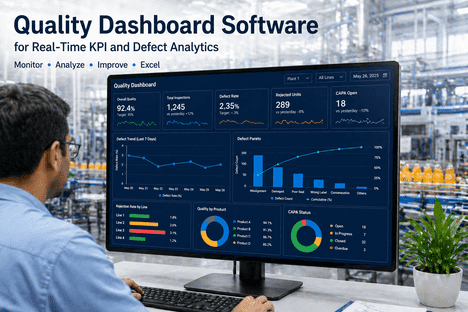
Your Production Data Already Contains the Answers. AI Extracts Them.
iFactory connects to your MES, SCADA, ERP, and lab systems — unifying process, quality, and material data into one AI-powered analytics engine that predicts quality outcomes, identifies root causes, and optimizes parameters in real time.
Documented Results: Predictive Quality in Action
These results come from production-grade deployments across automotive, steel, textiles, and electronics — not pilot programs or lab simulations.
Maruti Suzuki
18%
First-pass yield improvement
12%
Production defect reduction
Predictive analytics identified errant torque values in engine bolt tightening processes — catching defects that manual inspection consistently missed. Enhanced traceability from part to batch to supplier.
Welspun (Textiles)
30%
Post-production complaint reduction
15%
Raw material waste reduction
ML models combined with computer vision predicted color discrepancies and fabric shrinkage before batches were finalized. ROI achieved in under nine months.
Tata Steel
50%
Unplanned downtime reduction
₹40 Cr/yr
Estimated annual savings
IoT sensors with AI algorithms monitored temperature, vibration, and energy consumption — predicting equipment failures two weeks in advance. Equipment lifespan improved 25%.
BMW (Automotive)
AI vision combined with predictive analytics across production lines — correlating quality data with process parameters to identify optimization opportunities invisible to manual inspection.
The ROI of Predicting Quality Instead of Detecting It
Payback Period
6–12 Months
Scrap reduction and inspection savings typically recover full deployment cost within the first year. Welspun achieved ROI in under nine months. Quick wins in root cause analysis deliver value within weeks.
Scrap Reduction
12–40%
Catching defects in-process instead of post-production eliminates the material, energy, and labor wasted on parts that were always destined for the scrap bin.
First-Pass Yield Gain
10–18%
Predictive parameter optimization keeps processes in the quality sweet spot consistently — producing more right-first-time parts on every shift.
Inspection Effort
60%+ reduction
Intelligent sampling directed by AI quality predictions replaces costly 100% inspection or blind random sampling — inspecting less while catching more.
Warranty Cost Reduction
30–85%
Fewer defect escapes means fewer customer returns, warranty claims, and recall risks. Welspun saw 30% fewer complaints; automotive plants report up to 85% fewer customer quality issues.
Root Cause Speed
Days → Minutes
AI correlation analysis replaces manual Ishikawa diagrams and trial-and-error investigations. Quality engineers shift from detective work to process optimization.
Why iFactory for Predictive Quality
01
Unified MES + Quality + Maintenance Intelligence
Quality defects often trace to equipment degradation that maintenance hasn't caught yet. iFactory connects production data, quality outcomes, and equipment health in one platform — so when a defect pattern correlates with a machine's vibration trend, both quality correction and maintenance action trigger from a single AI detection.
02
Any Data Source, Unified in Minutes
iFactory ingests data from MES, SCADA, ERP, LIMS, manual logs, sensor streams, and vision systems — automatically mapping data structures and harmonizing formats. No 12-month data lake project required. First quality predictions are live within 60 days.
03
Built for Manufacturing, Not Data Science
Quality engineers interact with intuitive dashboards showing defect predictions, root cause rankings, and parameter recommendations — not Python notebooks or SQL queries. The AI does the data science; your team does the process engineering.
04
Multi-Line, Multi-Plant Quality Benchmarking
Normalize quality metrics — FPY, defect rate, scrap percentage, Cpk — across every production line and facility. Identify which line is the quality leader, which is the underperformer, and what process parameters differentiate them. Best practices replicated automatically.
Every Defect You Find After Production Is a Defect AI Could Have Prevented
iFactory transforms your quality system from reactive detection to predictive prevention — connecting process data, quality outcomes, and equipment health into one AI platform that predicts defects, identifies root causes, and optimizes parameters in real time.
Frequently Asked Questions
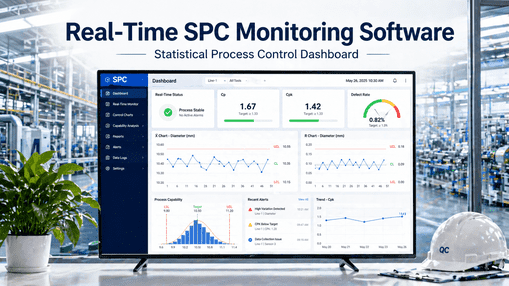
How does predictive quality differ from traditional SPC?
SPC monitors individual process variables against control limits — flagging when a single parameter has drifted. Predictive quality AI analyzes 200–500 variables simultaneously, detecting multivariate interactions that SPC cannot see. It predicts quality outcomes 15–60 minutes before production completes, while SPC only confirms a deviation has already occurred. Think of SPC as a smoke detector and predictive quality as a system that detects the conditions that cause fires before smoke ever appears.
What data does predictive quality need from our production lines?
At minimum: process parameters (temperature, pressure, speed, force, time), quality measurements (dimensional, visual, functional test results), and production context (material batch, machine, operator, shift). For best results, add incoming material properties, environmental data, and equipment condition indicators. iFactory connects to MES, SCADA, ERP, LIMS, and direct sensor feeds via OPC-UA, Modbus, MQTT, or API. Most plants can start generating predictions within 60 days of data integration.
How far in advance can AI predict quality problems?
It depends on your production cycle time and the physics of your process. For short-cycle discrete manufacturing (stamping, injection molding), predictions arrive 5–15 minutes ahead. For longer-cycle processes (bearing manufacturing, chemical batches, heat treatment), AI can predict quality 30–60 minutes before the cycle completes. In all cases, the prediction arrives before the defect is created — giving operators time to intervene while parts are still in process.
Does this work for our specific industry and product type?
Predictive quality analytics applies to any manufacturing process where quality outcomes are influenced by controllable process variables — which is virtually every manufacturing process. Documented results span automotive (Maruti Suzuki, BMW), steel (Tata Steel), textiles (Welspun), electronics (Intel, Samsung), bearings, food and beverage, pharmaceuticals, and chemical manufacturing. The AI doesn't need to "know" your industry — it learns your specific process from your own data.
What ROI can we expect and how fast?
Most deployments achieve ROI within 6–12 months. The primary savings come from scrap reduction (12–40%), first-pass yield improvement (10–18%), inspection effort reduction (60%+), and warranty cost elimination (30–85%). For a plant losing 20% of revenue to cost of poor quality (industry average), even a 25% improvement in quality costs delivers substantial annual savings. The fastest returns come from AI-driven root cause analysis, which often identifies quick-win process corrections within the first weeks.