Predictive OEE Analytics with AI for Production Output Optimization
By Josh Brook on April 20, 2026
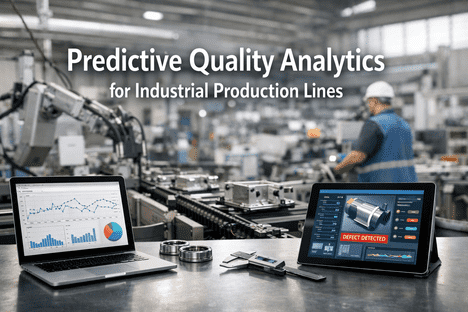
Real-time dashboards tell you what is happening. They do not tell you what is about to happen. By the time Line 3 loses a bearing, the forecast for this week's output is already six hours old, the production plan for next month is already built on a stale assumption, and the capacity you thought you had for the new contract was never actually there. Predictive OEE analytics flips the camera around. Instead of reporting on yesterday, it looks two hours, two weeks, and two quarters into the future — using machine learning models trained on your own historical data to tell you exactly what next Thursday's OEE will be, which line is quietly running out of capacity, and what happens if you add a shift or change a changeover sequence. Manufacturers using AI forecasting consistently report forecast accuracy above 95% where manual methods plateau at 70–80%, and routinely uncover 10–15% hidden capacity sitting on the floor they already own. The plants winning in 2026 are not the ones with the best dashboards. They are the ones with the best forecasts.
Predictive OEE Forecasting & Output Optimization
See Next Week's OEE Today — And Change It Before It Happens
iFactory's predictive analytics forecast OEE, throughput, and capacity gaps across every line and shift — then simulate what-if scenarios so your team acts on tomorrow's numbers, not yesterday's.
From Hindsight to Foresight — The Three Eras of OEE
Every OEE program passes through three distinct eras as it matures. Most plants are still stuck in the first two. The leap to the third is where competitive advantage stops being incremental and starts becoming structural.
Era 1
Hindsight
"What happened?"
End-of-shift and weekly reports. OEE reviewed days after the events that produced it. Most plants live here.
Lag: 1–7 days
Era 2
Insight
"What is happening?"
Real-time dashboards with live OEE, active downtime alerts, and current-shift trend lines. Reactive at best.
Lag: 1 sec – 15 min
Era 3
Foresight
"What will happen?"
Predictive AI forecasts next shift, next week, next quarter — with scenario modeling for every decision.
Lead: 2 hrs – 90 days
The OEE Forecast Curve — Looking Backwards and Forwards
Traditional OEE charts end at the present moment. iFactory's forecast curve keeps going — projecting your OEE trajectory forward based on current equipment health, scheduled orders, and historical patterns. The shaded band shows the confidence range; the line inside shows the most likely path. When the forecast dips below target, your team gets days to act instead of minutes to react.
90%
80%
70%
60%
Target 82%
Now
Forecast Alert
OEE projected to dip below target on Thursday — bearing vibration trend on Motor M-3.
Different decisions require different lookaheads. A supervisor deciding how to staff the next shift needs a 2-hour forecast. A planner scheduling next week's production needs 7-day visibility. A VP signing off on a capital plan needs a 90-day view. iFactory runs all three simultaneously, recalculated continuously as new data arrives.
Short Horizon
Next 2–8 Hours
For: Supervisors & Operators
Staffing for next shift, speed adjustments, sequencing changeovers around predicted dips.
Sample Prediction
Line 3 OEE next shift: 71% (±2.8)
Accuracy: 96–98%
Medium Horizon
Next 1–4 Weeks
For: Planners & Schedulers
Production schedules, PM sequencing, order commitments, overtime decisions, capacity load balancing.
Sample Prediction
Week of Nov 18 output: 142K units (±4%)
Accuracy: 92–95%
Long Horizon
Next 30–90 Days
For: Plant Directors & VPs
Capacity planning, hiring decisions, CapEx justification, new contract commitments, site strategy.
Sample Prediction
Q2 capacity gap: 8.4% — hiring trigger
Accuracy: 85–90%
What-If Scenarios — Test Decisions Before You Make Them
Before you add a Saturday shift, slow down a line to improve quality, or reschedule a changeover, the AI simulates exactly what will happen to your OEE, throughput, and total cost. No meetings, no guesswork, no learning after the fact — the answer is on screen in seconds.
Current Baseline
76.2%
Projected OEE
138K
Weekly Output
$0
Extra Cost
AAdd 4-hour Saturday shift
+3.1
OEE pts
+18K
Units/wk
+$14K
Cost/wk
ROI positive — recommended if demand holds
BSlow Line 3 by 8% to reduce scrap
+1.8
OEE pts
-4K
Units/wk
-$8K
Scrap cost
Quality gain, throughput trade — evaluate demand first
CResequence changeovers by SKU family
+5.4
OEE pts
+22K
Units/wk
$0
Extra cost
Strongly recommended — zero cost, highest impact
The Hidden Capacity Sitting on Your Floor
Every plant has untapped capacity it owns but cannot see — the gap between current OEE and the ceiling AI says is achievable within 90 days with the right interventions. For most manufacturers, this hidden capacity is worth more than any new piece of equipment they could buy. The only prerequisite is knowing it exists.
+15%
hidden capacity
Current output 68%
Quick wins +7%
Process tuning +5%
Scheduling optimization +3%
$2.8M
Annual value of unlocked capacity at current margin
Micro-stop elimination+7 pts
Speed recovery & tuning+5 pts
Schedule optimization+3 pts
Leading Indicators — What AI Actually Watches to Predict OEE
OEE is a lagging indicator. By the time it drops, the damage is done. Predictive analytics is only as good as the leading indicators it tracks — the early signals that move hours or days before OEE moves. iFactory correlates dozens of these inputs simultaneously, which is why the forecasts are calibrated rather than lucky.
Forecast accuracy vs. 70–80% from traditional methods
30–50%
Reduction in unplanned downtime through leading signals
+15%
Unlocked capacity without any new CapEx
2x
Faster response to demand spikes vs. rule-based planning
Frequently Asked Questions
What is predictive OEE analytics and how does it differ from real-time OEE tracking?
Real-time OEE tells you what your score is at this moment. Predictive OEE analytics uses machine learning models trained on your historical data to forecast what your OEE will be 2 hours, 2 weeks, or 2 quarters into the future. The difference is the window to act — real-time gives you seconds; predictive gives you days. Book a demo to see both together.
How much historical data do we need before the forecasts become accurate?
Short-horizon forecasts (2–8 hours) start delivering 90%+ accuracy after 2–3 weeks of live data. Medium-horizon (1–4 weeks) needs roughly 90 days of production history. Long-horizon forecasts stabilize once the model has seen a full cycle of seasonal variation — typically 6 months for most plants. iFactory's models retrain weekly, so accuracy improves continuously after go-live.
Can the AI simulate changes to our production without actually running them?
Yes. The what-if scenario engine lets planners test any decision — adding a shift, adjusting line speed, changing changeover sequences, rerouting orders — and see the predicted impact on OEE, throughput, and cost before the change is made. Most customers run 5–10 scenarios weekly to stress-test decisions that used to be made on intuition.
How is this different from standard ERP production planning?
ERP tells you the plan. It does not tell you whether the plan is achievable. iFactory forecasts actual expected OEE against the plan — surfacing capacity gaps, likely delays, and resource conflicts before production starts. The two systems work together: ERP sets the schedule, iFactory predicts whether it will hold. Ask support about ERP integration.
What inputs does the forecasting model actually use?
The model correlates equipment condition signals (vibration, temperature, cycle variance), operational context (shift, operator, SKU mix, changeover sequence), scheduled orders, and historical loss patterns. Dozens of leading indicators are weighted dynamically by the model based on which combinations best predicted past OEE movements at your specific plant.
What happens if the forecast turns out to be wrong?
Every forecast is published with an explicit confidence range, not a single point. When actual OEE diverges from the predicted band, the model logs the deviation, identifies which input changed unexpectedly, and retrains automatically. Over the first 90 days, customers typically see forecast error drop by 40–60% as the system learns local patterns unique to their operation.
Stop Running on Yesterday's Data
The Best Plants of 2026 Are Not the Ones With the Best Dashboards. They Have the Best Forecasts.
See a predictive OEE model running on your own production data — forecast your next 7 days, simulate two scenarios, and identify your hidden capacity in a single 30-minute session.