OEE tells you how much productive time you are losing. Cpk tells you whether the output you are producing meets specification. Run them separately — as most plants still do — and you are making improvement decisions with half the picture. A line running at 91% OEE with a Cpk of 0.94 is quietly building scrap and customer risk that the availability and performance charts will never surface. A line with Cpk of 1.45 but 73% OEE is destroying throughput that no quality report will flag. The only view that drives real continuous improvement is both metrics, live, on the same screen, weighted to business impact. Book a Demo to see how iFactory AI displays live OEE and Cpk together — including operator, speed, last recipe, and coils-this-shift — on a single unified dashboard.
One Screen. OEE and Cpk. Live.
iFactory AI unifies real-time OEE — availability, performance, quality — with live Cpk and SPC data on a single plant dashboard. No toggling between systems. No delayed reports. Full performance visibility, shift by shift.
Why OEE Alone and Cpk Alone Both Fail Continuous Improvement
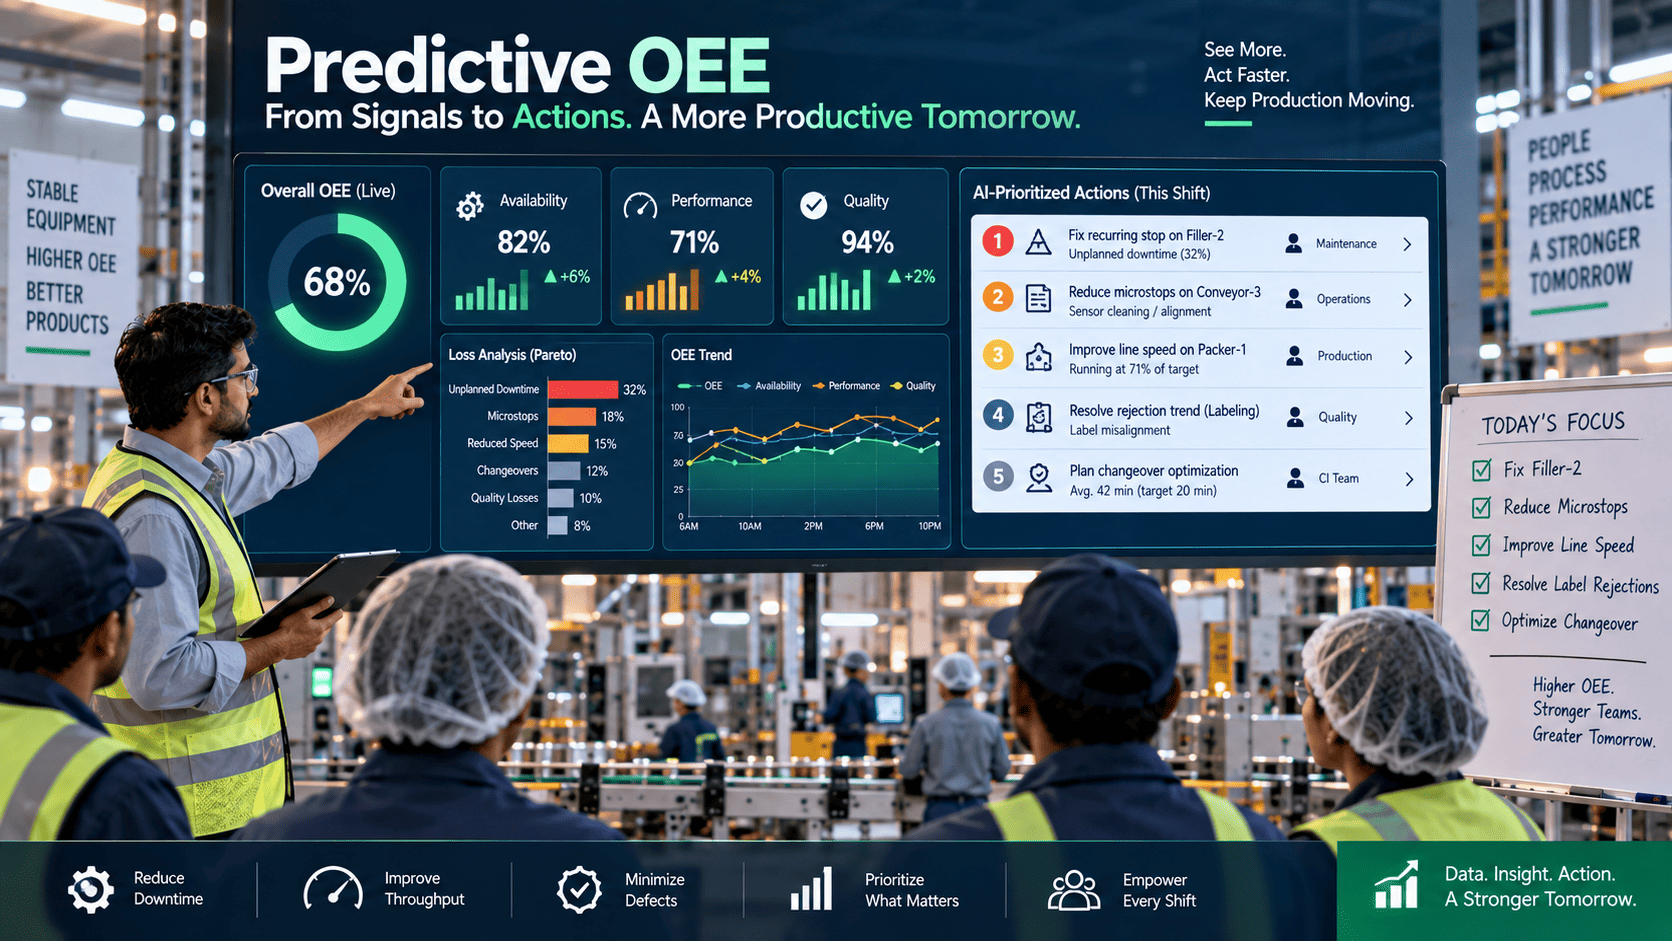
Overall Equipment Effectiveness measures three loss categories — availability losses from unplanned downtime and changeovers, performance losses from speed reduction and micro-stops, and quality losses from defects and rework. When OEE is displayed without process capability context, quality losses appear as a single percentage that tells the improvement team nothing about whether the process is trending toward specification boundary violations, whether the losses are systematic or sporadic, or which product families or recipes are driving the variation.
Cpk — the process capability index — measures how well a process is centered within its specification limits relative to its natural variation. A Cpk of 1.33 is the accepted industry minimum for a capable process. But a standalone Cpk dashboard shows no connection to shift patterns, equipment utilization, operator assignments, or production rate context. It answers whether the process is capable, but not why it is drifting or which operational conditions are driving it. Book a Demo to see how iFactory connects OEE and Cpk in a single live view.
- Quality loss rate visible — root cause invisible
- High OEE masks a drifting process approaching spec limits
- No indication of which recipes or materials drive variation
- Improvement teams chase availability while quality erodes
- Process capability visible — equipment losses invisible
- Good Cpk scores mask a line running at 68% utilization
- No shift, operator, or speed context for capability drift
- Quality teams optimize in isolation from throughput reality
- Every quality loss linked to its process capability signature
- OEE trends correlated with Cpk drift in real time
- Operator, recipe, speed, and batch context on one screen
- Continuous improvement decisions made on complete data
What the iFactory Unified OEE + Cpk Dashboard Displays
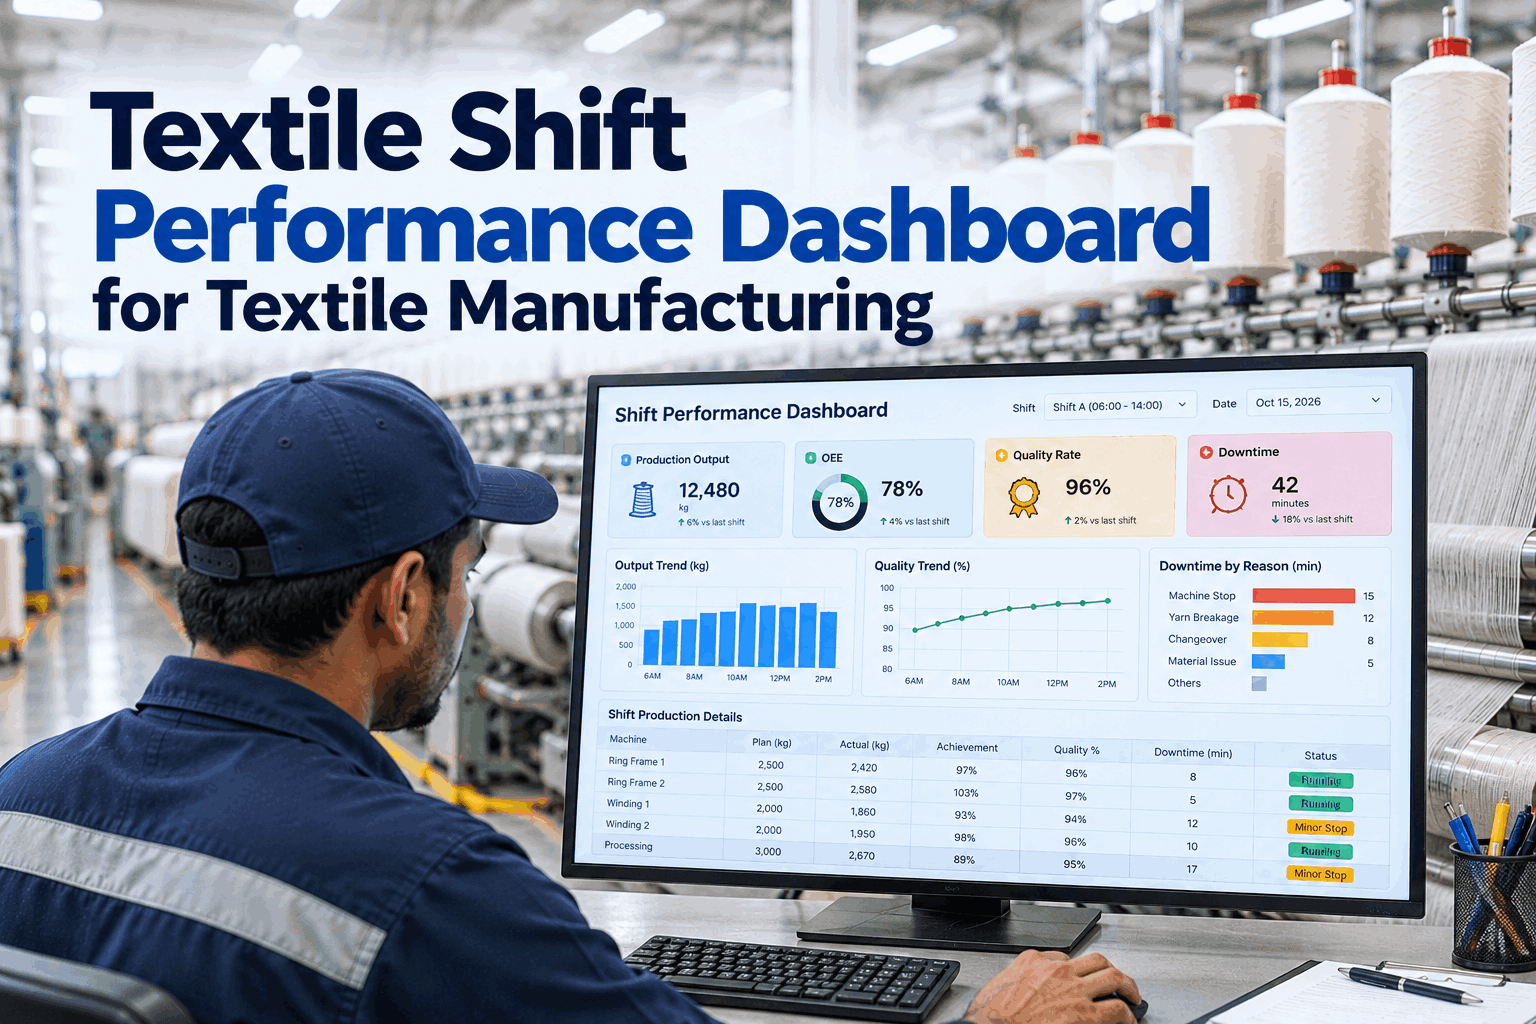
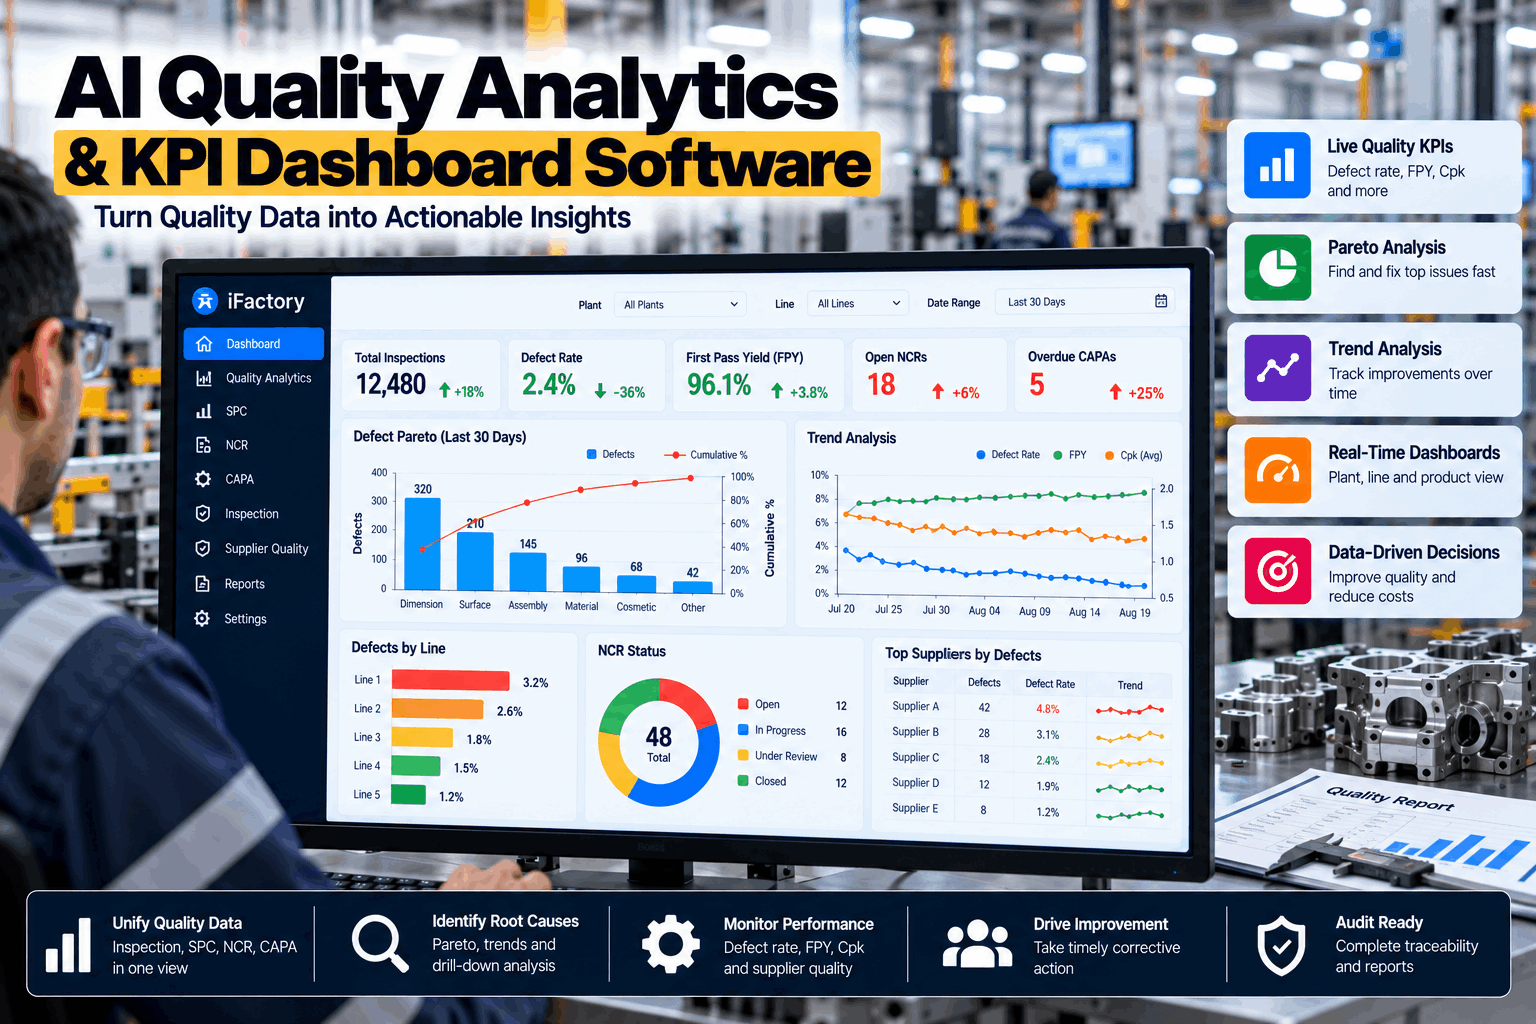
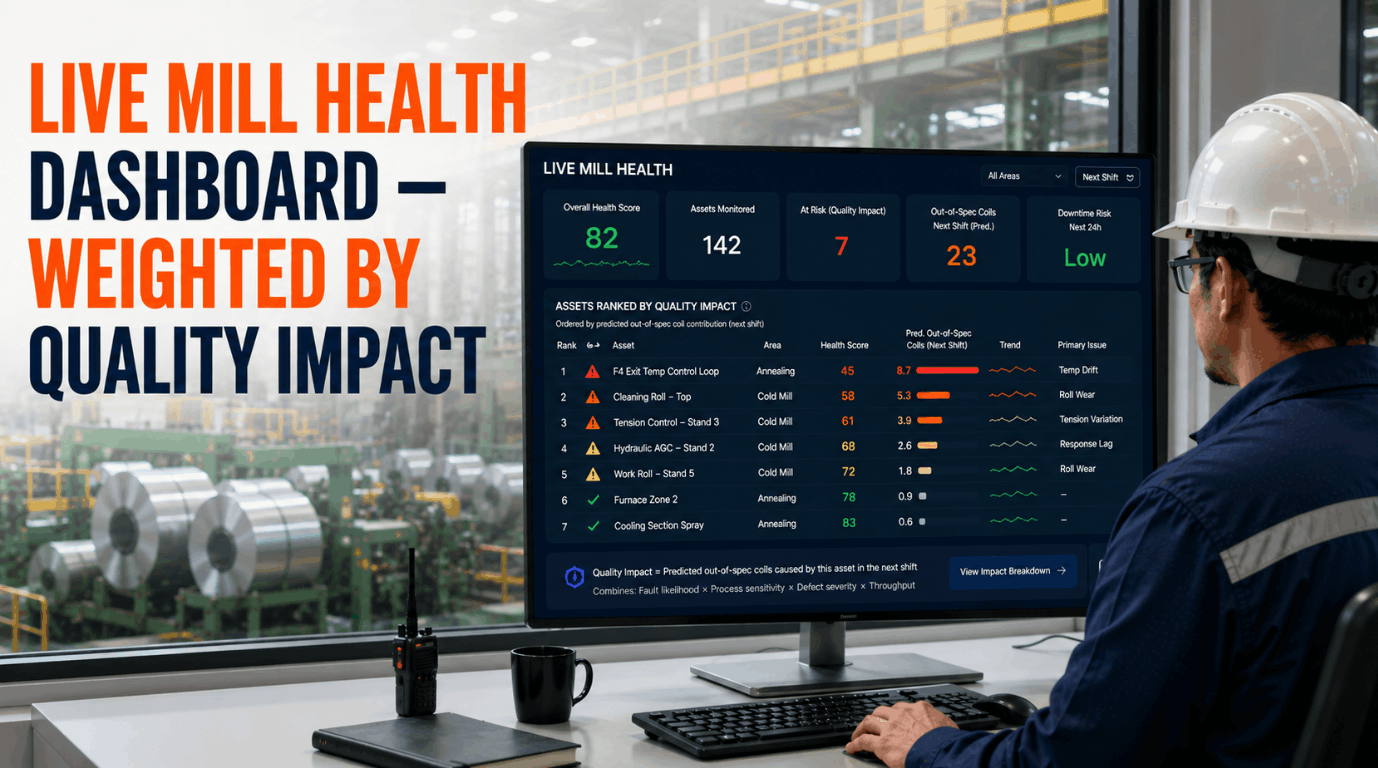
iFactory AI's Cold Mill dashboard — built for multi-line discrete and process manufacturing — combines every dimension of OEE performance with live Cpk and SPC data in a single operator and CI director view. The dashboard is not a reporting tool refreshed at shift end. It is a live operational surface updated continuously from the production floor, giving continuous improvement directors the contextual data needed to act within the shift rather than analyze it afterward.
The Business Case: What Separating OEE and Cpk Actually Costs
The financial cost of running OEE and Cpk as separate, unlinked systems is not visible in either metric alone — it shows up in delayed corrective actions, customer complaints traced to process drift that OEE never flagged, and improvement projects that optimize throughput while inadvertently degrading capability. The comparison below maps what changes when both metrics are unified in real time.
| Decision Scenario | OEE Only | Cpk Only | OEE + Cpk Unified (iFactory) |
|---|---|---|---|
| Line running fast, Cpk drifting to 1.05 | OEE shows green — no alert | Cpk alert, no throughput context | Speed + Cpk correlated — CI director acts within the shift |
| Changeover extends, quality stabilizes | Availability loss flagged, quality impact unknown | Cpk improves, no downtime linkage | Trade-off quantified — longer setup justified by Cpk recovery |
| New operator on shift, OEE drops 8% | Performance loss visible, cause unknown | No operator context in quality data | Operator + OEE + Cpk linked — targeted coaching identified |
| Recipe download on Cold Mill #2 | No recipe traceability in OEE data | Cpk shift not linked to recipe change | Last recipe DL logged — Cpk change attributed instantly |
| End-of-shift performance review | Throughput analyzed, quality separate | Quality analyzed, throughput separate | Single dashboard — complete shift debrief in minutes |
How CI Directors Use Unified OEE + Cpk Data to Drive Sustained Improvement
A unified OEE + Cpk view changes the continuous improvement workflow at the operational level — not just the reporting level. The following sequence maps how iFactory AI's live dashboard supports the full PDCA cycle within a single shift, rather than requiring multi-day data compilation between improvement cycles. Book a Demo to walk through the CI workflow on a live iFactory dashboard.
Set shift targets for OEE and Cpk together
CI directors enter shift targets for OEE — broken into availability, performance, and quality components — alongside Cpk minimums per quality characteristic. The dashboard holds both targets active, alerting in real time when either dimension drifts below threshold.
Monitor live OEE and Cpk with full operational context
Production runs with iFactory displaying live OEE %, current Cpk, actual speed vs. target, active operator, last recipe download, and coils-this-shift across Cold Mill #1 and #2 simultaneously. Supervisors and CI directors see the complete picture without switching systems.
Correlate deviations across OEE and Cpk simultaneously
When Cpk drops below 1.33 or OEE falls below target, iFactory surfaces the concurrent conditions — speed at time of drift, active operator, recipe in use, recent downtime events — enabling root cause identification within the shift rather than after it.
Issue corrective actions with full data traceability
Corrective actions — speed adjustment, recipe reload, operator reassignment, planned stop — are logged against the OEE and Cpk state at the time of intervention. This traceability builds the improvement evidence base that supports structured Kaizen and DMAIC projects over time.
Measured Outcomes: What Unified OEE + Cpk Visibility Delivers
The operational and financial impact of unifying OEE and Cpk on a live platform is measurable at the shift level. The table below reflects typical outcomes observed across iFactory AI deployments in cold rolling, discrete manufacturing, and process industry environments where OEE and Cpk were previously tracked in separate systems.
| Improvement Area | Separate OEE / Cpk Systems | iFactory Unified Dashboard | Typical Benefit |
|---|---|---|---|
| Time to Detect Cpk Drift | End of shift or next-day SPC review | Real-time — within minutes | 85% faster response |
| Quality Loss Attribution | Manual cross-referencing, hours of analysis | Automatic — recipe, operator, speed linked | 70% reduction in analysis time |
| OEE Quality Component | Estimated from end-of-run scrap counts | Live, from Cpk-driven reject detection | Accurate, actionable within shift |
| Shift Debrief Duration | 45–90 min compiling reports | Under 15 min — single dashboard review | 75% time saving per shift |
| Repeat Defect Incidents | High — root cause tracing incomplete | Reduced — operator + recipe traceability | Up to 62% fewer repeat events |
| CI Project Cycle Time | Weeks to gather integrated data | Data available immediately for DMAIC | 3x faster improvement cycles |
Expert Review: Why Continuous Improvement Directors Need Both Metrics Live
Reviewed by continuous improvement engineers and manufacturing operations leaders with experience deploying OEE and SPC/Cpk systems across automotive stamping, cold rolling, pharmaceutical, and FMCG production environments. The following observations reflect the most common failure modes seen when OEE and Cpk are managed as separate disciplines.
The most consistent finding across CI engagements is that teams optimize the metric they are measuring, not the one they are not. When OEE is the primary KPI, improvement teams focus on uptime and throughput. Quality losses receive attention only when they breach a threshold — and by that point, the process has often been running outside capability for an entire shift or longer. The inverse is equally true: quality-focused teams chasing Cpk targets frequently accept speed reductions or extended changeovers as acceptable trade-offs without quantifying the OEE cost of that decision. Neither is a rational improvement strategy — both are artifacts of metric fragmentation.
The second consistent finding is that the highest-value CI opportunities are always at the intersection of OEE and Cpk — the conditions where a speed increase degrades capability, where a specific operator correlates with both higher throughput and higher variation, or where a recipe change restores Cpk at the cost of an availability event. These opportunities are invisible when the two metrics live in different systems. Book a Demo to see how iFactory surfaces these intersection points live on the dashboard.
A live unified platform also changes the CI governance model. When OEE and Cpk are both visible in the same shift review, the conversation between production, quality, and continuous improvement teams changes from a negotiation between competing metrics to a shared diagnostic of what actually happened on the line. That shift in conversation structure is consistently where measurable improvement acceleration begins.
Frequently Asked Questions: OEE + Cpk Unified Platform
Does iFactory display OEE and Cpk on the same screen or require switching between dashboards?
iFactory's unified dashboard displays live OEE %, Cpk, speed, operator, last recipe download, and coils-this-shift simultaneously on a single screen — no navigation between separate views required.
How does iFactory calculate OEE — from manual entries or live machine data?
OEE is calculated continuously from live machine signals — PLC, SCADA, and sensor data via OPC UA and MQTT — not from operator entries, eliminating the accuracy and latency problems of manual collection.
Can iFactory track OEE and Cpk across multiple lines — such as Cold Mill #1 and #2 — simultaneously?
Yes. iFactory's multi-line dashboard displays OEE and Cpk per line simultaneously, with operator, speed, recipe, and production count data shown per asset — enabling cross-line comparison in real time.
Does the platform support SPC control charts alongside Cpk on the same dashboard?
Yes. iFactory displays live SPC control charts — X-bar, R, and individual-moving-range — alongside Cpk values, with control limit breach alerts surfaced in real time within the same unified performance view.
How long does it take to deploy iFactory's OEE + Cpk dashboard at a new facility?
For a standard cold mill or discrete production environment with existing SCADA or PLC connectivity, iFactory's unified OEE + Cpk dashboard is typically live within four to six weeks from integration kickoff.
Conclusion: The Unified View Is the Only View That Drives Real Improvement
Continuous improvement programs that track OEE and Cpk separately are making decisions with half the data. The intersection of those two metrics — where throughput conditions influence process capability and where quality drift explains OEE losses — is where the most significant improvement opportunities live. That intersection is invisible when the metrics exist in separate systems, separate reports, and separate shift reviews.
iFactory AI's unified OEE + Cpk dashboard closes that gap. Live OEE by component, live Cpk by quality characteristic, operator assignment, recipe traceability, speed vs. target, and coils-this-shift — all on one screen, updated continuously from the production floor. For continuous improvement directors, that is not a reporting improvement. It is an operational capability that changes what decisions get made, how fast they get made, and how well they hold.
One Dashboard. Every Performance Dimension. Real Time.
iFactory AI unifies OEE and Cpk on a single live plant dashboard — with operator, recipe, speed, and production count context built in. Schedule a walkthrough and see your improvement data the way it should have always looked.