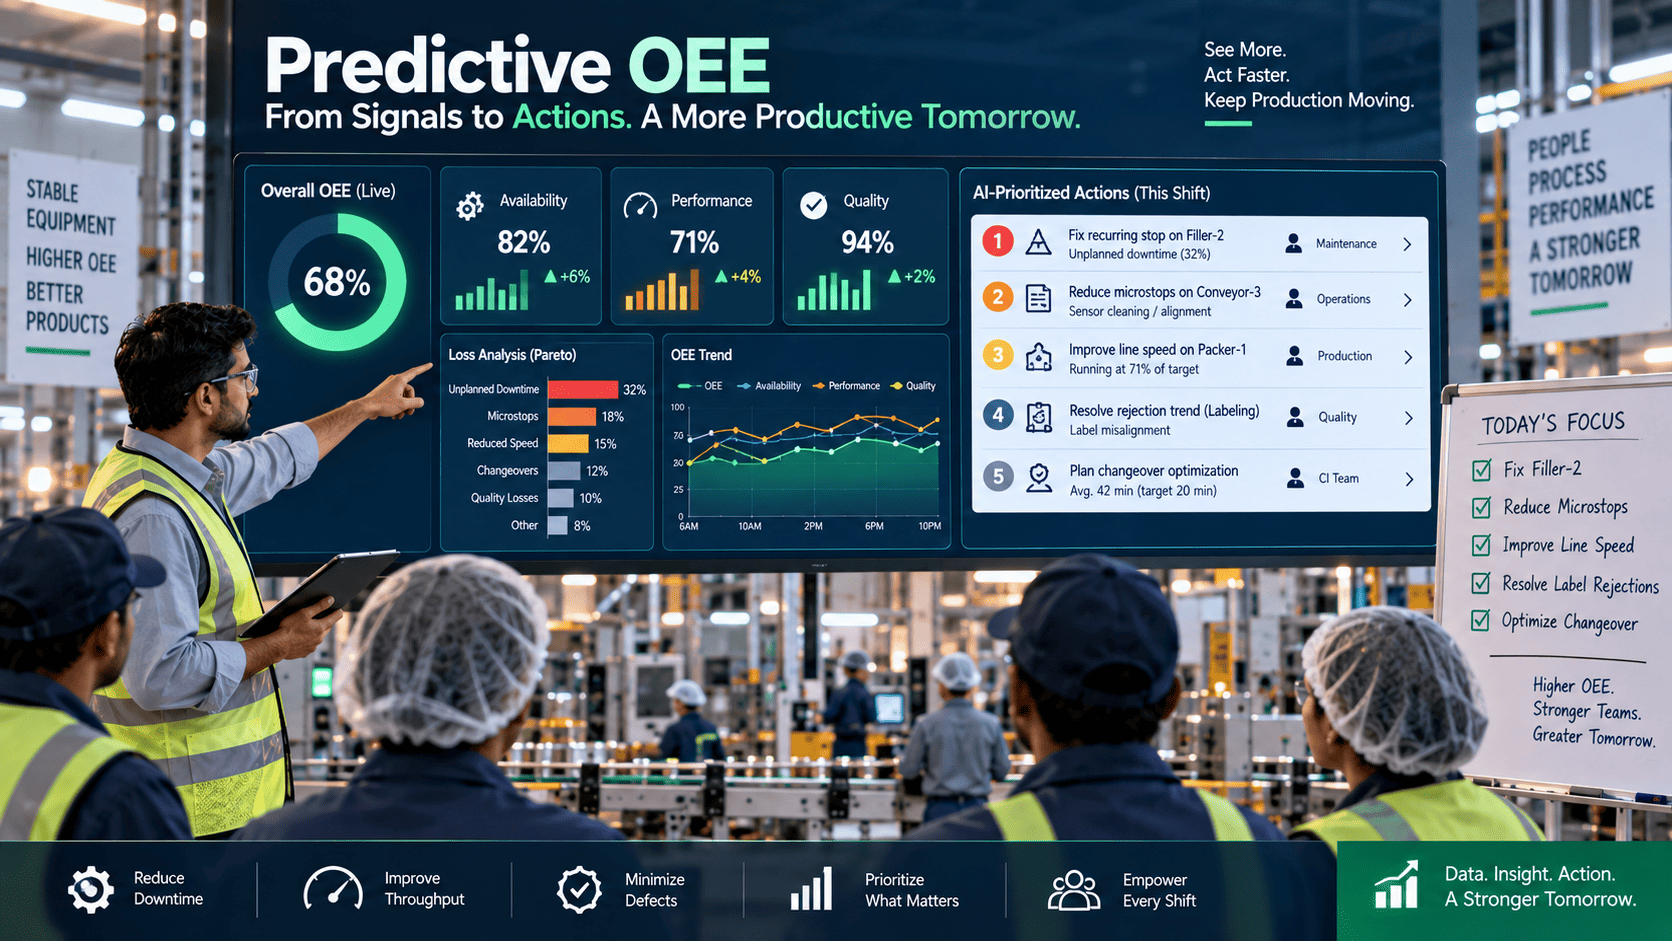
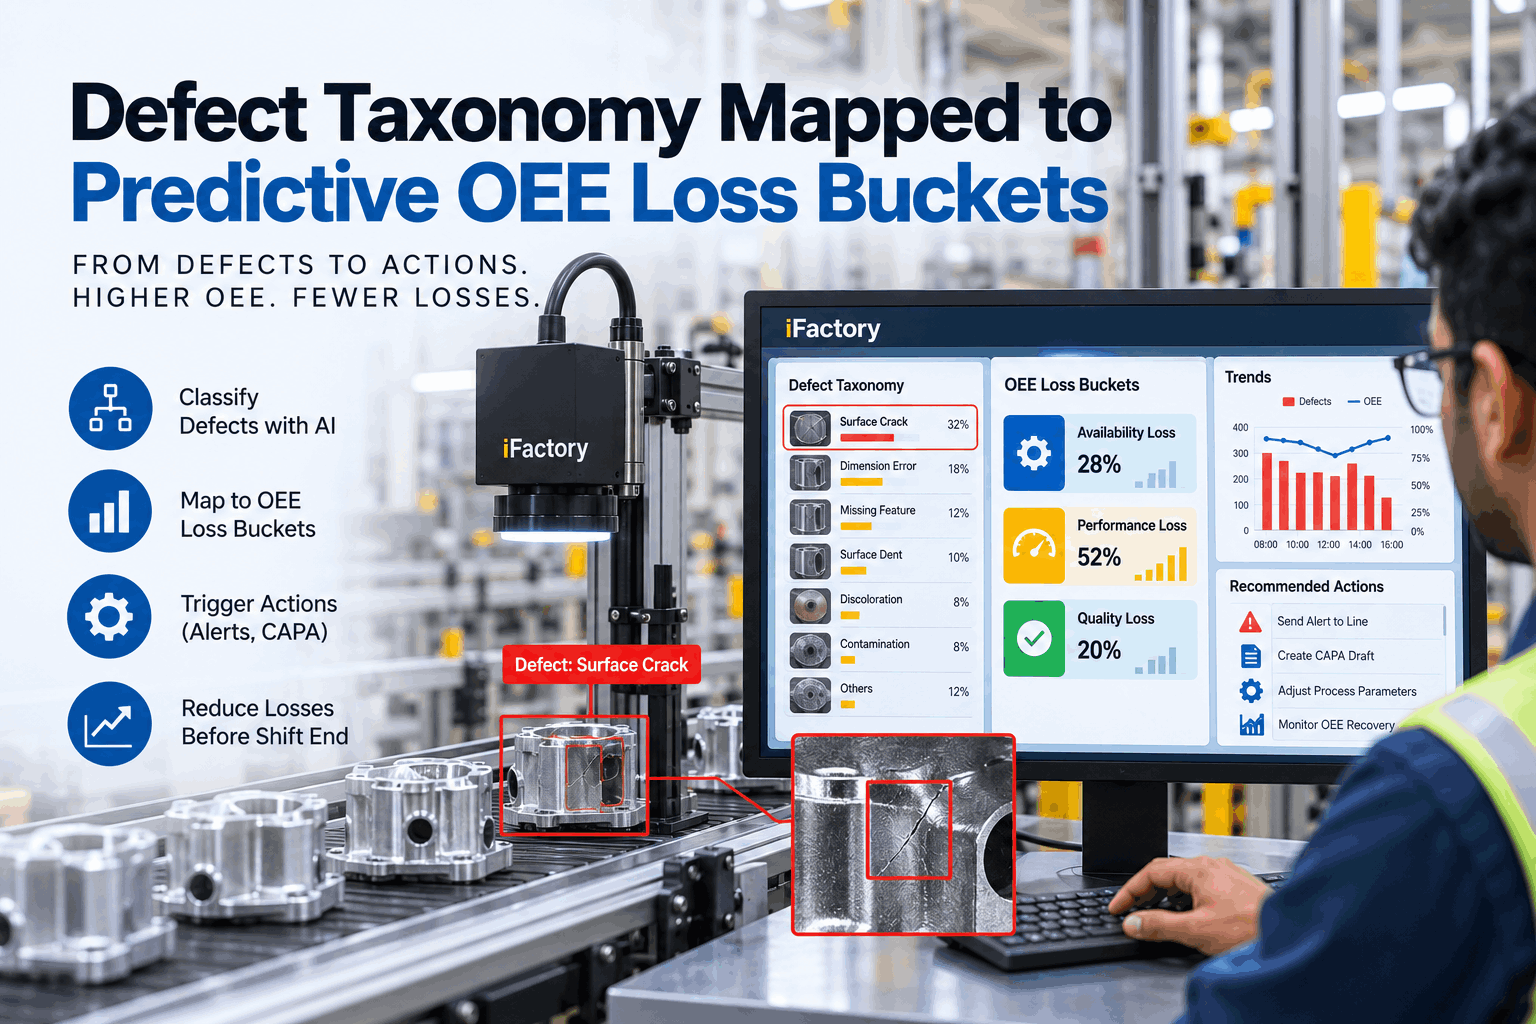
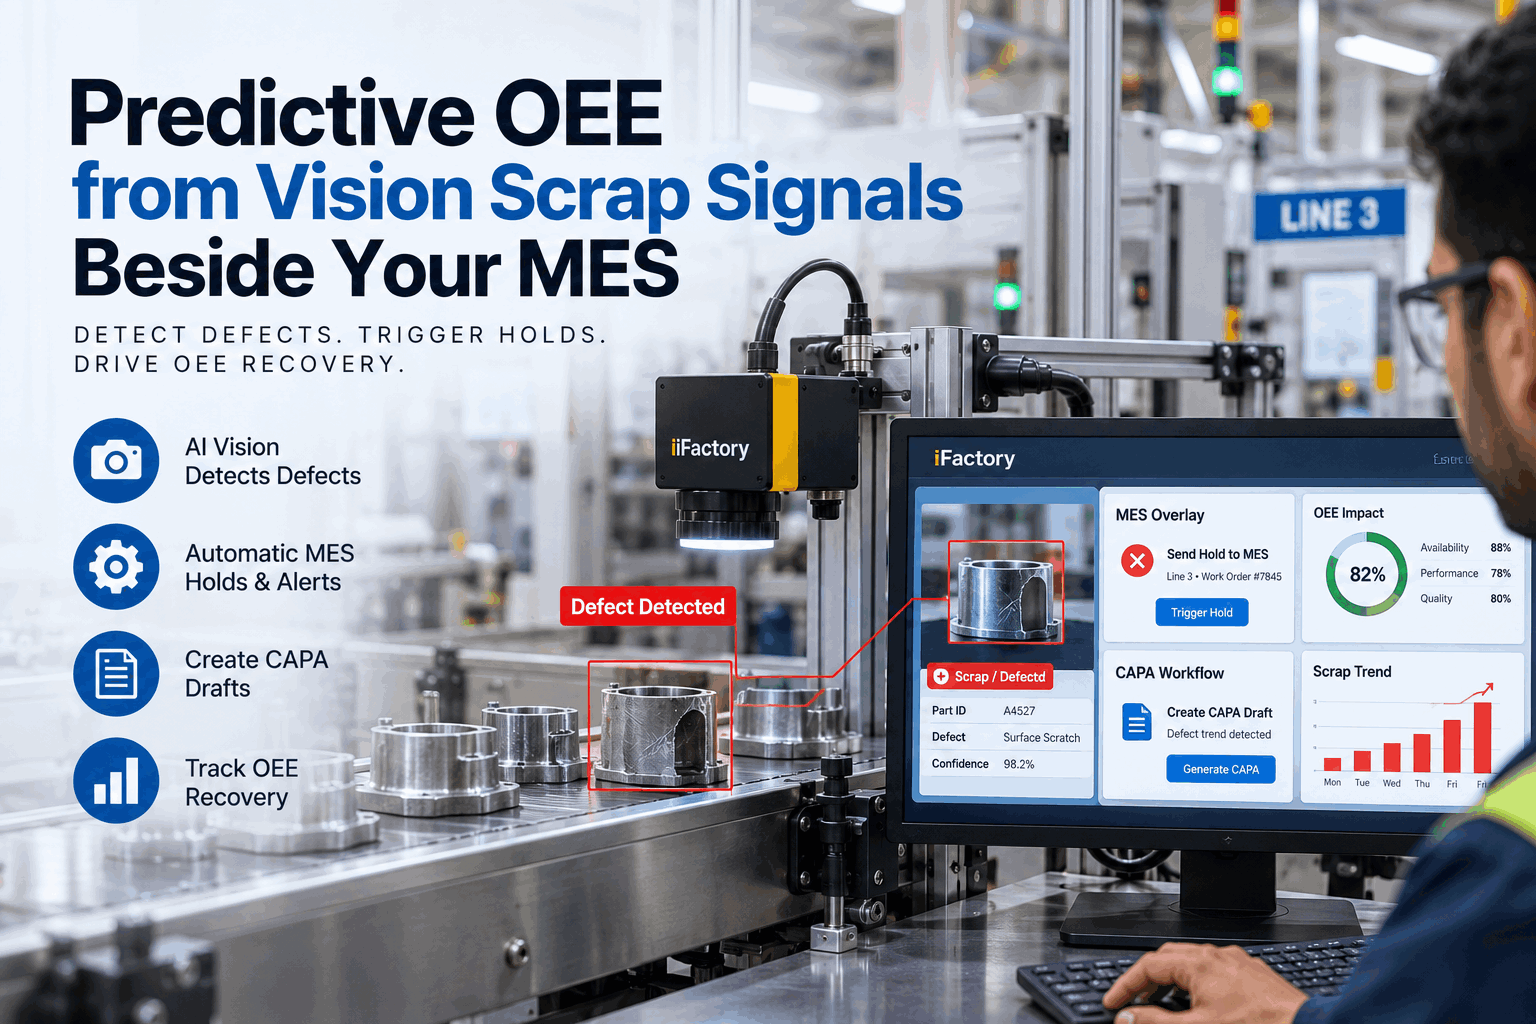
The early shift huddle ends and you stare at yesterday’s OEE dashboard. The red, yellow, and green tell you what went wrong — but not who should do what next. That is the gap. Predictive OEE turns availability, performance, and quality signals into a live, ranked action list that operators and supervisors can act on this shift, instead of one more report that summarizes losses after they are already paid for. The move is from passive reporting to a short, owned, prioritized set of tasks most likely to improve OEE right now.
iFactory / Predictive OEE & prioritized actions
From Loss Tree to the Top Three Actions for This Shift
An overlay that maps PLC telemetry, MES events, SPC patterns, genealogy records, and manual logs to a real loss tree — then ranks the few fixes worth doing now by impact, confidence, and who can actually execute them.
Availability loss
Microstops · changeover
↓
Performance loss
Slow cycles · tool delay
↓
Quality loss
Rework · minor defects
↓
Ranked action
#1 → operator · this shift
2–4 actions
per role, per shift
Overlay
no rip-and-replace
Closed loop
outcome feeds ranking
The Problem on the Floor
Dashboards summarize where losses occurred — downtime minutes, slow cycles, scrap — and then stop. Loss trees help root-cause thinking, but many implementations end at the drilldown, leaving frontline teams with a long issue list and no order or owner. Meanwhile the data variety works against you: PLCs, MES and QMS events, SPC logs, genealogy records, and paper entries rarely combine, so availability, performance, and quality signals never come together into a single plan anyone can act on. The result is a plant that measures OEE accurately and improves it slowly.
Where OEE Programs Stall
The stall points are consistent, and none of them are about measurement accuracy.
Reporting, not deciding
Dashboards show where losses occurred but stop short of recommending a prioritized response anyone is accountable for.
Drilldowns that end
Loss trees support analysis but frequently terminate at the drilldown, leaving a long unordered issue list with no owner.
Fragmented data
PLCs, MES/QMS events, SPC logs, genealogy, and paper entries stay separate, so the three OEE factors never combine into one plan.
Aggregate scores
A single OEE number hides the difference between a microstop, a tool-change delay, and a minor defect — which need entirely different fixes.
What High-Performing Plants Do Differently
They treat OEE as an operational decision tool rather than a reporting artifact. Four things separate them from plants with equally good dashboards.
Layered Capture
Availability, performance, and quality signals collected near real time from machines, MES/QMS, SPC, genealogy, and manual logs alike.
Discipline: nothing excluded
Real Breakdowns
Losses split into planned maintenance, microstops, tool-change delays, rework, and minor defects instead of one aggregate score.
Discipline: named loss types
Ranked Actions
Tasks prioritized by expected OEE impact, diagnosis confidence, and the resources actually required to carry them out.
Discipline: ordered, not listed
Role-Based Views
Operators, technicians, and supervisors each get a short, focused task list scoped to their line and shift — not a shared backlog.
Discipline: layered accountability
Overlay-First, Not Rip-and-Replace
iFactory AI is built as an intelligent overlay, not a mandate to replace your MES or QMS. You keep current systems and data flows; the overlay consumes their signals and adds the predictive layer on top. Hybrid plants are explicitly supported — manual SPC and SQC entries or paper logs can be incorporated, so batch and food operations are not excluded from prioritization. Integration is pragmatic: mapping key signals to a loss tree takes planning, but it is far less disruptive than a full-system swap, and it can be validated on one line before it touches anything else.
How iFactory AI Fits
Predictive OEE moves from signals to a short prioritized list through a defined sequence. Four capabilities carry it:
Layered Ingest
Overlay Layer
Overlays existing data — PLC telemetry, MES events, SPC/SQC patterns, genealogy records, and manual logs — so nothing useful is left out of the picture.
Loss Tree Mapping
Model
Events are categorized as availability, performance, or quality loss and subtyped — microstop, minor defect, slow cycle — so fixes match the real cause.
Impact + Confidence
Ranking
Each candidate fix is scored for expected impact and for confidence based on historical patterns and signal strength, then ordered by net effect.
Assign and Close
Action Layer
Tasks route by role; status updates feed back so the system learns which actions actually reduced downtime, cycle loss, or defects.
Run this test at tomorrow’s huddle. Ask what the top three actions are for this shift on your worst line, and who owns each one. If the answer is a dashboard rather than three names and three tasks, the ranking layer is what is missing — not more measurement. Book a demo and bring one line’s loss data; we’ll produce a ranked list from it.
An Illustrative Scenario — A Filler Line Pilot
A medium-speed filler line in a food plant had recurring downtime, slow cycles, and minor defects. After a two-week pilot integrating PLC events and shift logs, the platform surfaced three prioritized actions for the next shift: replace a suspect filler valve, with the operator calling maintenance; shorten changeover checklist steps by reordering tooling, as a supervisor-led trial; and institute statistical checks on an incoming packaging batch, assigned to the quality engineer. These targeted the small set of root causes responsible for most of the loss on that line. This is an illustrative example and not a guaranteed outcome — actual results depend on your plant’s processes and data quality.
A Phased Path to Ranked Actions
A transparent, phased approach reduces disruption and keeps expectations honest. Expect faster time-to-value where machine telemetry and MES signals already exist; hybrid plants with manual logs take slightly longer but still reach prioritized actions in weeks.
Weeks 1–3
Discovery and Mapping
Identify key lines, dominant loss types, and essential signals from PLCs, MES/QMS, SPC, and manual sources. Define the loss tree and mapping rules.
Weeks 2–4
Connect and Validate
Implement connectors or secure CSV/API transfers. Validate timestamps, part genealogy, and event semantics with shop-floor SMEs.
Weeks 3–6
Pilot and Tune
Run one- or two-line pilots. Use live feedback to tune ranking logic, thresholds, and the execution metadata shown to operators.
Step 4
Keep Lists Short
Deliver the top two to four actions per operator or supervisor per shift. A twenty-item backlog is a report, not a plan.
Step 5
Tie to Rituals
Make the ranked list the first item in daily huddles and the main topic of continuous-improvement rounds, so it shapes how time is spent.
Step 6
Scale and Improve
Roll out across more lines while refining the models with closed-loop outcomes and direct operator input.
Measuring Success Without Magic Numbers
Rather than promising a fixed return, track operational outcomes you can actually observe. These four tell you whether the ranking layer is changing behaviour or just decorating it.
Speed
Time-to-action
How long between a loss signal appearing and a task being assigned to a named person. This is the metric the overlay most directly moves.
Execution
Action completion rate
The percentage of prioritized actions completed within the shift they were issued for — the clearest signal that lists are the right length.
Attribution
Impact tied to closed actions
Changes in availability, performance, and quality linked back to specific completed actions, so teams see cause and effect rather than correlation.
Durability
Repeat reduction and adoption
Fewer recurrences of the same loss subtype after verified fixes, and continued use of the ranked list in huddles and CI reviews.
What This Cannot Do
Ranked actions will not fix deep process issues overnight, and no ranking survives poor data. Standardize event names, cycle definitions, and shift boundaries early or the prioritization inherits the ambiguity. Expect real time from real people — roughly two to three hours a week from a production SME, a quality engineer, and an IT/OT contact during pilots. Keep connections read-only where possible and maintain a documented schema of mapped signals, because an unannounced MES or PLC change can silently break prioritization. And the impact estimates are estimates: they are there to order the list, not to promise a number.
FAQ
Does iFactory AI require me to replace my current OEE or MES platform?
No. iFactory AI is an overlay that ingests signals from existing OEE, MES, QMS, PLCs, SPC logs, genealogy records, or manual entry. The goal is to augment what already works in your plant, not replace it.
Book a demo to see it running beside an existing stack.
How does iFactory AI rank OEE actions — what data does it use?
Ranking uses layered signals mapped to a manufacturing loss tree, historical patterns, and predictive analytics to estimate expected impact and confidence. It also factors in who can execute the action and how quickly they can do it.
Can this work with manual data entry, or only automated signals?
Yes, it works with both. The platform accepts hybrid inputs including manual SPC and SQC logs and paper-based quality reports, which matters for many batch and food plants where full automation is not realistic.
How do I ensure prioritized actions actually change frontline work, not just supervisors’ dashboards?
Keep action lists short and role-specific, provide execution metadata and escalation steps, integrate them into shift huddles, and use closed-loop feedback so frontline teams see the effect of tasks they completed.
What does it take to get started — are pilots time-consuming or disruptive?
Pilots are intentionally scoped to be low-disruption, often a single line or product family. The upfront work focuses on mapping signals to the loss tree; after that the platform iterates quickly on live feedback.
See the action list in your plant.
Bring One Line’s Loss Data — We’ll Rank It
Move past static OEE dashboards. We’ll show how availability, performance, and quality signals from your existing systems become a live, ranked, role-based action list for operators, techs, and supervisors.
Role-based
short lists per shift
Hybrid
manual logs included