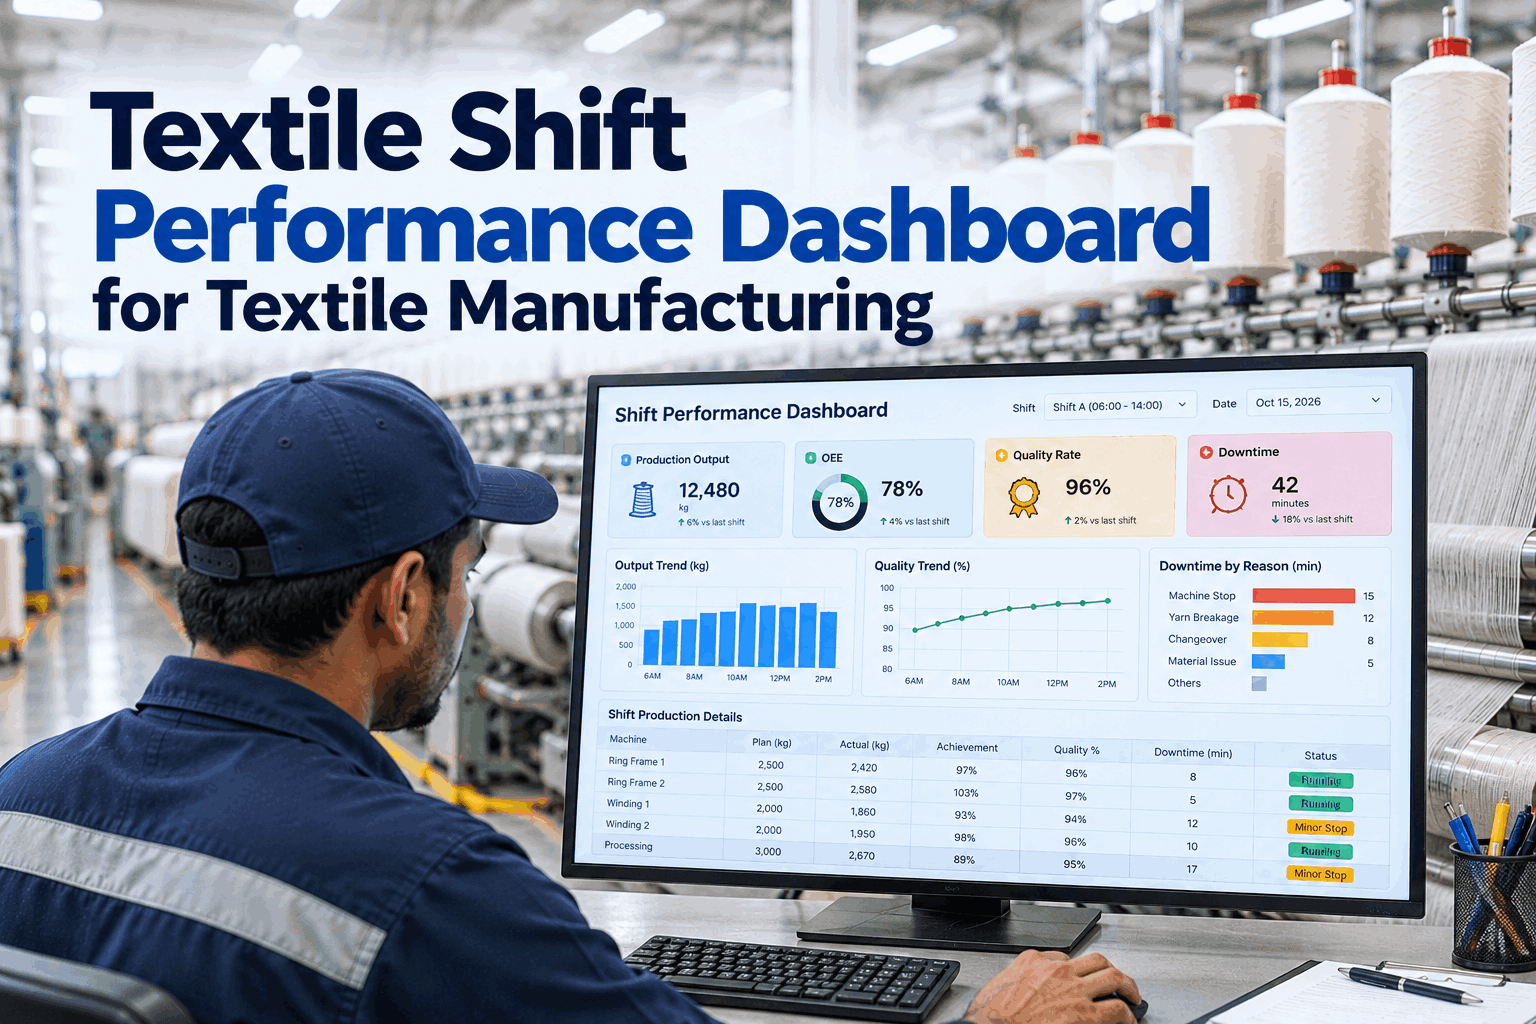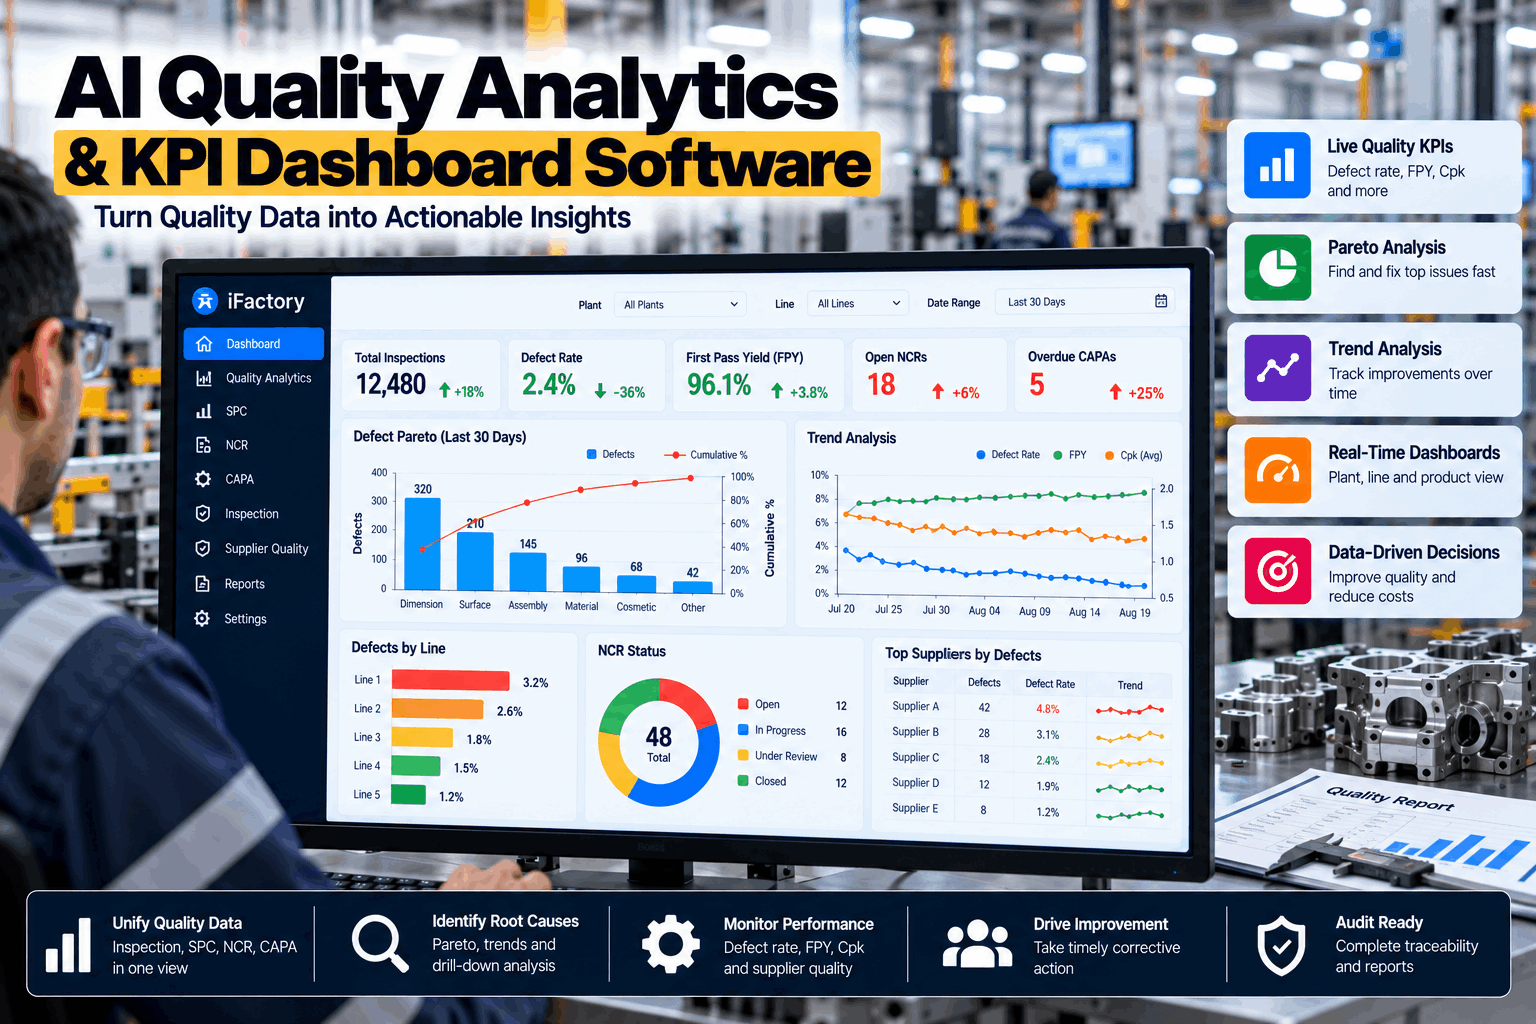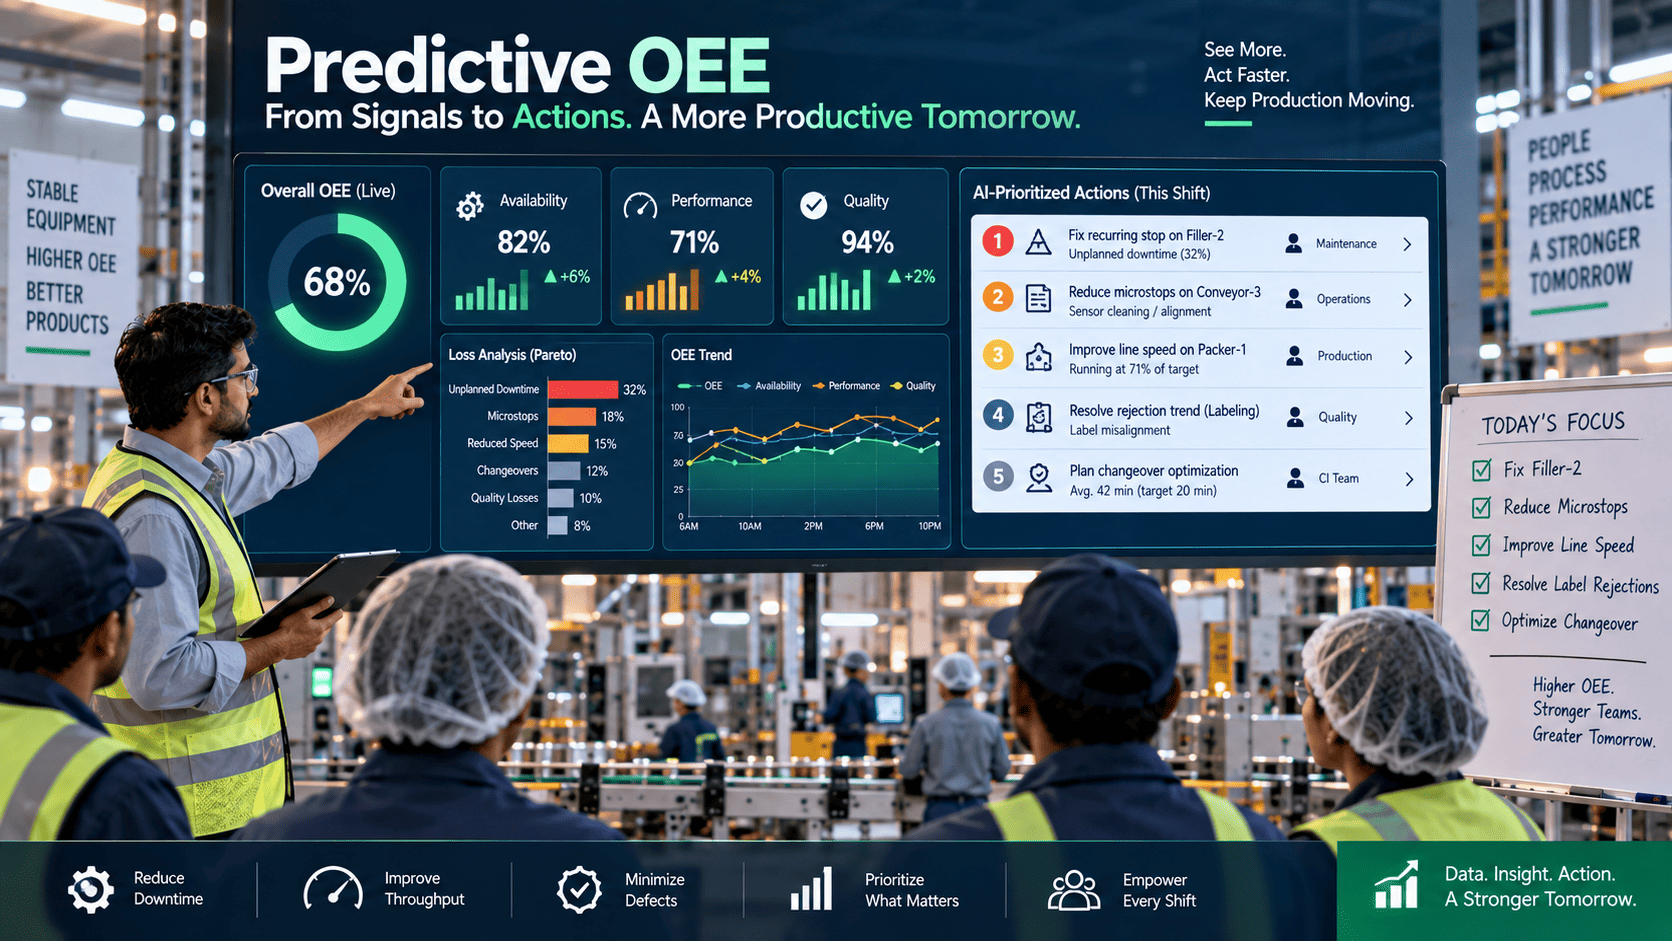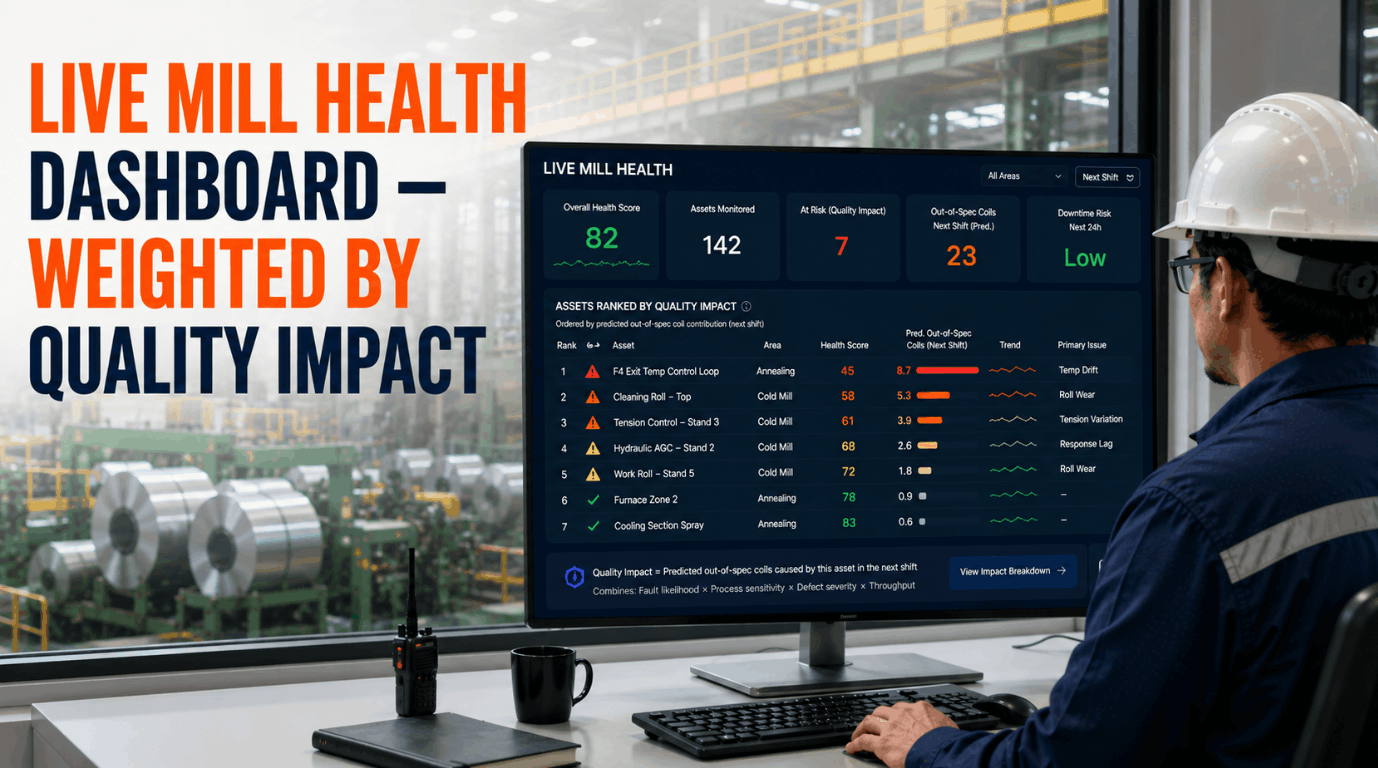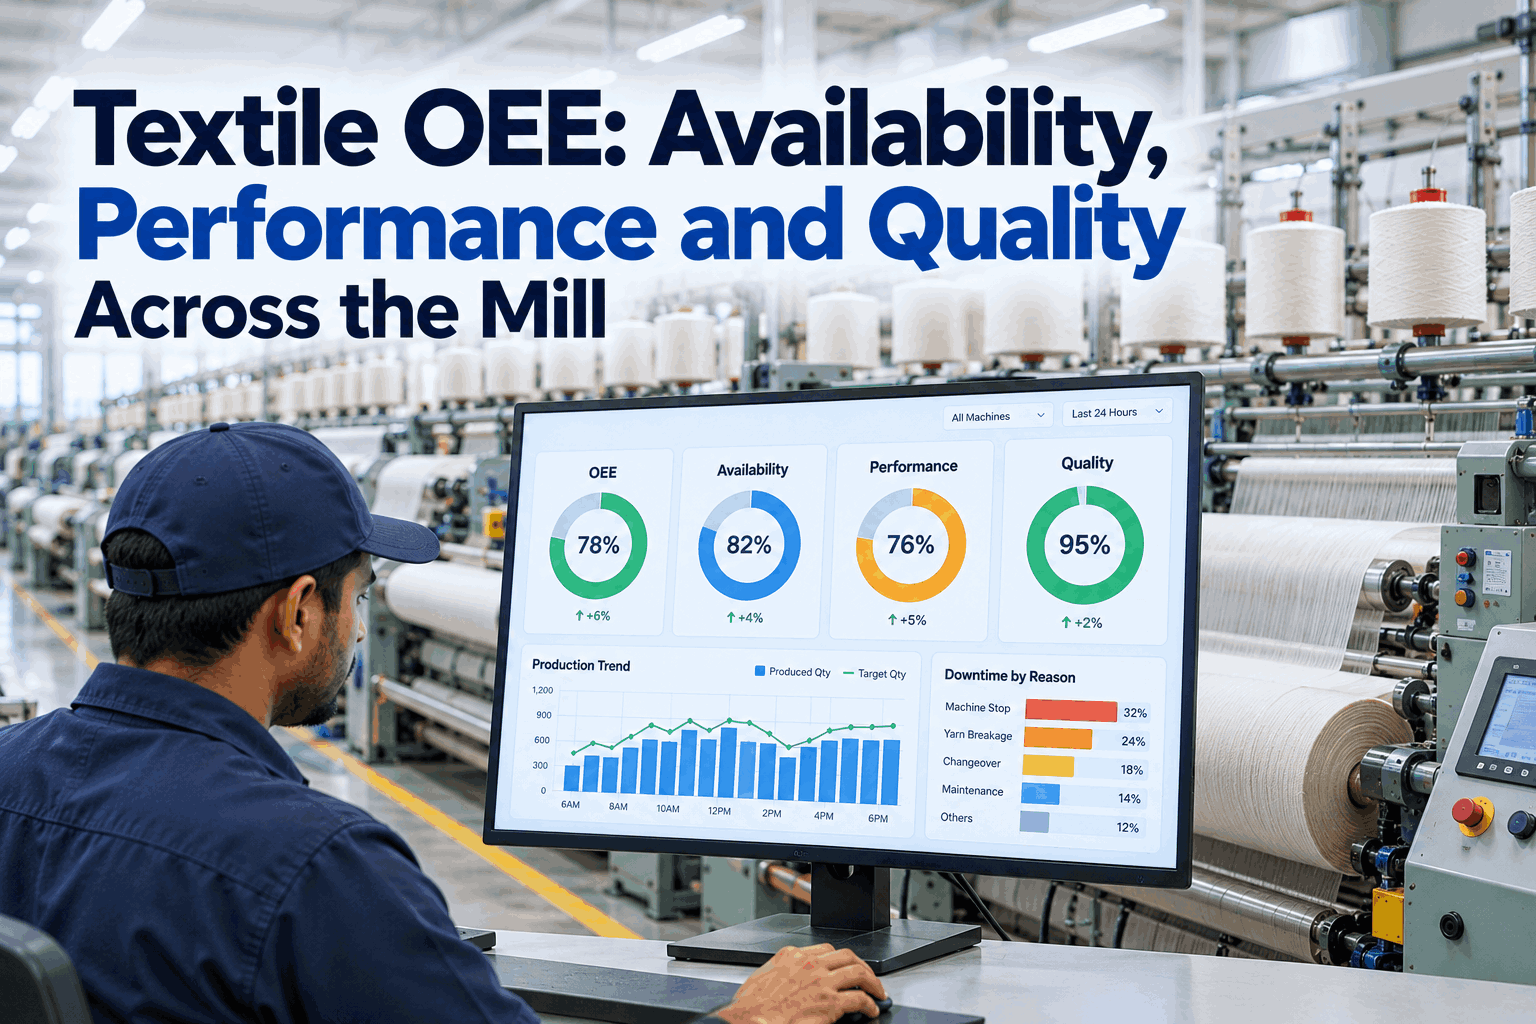
Most textile mills already track efficiency in some form: spindle utilization in spinning, loom efficiency in weaving, machine running percentage in knitting. What they often can't see is why the number is what it is, or how one department's losses ripple into the next. Overall Equipment Effectiveness splits every loss into availability, performance and quality, so the mill can see where its capacity actually goes. You can see it running across a mill in a short live demo.
Textile OEE: See Availability, Performance and Quality From Spinning to Weaving
iFactory calculates OEE for every frame, loom and knitting machine from machine signals and stop reasons. It shows which of the three factors is holding each department back and rolls the picture up to the whole mill.
OEE = Availability × Performance × Quality
OEE multiplies three factors. Availability is the share of planned production time the machine actually ran. Performance is how fast it ran compared with its ideal speed. Quality is the share of output that met specification first time. Because they multiply, a machine that is 90% on each factor has an OEE of about 73%, not 90%. That is why OEE often looks lower than the efficiency figures mills are used to, and also why it is more honest about the capacity still available. The figure of 85% OEE, attributed to Seiichi Nakajima's work on TPM, is often quoted as world class for discrete manufacturing. Treat it as a reference point rather than a textile target. Our support team can help you set realistic targets by department.
Lost to breakdowns, doffing, beam and style changes, waiting for material and other stops.
Lost to running below rated speed, short stops and restarts, and minor idling.
Lost to waste, seconds, re-runs and off-quality yarn or fabric.
The share of planned time spent making good product at full speed.
How Each Factor Is Measured in Spinning, Weaving and Knitting
The formula is the same everywhere, but what counts as running, ideal speed and good output differs by department. Agreeing these definitions up front is the most important step in a textile OEE program, and it is worth involving production, maintenance and quality so that everyone trusts the result. Without it, departments can't be compared and improvements can't be trusted. We can help you agree definitions for each department in a working session.
OEE for One Air-Jet Loom Over a Shift
The example below uses illustrative numbers for an 8-hour shift on one loom. It shows how three factors that each look acceptable multiply into a much lower OEE, and which factor offers the biggest gain. Here availability is the weakest factor, so reducing gaiting time and breakdowns would raise OEE fastest. You can see the same calculation on your own looms in a short demo.
Weaving mills often report loom efficiency, actual picks divided by theoretical picks over the whole time. That number combines availability and performance but leaves out quality. It also hides whether the loss came from long stops or from many short warp and weft breaks. OEE separates them, which points improvement work at the right cause.
See Which Factor Is Holding Each Machine Back
iFactory breaks OEE into availability, performance and quality for every machine and shift, and shows the stop reasons behind each loss, so supervisors know exactly where to act.
Where Textile OEE Actually Goes
TPM groups equipment losses into six categories, two under each OEE factor. In textiles, minor stops such as warp breaks, weft breaks and ends down are often the largest hidden loss, because each one is short but they happen thousands of times a day across a mill. Mapping them to textile events shows mills what to measure and where to look first. Our OEE specialists can help map your stop codes to these losses.
The Main Levers Behind Availability, Performance and Quality
Once OEE shows which factor is weakest, the improvement levers are fairly well known in textiles, and most mills are already working on several of them. The difference between mills is usually whether they can see which lever matters most on which machines. These are the levers worth checking first for each factor. Our OEE specialists can help you prioritize them from your own data.
Rolling OEE Up Without Hiding the Problem
Averaging OEE across hundreds of machines produces a number that moves slowly and explains little. A better mill view weights each machine by its planned time, shows the distribution as well as the average, and highlights the bottleneck department. In a vertically integrated mill, weaving OEE also depends on the beams and yarn coming from upstream, so departments should be read together rather than in isolation. A one-point gain in a constrained process is worth more than a five-point gain where there is spare capacity. You can see the mill roll-up on your own data in a guided demo.
A Simple Daily Routine Around OEE
OEE improves when it is reviewed often and acted on quickly. A short daily routine at each level of the mill keeps attention on the biggest losses while they are still fresh, rather than discussing last month's average in a monthly meeting. You can see this routine supported by live dashboards in a guided session.
Four Ways Textile OEE Numbers Mislead
OEE is easy to calculate and easy to get wrong. These four mistakes are the most common in textile mills, and each one makes the number look better or worse than reality. Once a mill notices a definition problem, trust in the whole program suffers, so it pays to get them right early. Our support team can review your definitions against them.
OEE Software, Machine Connectivity and AI Server in One Package
iFactory delivers textile OEE as a turnkey bundle. A pre-configured NVIDIA AI server ships racked and ready with the software pre-loaded. You rack it, plug in power and Ethernet, and the AI is live. To scope it for your mill, request a turnkey quote.
- Pre-configured NVIDIA AI edge server, racked and ready
- Connectivity to frame, loom and knitting machine controllers
- Stop reason codes mapped to the six big losses
- Cabling and plant network setup
- OEE dashboards by machine, shift, department and mill
- Training for supervisors and managers
- 24×7 remote monitoring
Server installed, machines connected, definitions agreed per department.
OEE checked against manual records on one department, and stop codes refined.
All departments live, mill roll-up on, teams trained.
Textile OEE Software That Explains the Number
iFactory measures OEE from machine signals and links every loss to its cause, from a single loom to the whole mill. Supervisors see their own machines, managers see departments, and leadership sees the mill, all from the same data. Our support team can review your current efficiency reporting before a pilot.
What Textile Managers Ask About OEE
Turn Efficiency Numbers Into Clear Actions
Measure OEE automatically for every machine, split losses into availability, performance and quality, trace each to its cause and see the mill-wide picture. The full system is delivered turnkey and goes live in 6 to 12 weeks.