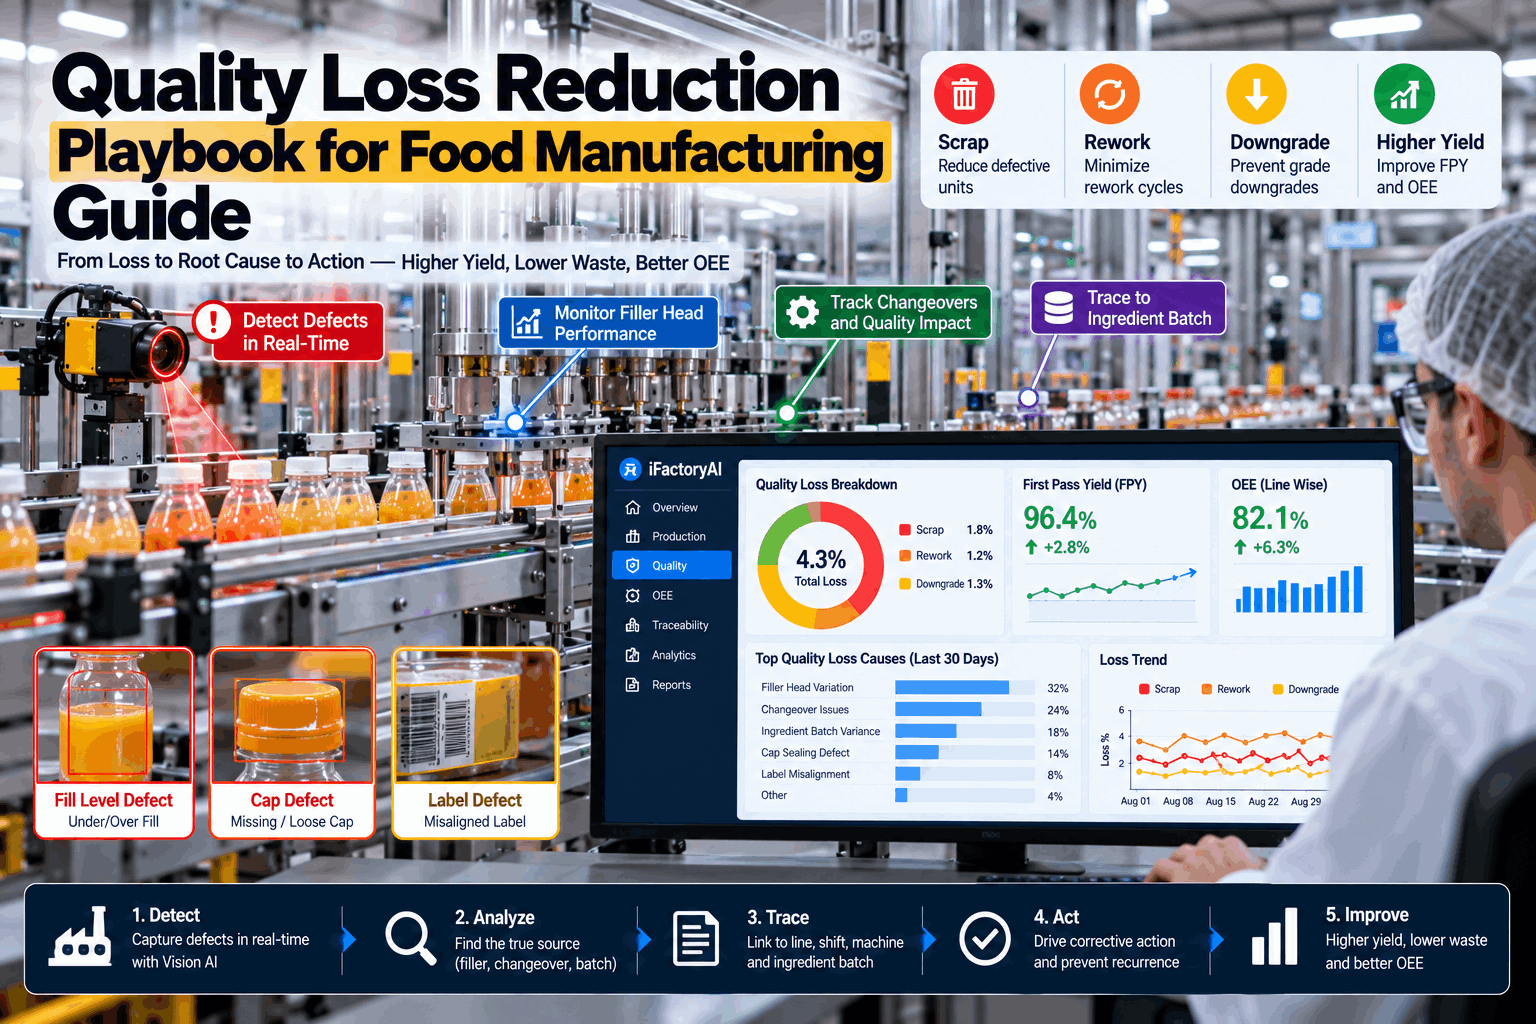
Every food plant knows roughly how much product it loses to quality. Very few can say which filler head, which changeover or which ingredient batch each lost unit came from — and without that, the weekly scrap figure is a number to report, not a problem to solve. This playbook sets out how to count scrap, rework and downgrade properly, put a cost on each unit, and tie every one back to its source, with a worked example on a filling line. iFactory's on-prem AI does the tracing automatically as the line runs. To see it applied to your own rejects, book a loss review.
Trace Every Scrap, Rework and Downgrade Unit Back to Its Cause
A reject bin tells you how much was lost. It does not tell you that one filler head made a third of it, or that a single film lot doubled your seal failures. iFactory reads every reject device on the line, links each unit to the head, changeover and batch that produced it, and ranks the causes by cost — so the quality pillar of OEE becomes a short list of things to fix.
- Scrap, rework and downgrade counted separately, per unit
- Each loss attributed to head, changeover or ingredient batch
- Pareto by cost, refreshed every shift, on a server in your plant
Three Kinds of Quality Loss, Plus One OEE Cannot See
The quality factor in OEE is simple: units that were right first time, divided by units started. The trouble is what plants leave out. Reworked product is often counted as good because it shipped. Downgraded product is counted as good because it sold. Giveaway is not counted at all. A plant reporting 99% quality on that basis can be losing several times more than it thinks. If you are unsure how your own lines count each one, our OEE specialists can review the definitions with you.
Product that cannot be sold or reused
Seal failures, contaminated or damaged packs, start-up product. You lose the ingredients, the packaging and all the conversion cost put in up to the point of rejection.
Product recovered at extra cost
Re-blended, re-melted, re-packed or re-labelled. It ships, but it used the line twice — and it was not right first time, so it does not belong in first pass yield.
Product sold for less
Seconds, staff sales, animal feed, a lower-grade customer. The unit leaves the plant, which hides it from the scrap report, but most of the margin stays behind.
Product given away in every pack
Overfill to stay clear of the legal minimum. Every pack passes inspection, so OEE records no loss — yet a 1.5% overfill on 648,000 packs of 150 g is 1,458 kg of product a week.
Put a Cost on Every Unit — Then Rank by Cost, Not Count
A unit lost after mixing has cost you ingredients. The same unit lost after case packing has cost you ingredients, packaging, energy, labour and line time. Counting rejects treats them as equal; costing them does not, and the ranking changes when you do. The values below are illustrative for one product — your finance team will have the real ones. To build the same schedule for your lines, book a costing session.
Two things move. Code and label rejects are 12% of the units and 2% of the cost, because the pack can be relabelled — they fall from fourth place to last. Fill weight, already the largest by count, is 40% of the cost. Over 50 weeks this one line is losing close to $400,000, and three causes account for nearly 90% of it.
The Core of the Playbook: Three Ways to Attribute a Lost Unit
A reason code says what was wrong with the unit. Attribution says what made it wrong. In food manufacturing almost every quality loss can be tied to one of three things: a position on the machine, an event in time, or a material. Each needs a different piece of data joined to the reject, and each points to a different owner. Our application engineers can check which of these joins your line data already supports.
By filler head, lane or cavity
Data needed: the head or lane index for each pack, carried to the checkweigher and reject devices.
What it shows: one position producing far more rejects than its neighbours.
Usual causes: worn valve seal, blocked nozzle, drifting load cell, damaged sealing jaw.
Owner: maintenanceBy changeover and start-up
Data needed: changeover start and end, product codes, and the time of each reject.
What it shows: losses clustered in the minutes after a restart, varying widely by crew and product pair.
Usual causes: no standard settings, purge too short or too long, temperature not yet stable.
Owner: productionBy ingredient or packaging batch
Data needed: lot genealogy — which ingredient, film or container lot was running when each unit was made.
What it shows: a reject rate that rises and falls with a lot, not with the machine or the crew.
Usual causes: viscosity or solids variation, film gauge or seal-layer variation, supplier change.
Owner: quality and purchasingThe same week, attributed
None of this was visible in the reject bins. The totals said "fill weight, seals and start-up". Attribution says a valve on head 7, a changeover standard that only one crew follows, and a film lot to raise with the supplier.
See Your Own Quality Loss Attributed in Six Weeks
Choose one line. We connect its checkweigher, inspection and reject devices, link each lost unit to head, changeover and batch, and return a Pareto by cost with a named cause behind each of the top five bars.
The Seven Steps, in Order
The method is not complicated; what makes it work is doing the steps in sequence and not skipping the dull ones at the start. Most plants jump to step five with data from step one. For a version adapted to your products and lines, book a playbook session.
Agree one definition of quality loss
Scrap, rework and downgrade each counted, per unit, the same way on every line. Decide now that reworked product is not first pass yield.
Capture at the reject point, automatically
Take the count and the reason straight from the checkweigher, X-ray, vision system and seal tester. Hand tallies miss most of the small losses.
Attach head, time and batch to every unit
Carry the head index down the line, log changeovers as events, and keep lot genealogy current. This is the step that turns a count into a cause.
Cost each category
Use the value added up to the point of loss. Rework gets its recovery cost; downgrade gets the margin given up.
Build the Pareto by cost
Rank causes, not symptoms: "head 7 valve", not "underweight". Review it every shift, not every month.
Fix the top cause, with an owner and a date
One cause at a time. A maintenance job, a changeover standard or a supplier conversation — each belongs to a different team.
Verify on first pass yield, then lock it in
Confirm the bar has shrunk and stayed shrunk for two weeks. Then write the fix into the standard and move to the next bar.
Rework and Downgrade Without Losing Traceability
Rework is where quality loss meets food safety. Product that goes back into the process carries its history with it, and a rework stream that is not controlled can spread an allergen or a contaminated lot across a week of production. Certification schemes expect rework to be identified and traceable, and for foods on the FDA's traceability list the Food Traceability Rule requires lot-level records that can be produced within 24 hours — with compliance now expected from 20 July 2028 after a 30-month extension.
Like into like
Rework returns only to a product with the same allergen profile, within its permitted age and temperature limits, and within a set percentage of the new batch.
Genealogy both ways
Every rework addition is recorded against the source lot and the receiving lot, so a recall can be scoped forward and back without assuming the worst.
Rework is still a loss
Each kilo recovered is logged with its cause, the same as scrap. A plant that reworks freely has a hidden factory running inside its visible one.
Traceability also limits the worst case. A widely cited industry study put the average direct cost of a food recall at $10 million before brand damage — and how much product has to come back depends on how precisely the records can draw the boundary.
How iFactory Runs the Playbook for You
Steps two to five are data work, and they are the ones that lapse when people are busy. iFactory does them continuously on an NVIDIA AI server in the plant, and adds a predictive layer so some losses are caught before the reject. Ask our support engineers for a walkthrough on live line data.
- Reads every reject device. Checkweigher, X-ray, metal detector, vision and seal tester results are captured per unit with reason and time.
- Joins head, changeover and lot. Each lost unit is linked to its position, the last changeover and the ingredient and packaging lots in use.
- Keeps the Pareto by cost current. Ranked by cause and refreshed through the shift, with the owner shown.
- Predicts drift. Fill weight per head, seal temperature and pressure are watched for the trend that comes before rejects begin.
Delivered as a Turnkey AI System — Hardware and Software Together
iFactory ships as a complete bundle: a pre-configured NVIDIA AI server, racked and ready, with the OEE engine, attribution models and dashboards pre-loaded. Rack it, plug in power and Ethernet, and the AI is live on your plant network. Our team handles cabling, network setup, PLC and SCADA integration, connections to inspection devices, operator training and 24×7 remote monitoring. For a scoped proposal, book a deployment call.
Ship, network and data
Server delivered and racked. Filler, checkweigher, inspection and reject devices connected. Loss definitions, reason codes and unit costs agreed with quality and finance.
Model training and pilot
Head, changeover and lot joins validated on the pilot line. Drift models trained on your own fill and seal data. First attributed Pareto reviewed with the team.
Go-live and training
All lines live. Supervisors, quality and maintenance trained on the shift review, with owners assigned for each cause type.
Frequently Asked Questions
What counts as quality loss in OEE for a food plant?
Any unit that was not right first time: scrap, rework and downgrade. The quality factor is good first-time units divided by units started. Many plants count reworked or downgraded product as good because it was eventually sold, which overstates quality and hides the cost of making it twice or selling it cheap.
What is a good first pass yield on a food line?
It depends heavily on the product and process, so a single target misleads. As context, a 2026 benchmark puts median OEE for food and beverage lines at 62% and world-class at 85%, and world-class OEE is conventionally built on a quality rate of 99% or better. The useful comparison is your own line against its best week.
Why rank quality losses by cost instead of by count?
Because units are not equal. A pack lost after case packing carries far more cost than product lost after mixing, and a relabelled pack costs a fraction of a scrapped one. In the worked example, code and label rejects are 12% of units but 2% of cost — ranking by count would send effort to the wrong place.
How do you link a reject to a specific filler head?
The filler knows which head filled each pack. That index is carried down the line by tracking pack position from filler to checkweigher and reject device, using the line's own encoder and timing signals. Once every reject has a head number, an under-performing head stands out within a shift.
Is giveaway a quality loss?
It is a material loss that the OEE quality factor does not record, because every overfilled pack passes inspection. It should be tracked beside quality loss, since the same fill-weight variation drives both: a head that scatters widely forces a higher target, which raises giveaway on every pack it fills.
Do we need new inspection equipment?
Usually not. Most lines already have a checkweigher, metal detection or X-ray, and code or seal inspection. iFactory connects to those devices and the filler's controller. New sensors are suggested only where a significant loss has no measurement at all.
How long does deployment take, and what do we need to provide?
A typical plant is live in 6–12 weeks. You provide rack space, power, an Ethernet connection, access to line controllers and inspection devices, your reason codes and unit costs, and a quality lead. iFactory supplies the pre-configured NVIDIA AI server, software, integration and training. To scope your plant, contact our scoping team.
Turn the Reject Bin Into a To-Do List
One turnkey system — NVIDIA AI server, OEE and quality software, integration and training — delivered and live inside 12 weeks. Start with the line that fills your rework area fastest.
- 1Which head, lane or cavity made it?
- 2How long after the last changeover?
- 3Which ingredient and packaging lots were running?