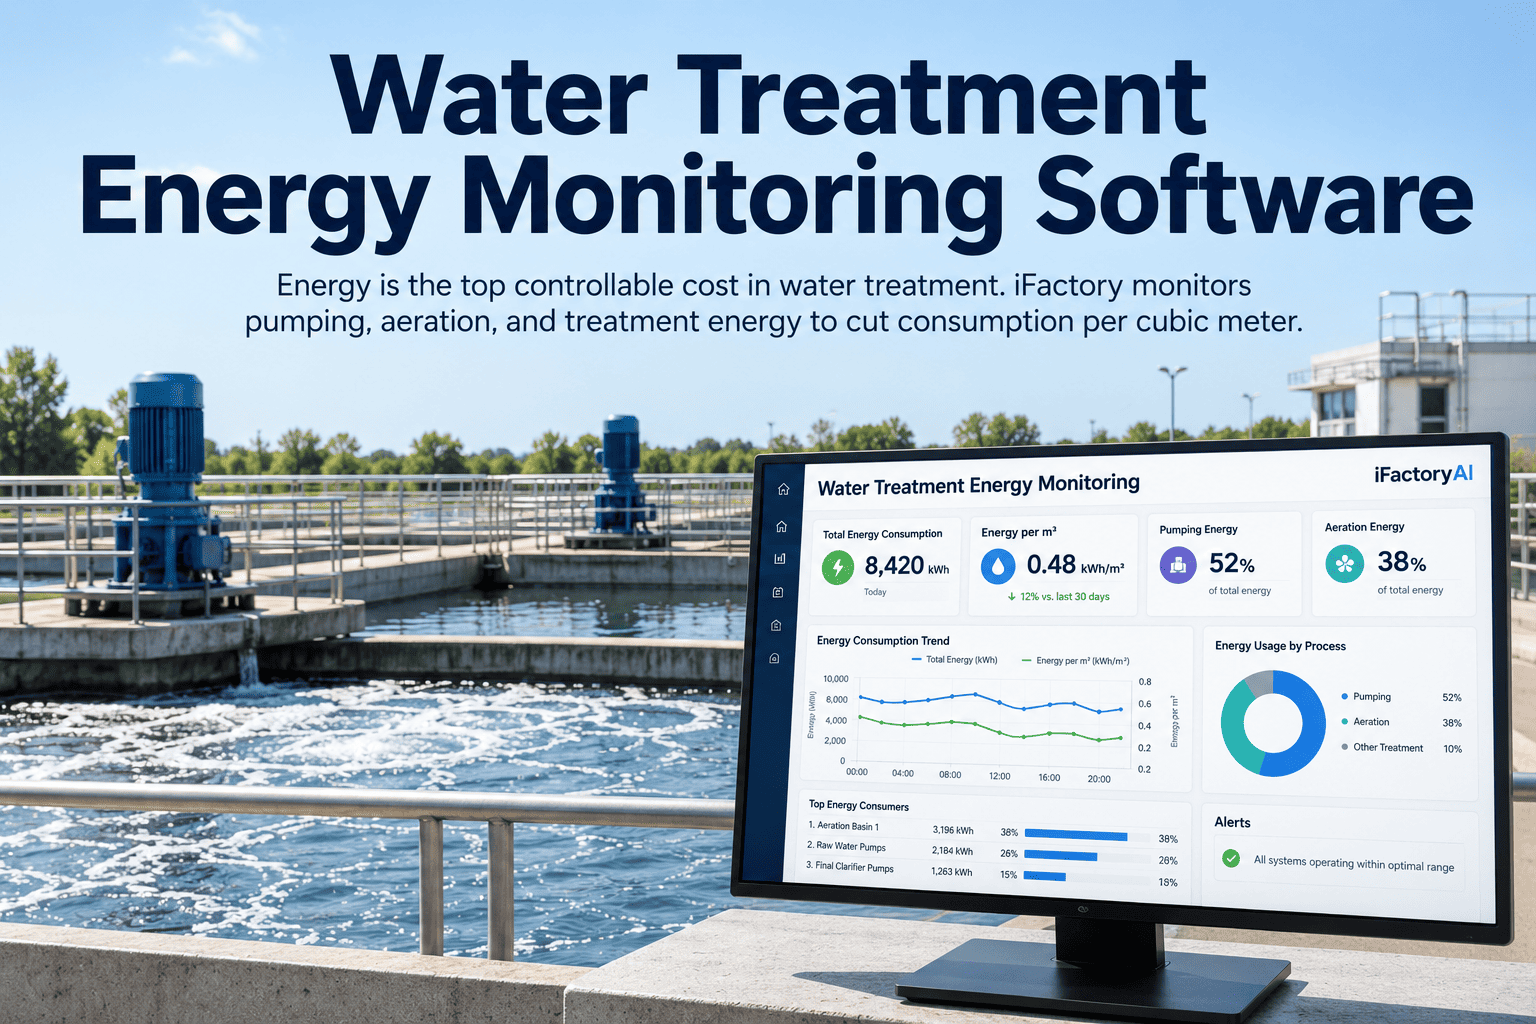
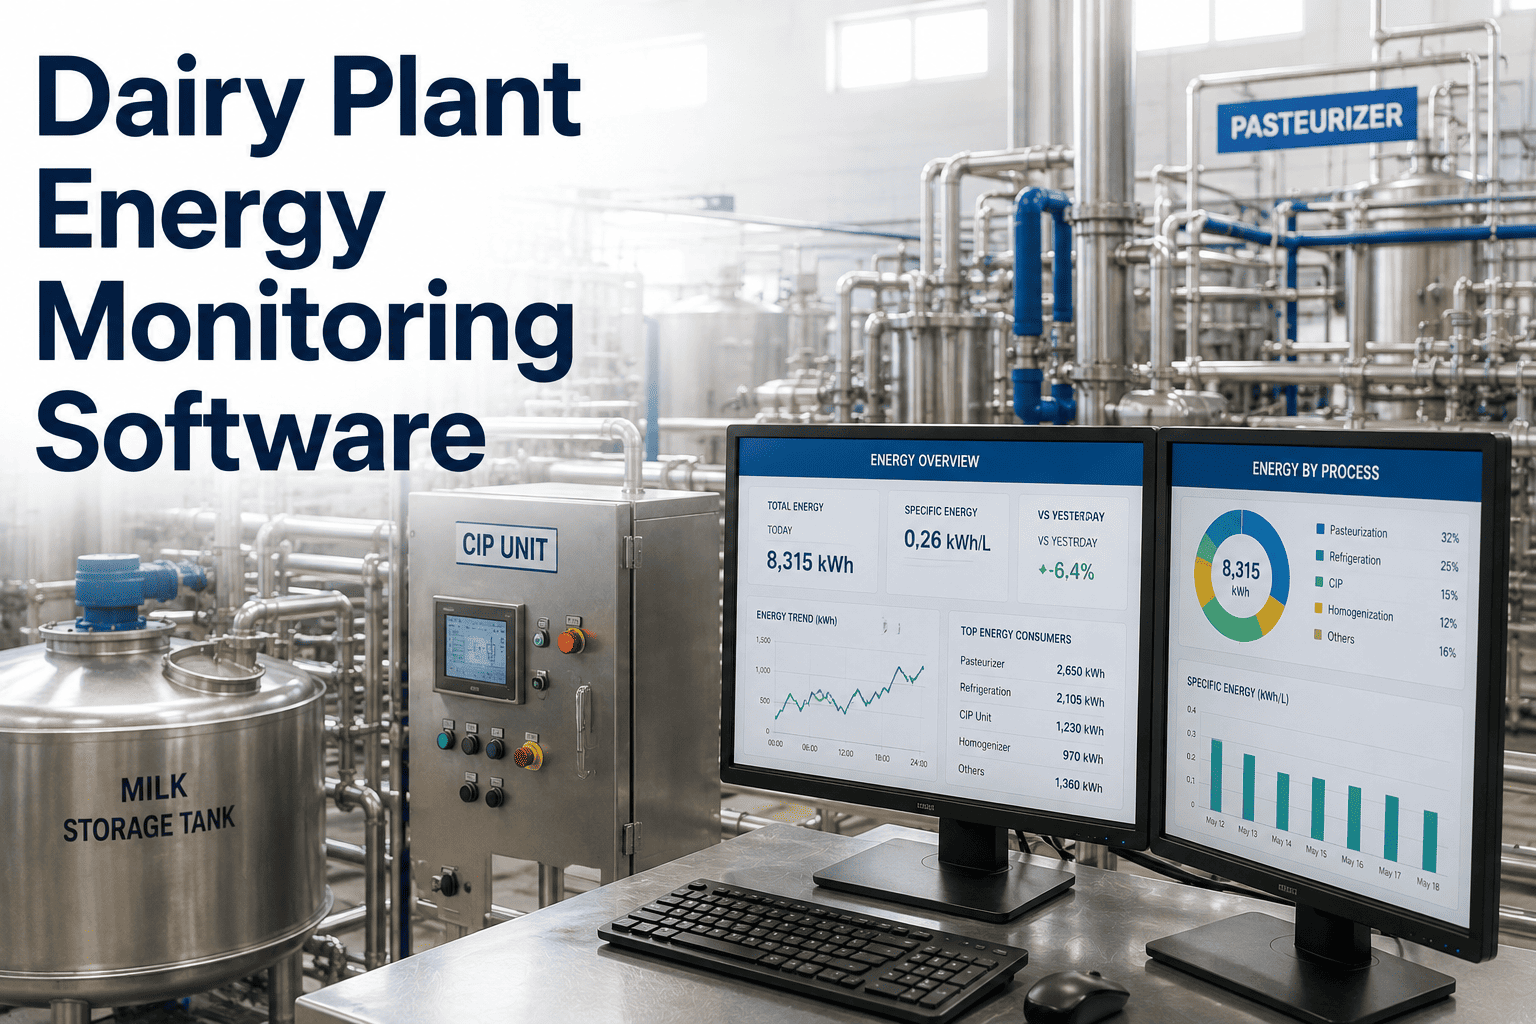
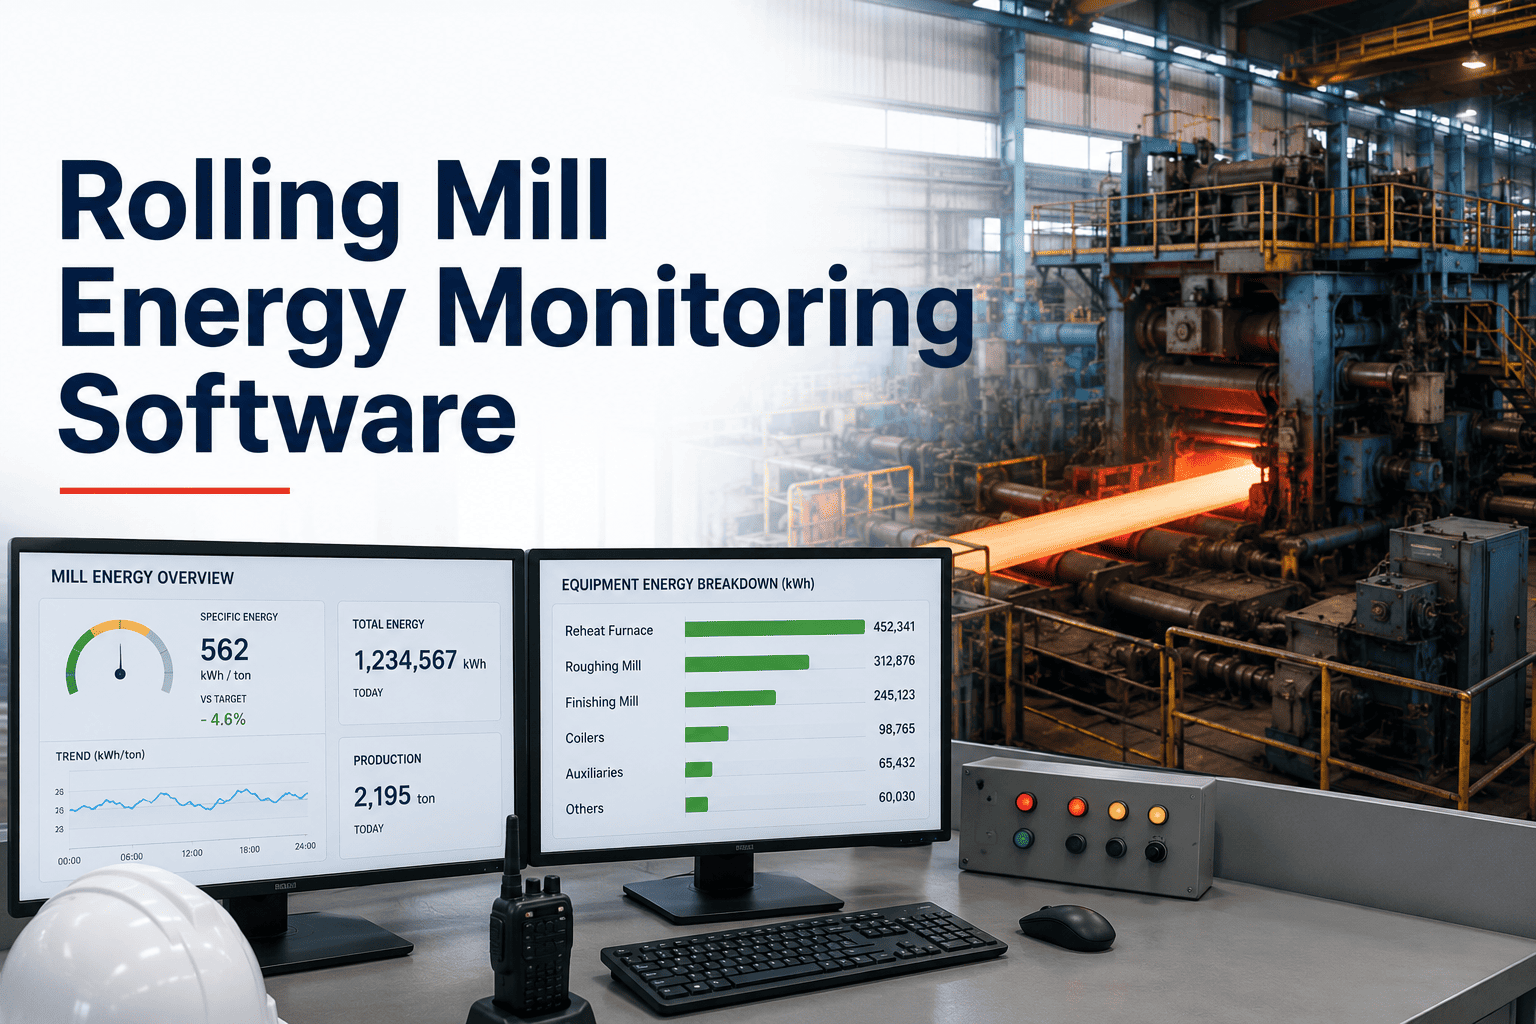
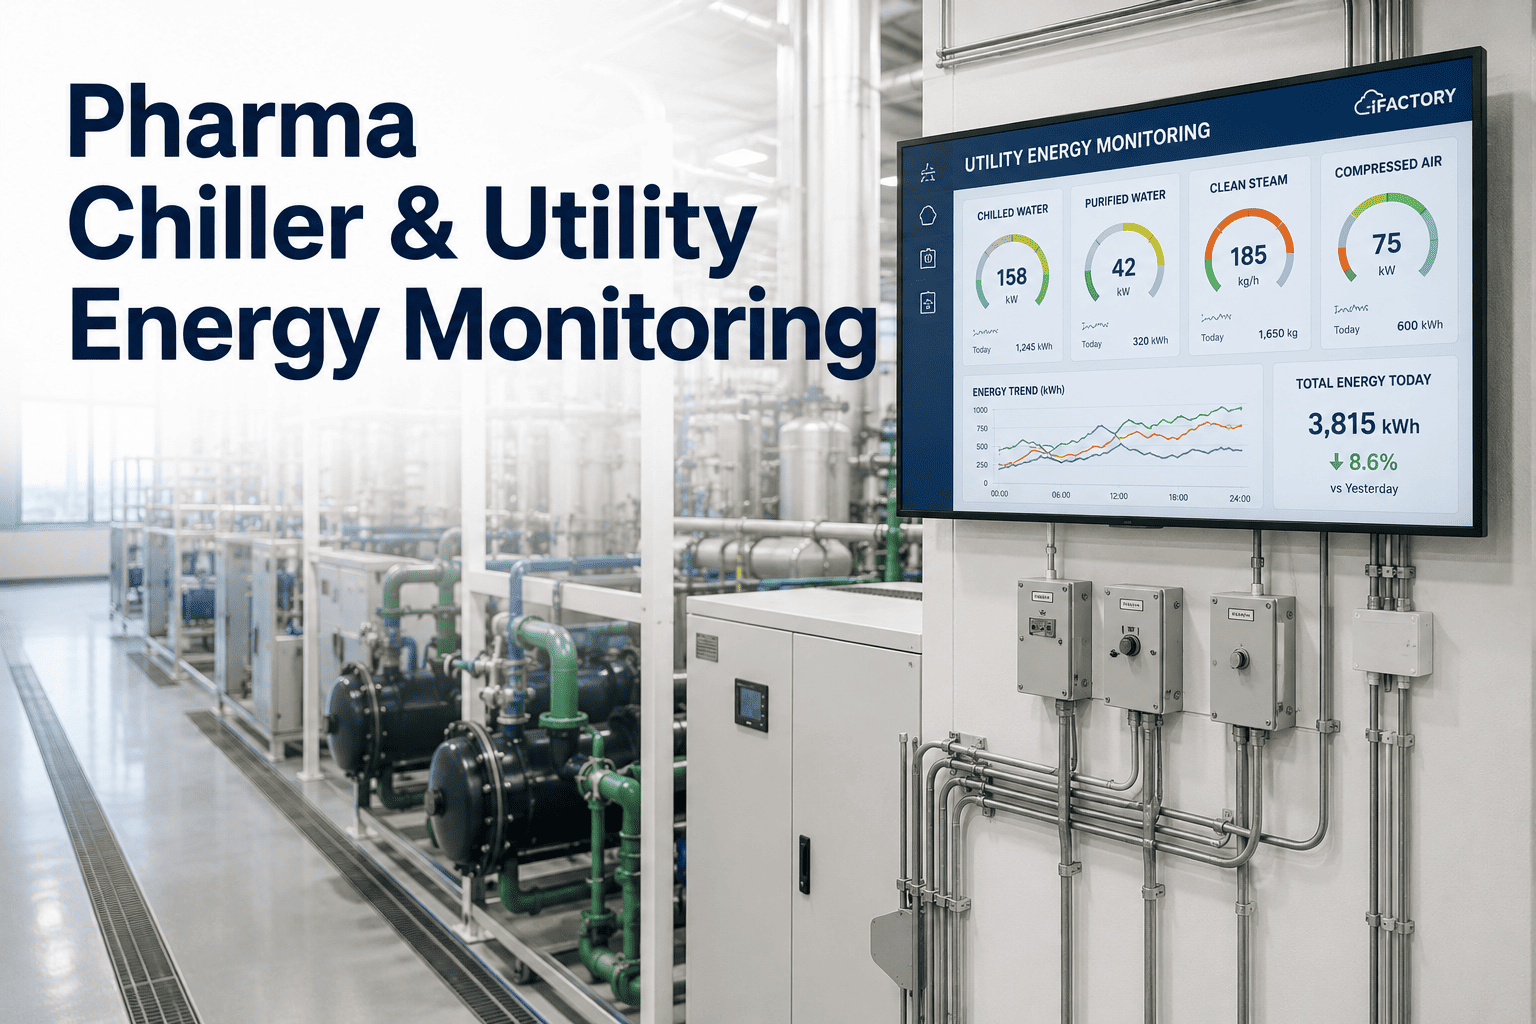
Energy is the largest controllable cost in a water or wastewater plant — and in most utilities, electricity alone accounts for around 20 to 40% of operating expenditure. Two systems drive nearly all of it: aeration in activated sludge, which typically consumes 40 to 60% of a wastewater plant's total electricity, and pumping, which dominates in drinking water plants where it can reach 70 to 90% of load. The kWh per cubic meter that leaves your plant is a KPI you can move — but only if you can see it live, by process area, per shift. A single aeration optimization project at one municipal utility captured $775,000 in first-year electricity savings, purely from tuning blower output to real dissolved oxygen demand. iFactory water and wastewater energy monitoring tracks kWh/m³ across pumping, aeration, and treatment stages, flags the drift that turns into your monthly power bill, and puts the savings levers in front of you — on-prem, live in 6 to 12 weeks.
iFactory Process Energy Analytics
Water Treatment Energy Monitoring, Live by Process Area
Track kWh per cubic meter across pumping, aeration, dewatering, and treatment stages. Cut electricity — your largest controllable cost — and hit sustainability targets with process-level visibility, running on a single on-prem server.
20-40%
of utility opex is electricity
40-60%
of plant load is aeration
kWh/m³
tracked live by process
6-12wk
to go-live, on-prem
Where Every kWh Goes in a Wastewater Plant
You cannot cut what you cannot see. In a typical activated-sludge wastewater plant, four systems consume nearly all the electricity — and their shares are lopsided. Aeration alone is the largest single lever. Optimize it and the plant bill moves; optimize anything else first and you leave the majority of the saving on the table.
Aeration — the single largest lever in an activated-sludge plant
Pumping — dominant in drinking water plants, 70-90% of load
Dewatering — sludge handling, centrifuges, belt presses
Other — mixers, lighting, control systems, HVAC
The KPI That Moves Your Bill: kWh per Cubic Meter
Every plant has one number that determines its power bill more than any other — the electricity used to treat a cubic meter of water. Small plants sit high, large plants gain scale, and the technology choice moves the range wider. Knowing where you sit against the benchmark is the first step to knowing what's possible.
Efficient large WWTP
0.26kWh/m³
Well-optimized large activated-sludge plants with fine-bubble diffusers, VFD blowers, and tight DO control. The low end of the industry benchmark.
Typical WWTP
0.5-0.8kWh/m³
Most municipal wastewater plants operate in this band. Aeration and pumping together account for the majority of the load, with clear optimization headroom in both.
High-load or advanced
1.0-2.0kWh/m³
Plants with nutrient removal, MBR technology, or small scale. Higher intensity is expected — but process-level visibility still exposes drift and waste.
Where the Savings Actually Hide
The kWh/m³ number moves when specific process variables move. Four levers matter more than the rest — each accounts for a meaningful share of avoidable consumption in a typical plant, and each is invisible without live process-level monitoring.
Lever 01
Dissolved Oxygen Setpoint
Blowers running to a fixed high DO setpoint waste power the plant doesn't need. Load-following DO control matched to real influent BOD is one of the largest single savings in any aeration system.
Lever 02
Pump VFD Optimization
Constant-speed pumps running against varying flow demand waste energy across the curve. Variable frequency drive tuning matched to live flow saves significant kWh, especially on raw water intake pumps.
Lever 03
Blower Turndown
Blowers oversized for peak demand run inefficiently at partial load. Correct sequencing and turndown control to actual air demand recovers energy lost to running at fixed high output.
Lever 04
Peak Demand Shifting
Utility tariffs charge premium rates during peak hours. Shifting non-critical loads — dewatering, sludge handling, off-line pumping — to off-peak windows reduces the demand charge component of the bill.
Want to see which of these levers is worth the most in your plant right now? Book a demo and we'll benchmark your kWh/m³ against live process monitoring.
What iFactory Actually Measures
Meter-level totals on the monthly bill are a rear-view mirror. Live process-level monitoring is a control panel. iFactory captures energy consumption at each major process area continuously, correlates it to flow, load, and setpoints, and turns the utility bill into a set of actionable levers.
Aeration Energy per m³
Blower kW correlated with DO setpoint, air flow, and influent BOD load — the aeration bill broken down by what's driving it, not just totaled at the meter.
Pumping Energy per m³
Raw water, intermediate, and effluent pumps monitored against flow — energy per cubic meter tracked separately for each stage of pumping.
Load-Based Efficiency
kWh per kg BOD or COD removed — the load-based benchmark that captures treatment efficiency independent of flow variation from stormwater or infiltration.
Peak Demand Tracking
Live demand profile flagged against the tariff structure — the plant sees peak charges accumulating in real time instead of discovering them on the invoice.
From Energy Anomaly to Action
The value is not in knowing the plant used more energy last month. It's in knowing which pump, which blower, which shift, drove the increase — and doing something about it before the next month compounds it. iFactory closes the loop from anomaly to corrective action inside the operating cycle.
1
Detect the Drift
kWh/m³ on a process area rises above baseline — the anomaly is flagged the shift it happens, not on next month's report.
2
Isolate the Cause
Automatic correlation to DO setpoints, flow, blower output, and pump duty tells you whether the drift is a setpoint, a mechanical issue, or a control loop tuning problem.
3
Recommend the Fix
AI suggests the specific setpoint change, VFD adjustment, or load-shift — the operator gets a specific lever, not a generic energy report.
4
Confirm the Saving
Live kWh/m³ confirms consumption returned to baseline — the fix is verified rather than assumed, and the saving is booked.
Why Live Beats Monthly Billing Review
Most utility energy management still runs on the monthly bill and a spreadsheet — a snapshot that arrives too late to change anything. Continuous, process-level monitoring is a different discipline: it turns energy from a fixed cost you pay into a variable cost you manage.
Monthly bill review
A Rear-View Mirror
Totals arrive weeks after the consumption happened
No breakdown by process area — aeration versus pumping is guessed
Peak demand charges discovered on the invoice, not in the moment
Drift compounds for a full billing cycle before anyone reacts
iFactory live monitoring
A Control Panel
Process-level kWh/m³ updated continuously, by shift
Aeration, pumping, dewatering broken out and compared to baseline
Peak demand accumulation visible in real time, not in retrospect
Drift flagged in-shift with a specific lever to correct it
The Money on the Table
Water and sewerage together consume around 40% of urban electricity in most cities — the utility sector is one of the largest energy customers in the country. Every kWh saved is direct, recurring margin, and single well-scoped aeration and pumping projects have historically recovered six- and seven-figure annual savings.
20-40%
of opex
electricity's typical share of water utility operating cost
40%
of urban energy
water and sewerage sector share of city electricity use
$775K
first-year saving
one MCES aeration optimization project delivered this in year one
60-100%
demand growth
municipal water energy use projected to rise over the next 15 years
On-Prem AI, Live in 6 to 12 Weeks
Plant telemetry, flow data, and process setpoints are core utility IP. The iFactory AI runs on a pre-configured edge server on-premise, with all processing inside your firewall and no external egress required to operate. It ships racked and ready with the software pre-loaded — and a structured deployment puts it live on your plant in a single quarter.
1
Rack the edge server
A pre-configured edge AI server slots into your plant, shipped pre-validated with the energy monitoring and process analytics software pre-loaded.
2
Connect SCADA and meters
Read-only links to SCADA, sub-meters, VFDs, blowers, and flow instruments let the AI learn each process area's baseline kWh/m³.
3
Energy board goes live
Live kWh/m³ by process, anomaly alerts, and savings recommendations run on-prem inside your firewall — your telemetry never leaves the plant.
What Live Energy Monitoring Delivers
Continuous, process-level monitoring converts directly into lower kWh/m³, contained peak demand, and measurable margin returned to the utility. These reflect outcomes water and wastewater plants report after moving from monthly bill review to live process energy analytics.
Cut
kWh per m³
specific energy consumption reduced across pumping and aeration
Live
Anomaly detection
drift flagged in-shift before it compounds into the next bill
Lower
Peak demand
non-critical loads shifted off the utility tariff peak window
Auditable
Sustainability KPI
verifiable kWh/m³ reporting for ESG and regulator submissions
Curious what your true kWh/m³ looks like broken out by process area? Talk to our energy team and benchmark your plant against live AI monitoring.
Frequently Asked Questions
Why is kWh per cubic meter the right KPI to focus on?
kWh/m³ normalizes energy consumption against the volume actually treated, so plants of different sizes and different flow days can be compared meaningfully. It's the most widely used specific energy consumption indicator in water and wastewater, and it maps directly to the utility bill: cut kWh/m³ and the total power bill falls in proportion to the treated volume. For wastewater specifically, kWh per kg BOD or COD removed is a useful companion metric because it isolates treatment efficiency from stormwater and infiltration effects.
Which process should we optimize first?
In an activated-sludge wastewater plant, aeration is almost always the biggest single lever — it typically accounts for 40 to 60% of total electricity use, and dissolved oxygen setpoint control alone can capture significant savings. In a drinking water plant, pumping dominates at 70 to 90% of load, so VFD tuning on raw water and distribution pumps is the fastest path. Live process-level monitoring tells you which lever is worth the most in your specific plant instead of relying on industry averages.
Won't monthly bill review catch big anomalies?
It will catch them — after they've already run for a full billing cycle. By then, the cause may have moved on, the operator who was on that shift may not remember the event, and the peak demand charge is already booked on the invoice. Live monitoring flags drift the shift it starts, correlates it to specific process variables, and lets the operator act before the next shift compounds the loss. That timing gap is the difference between an anomaly and a saving.
How does this help with ESG and sustainability reporting?
Continuous, process-level kWh/m³ data creates an auditable record of specific energy consumption and its reduction over time — the exact evidence sustainability disclosures and regulator submissions require. Instead of assembling numbers from monthly bills and flow reports once a year, the plant has a live, verifiable KPI trend with a clear methodology behind it. That makes reporting faster, defensible, and comparable year over year.
Does our SCADA and telemetry data leave the plant, and how long to deploy?
No data leaves. The AI runs on a pre-configured edge server on-premise, with all processing inside your firewall and no external egress, and the integration is read-only from SCADA and sub-meter feeds. The server ships racked and ready with software pre-loaded, and a structured deployment puts the live energy board on your plant in 6 to 12 weeks. The fastest way to see fit is a demo on your own SCADA data — book one and bring your current kWh/m³ trend and a recent utility bill.
Cut Your Largest Controllable Cost.
See Your Plant's kWh/m³ Broken Out by Process
Bring your current kWh/m³ trend and a recent utility bill. We'll show live monitoring of aeration, pumping, and dewatering energy per cubic meter, with anomaly detection and the specific savings levers your plant should act on — all on an on-prem server, live in 6 to 12 weeks.