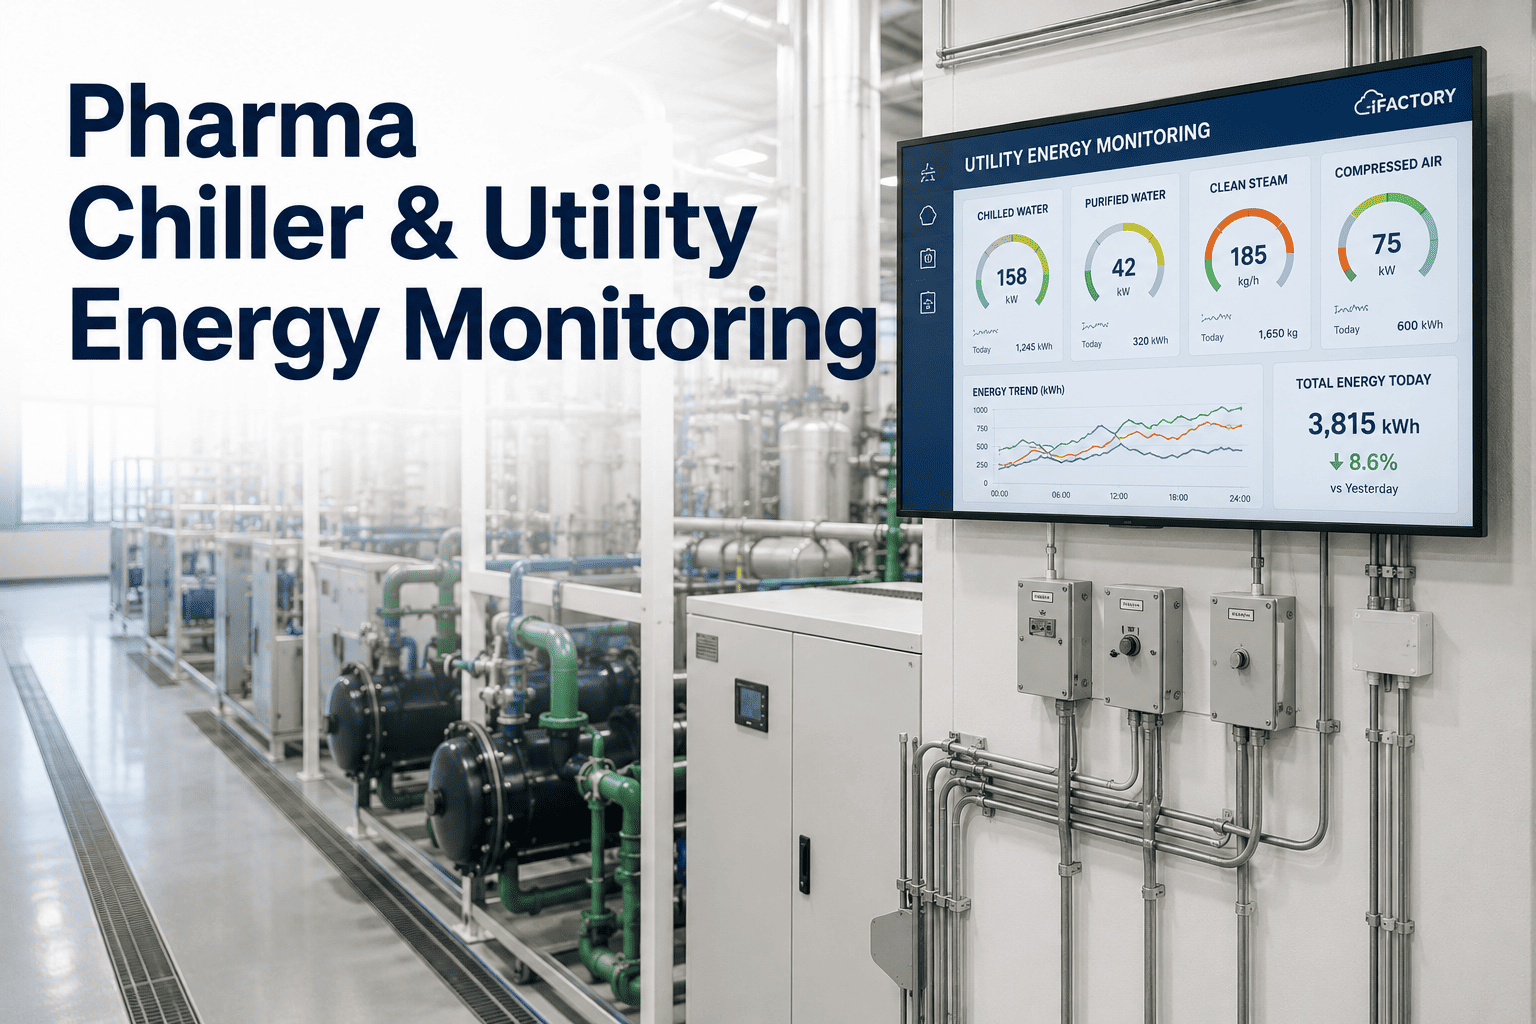
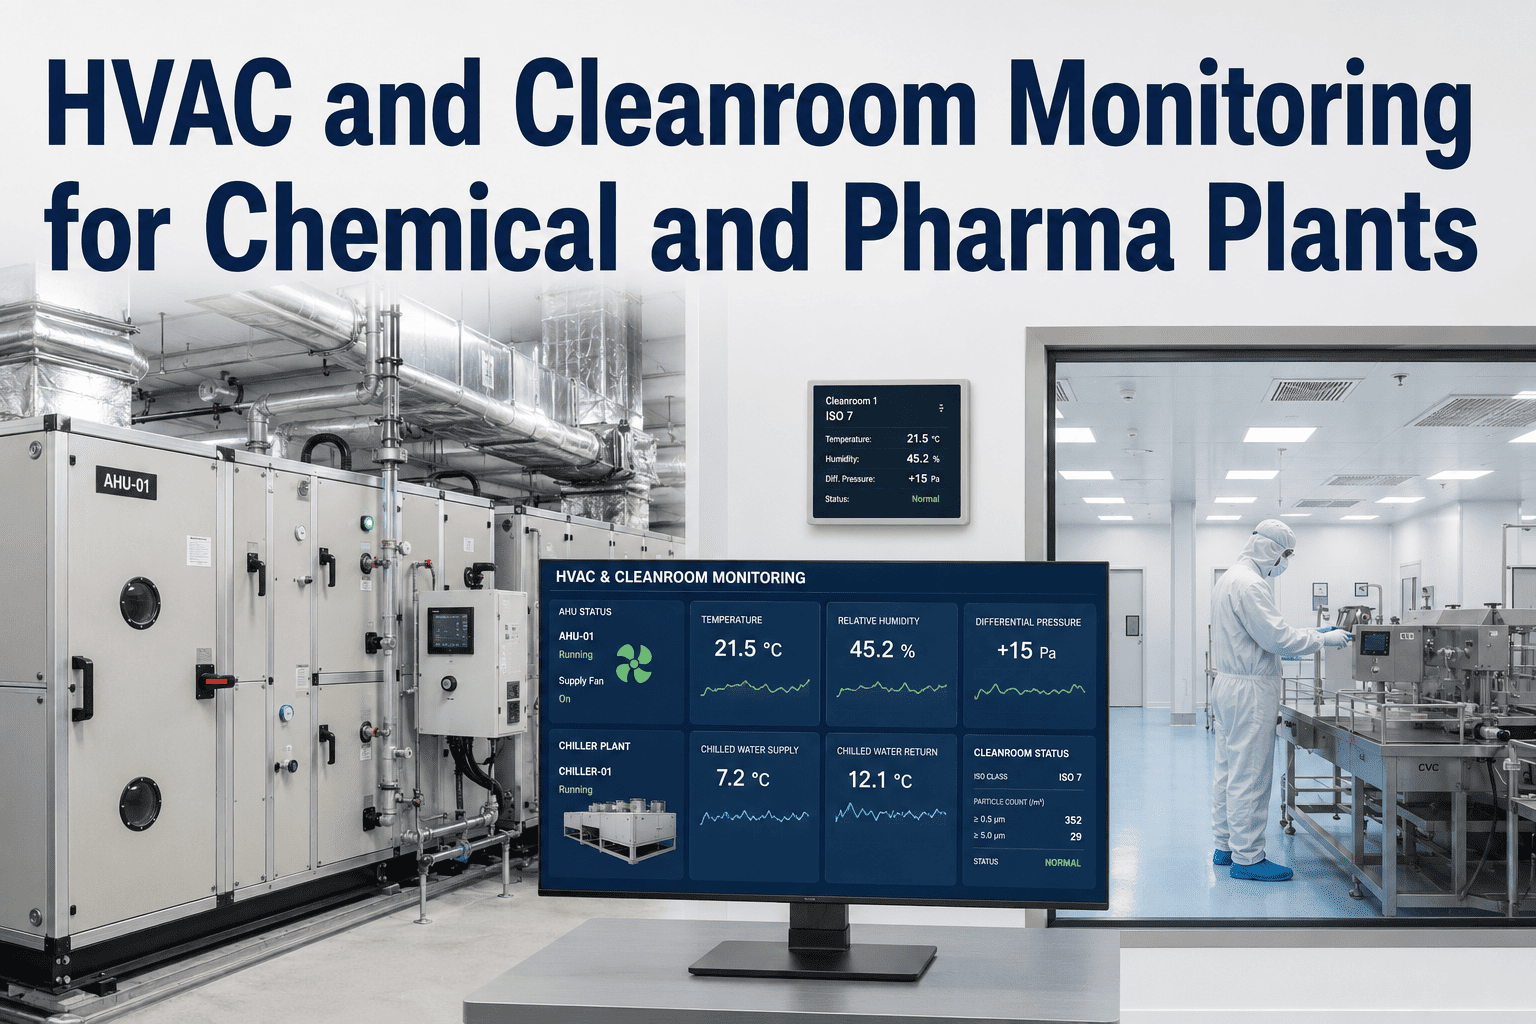
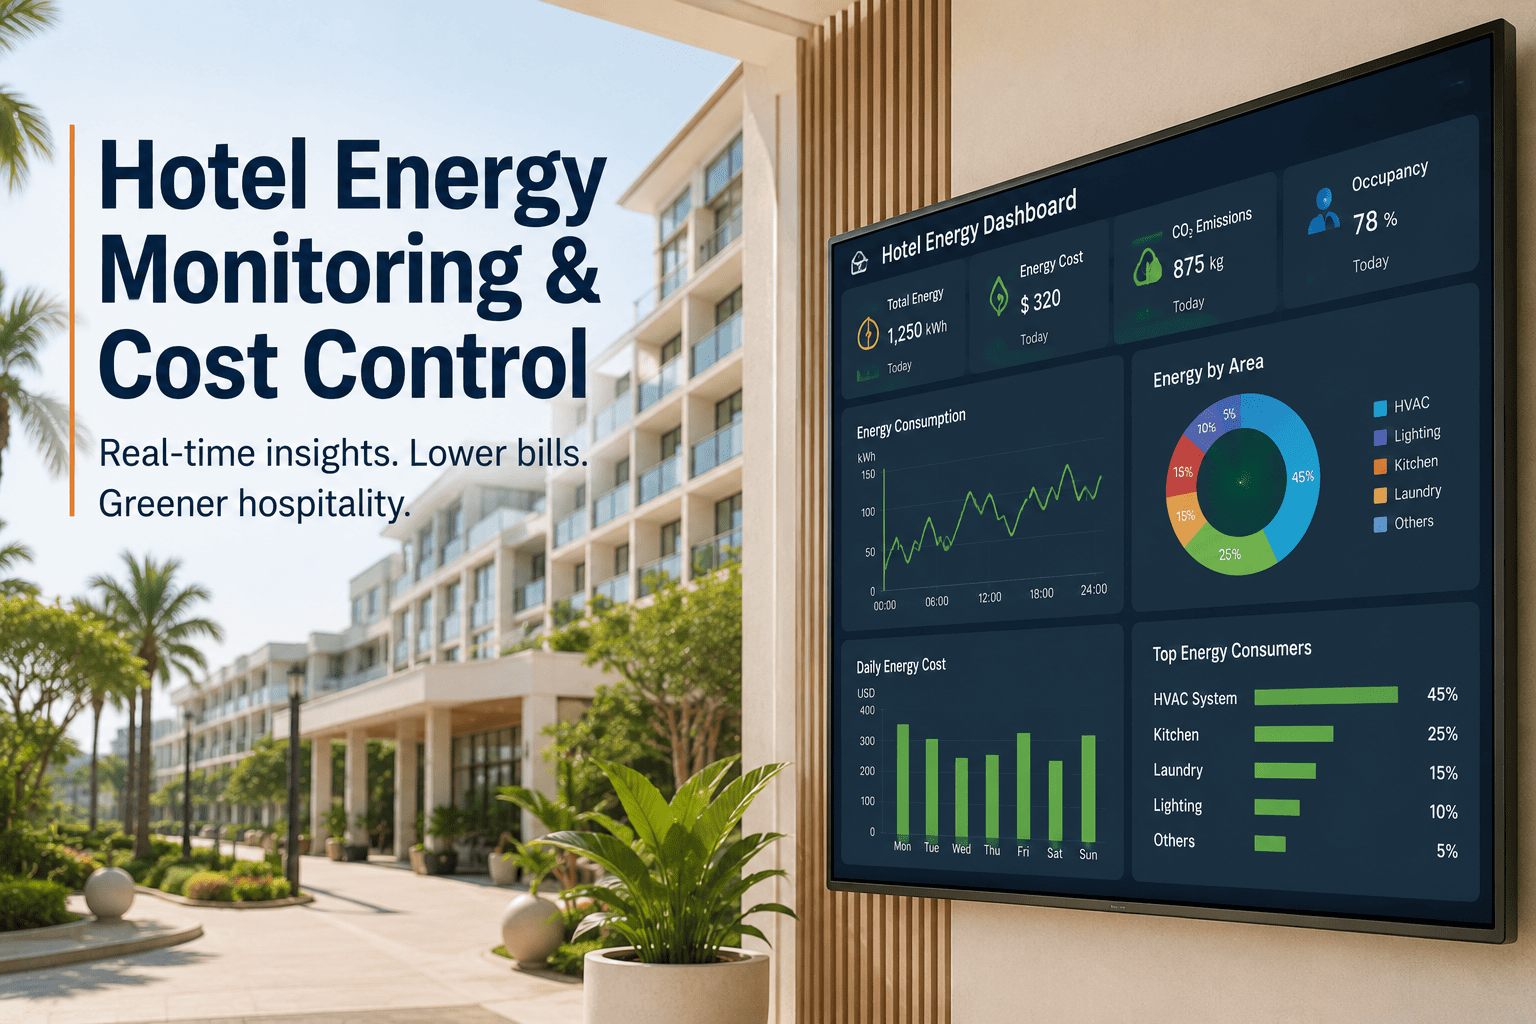
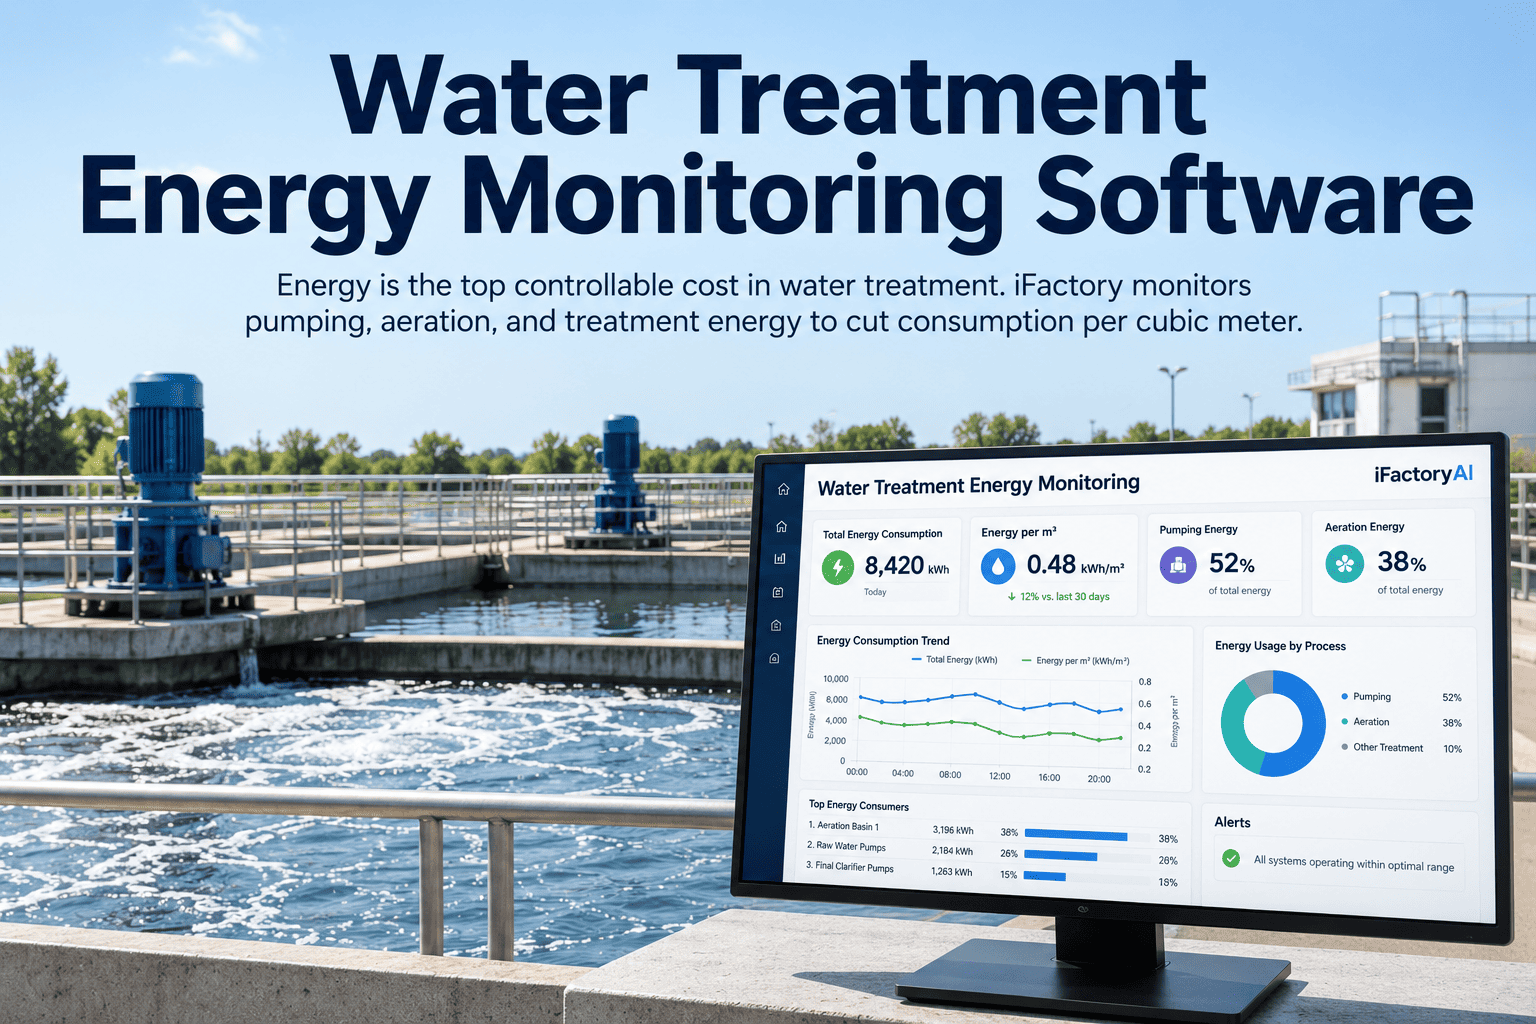
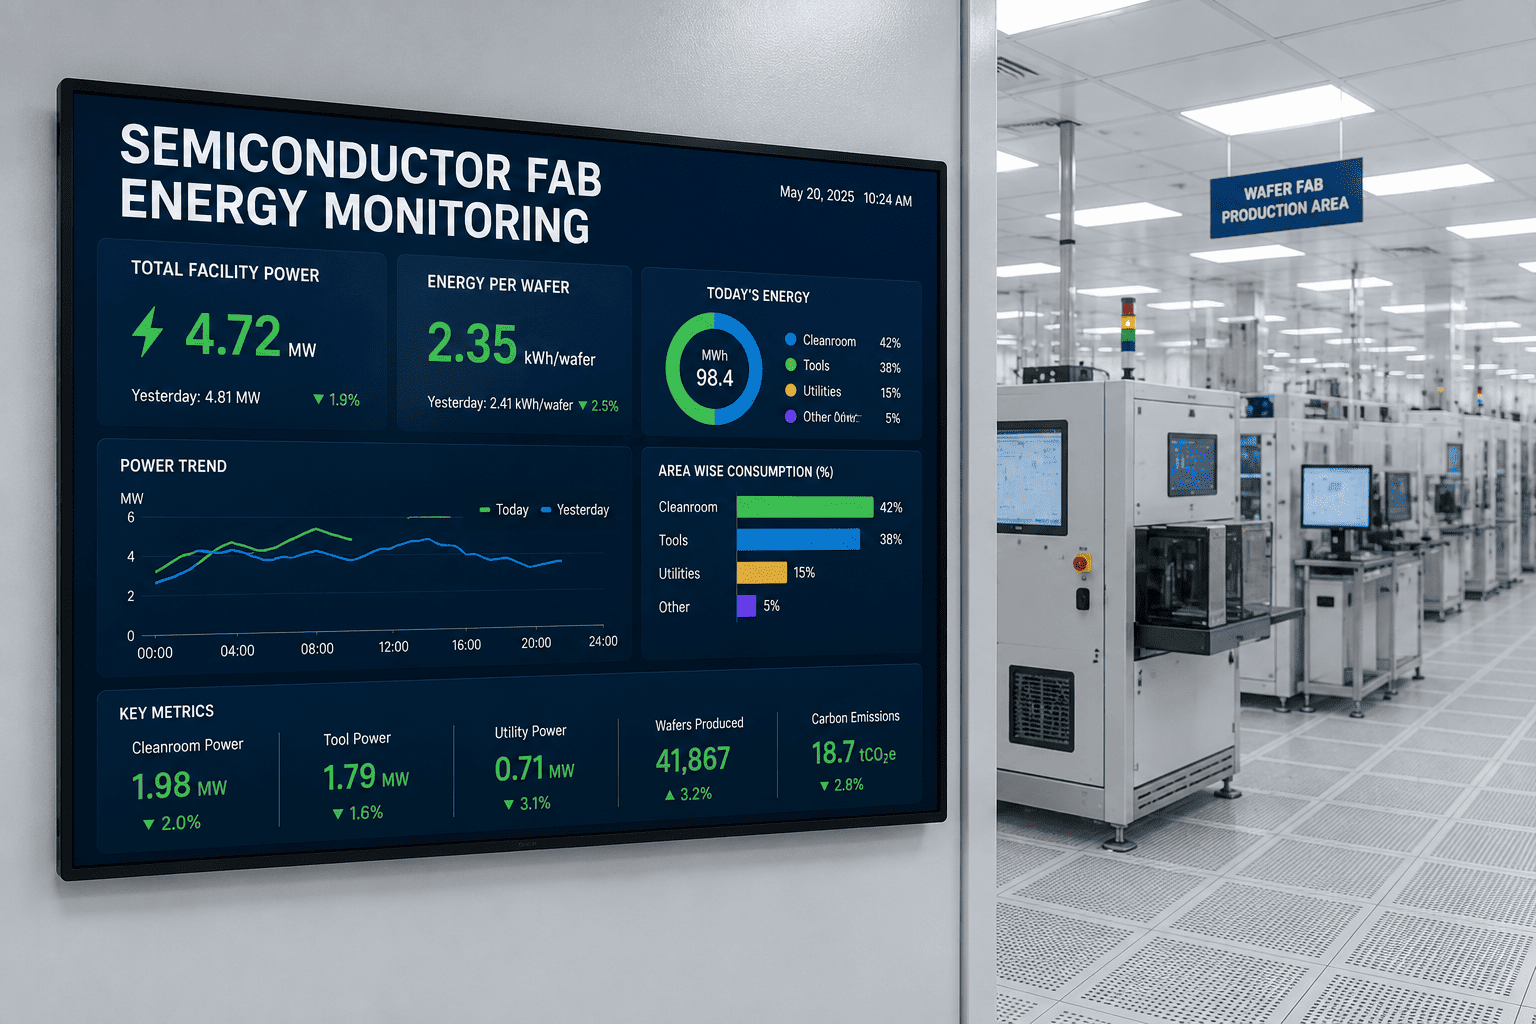
A pharmaceutical plant's energy bill doesn't come from the process most people picture — it comes from the utilities that surround it. Cleanrooms can consume up to fifteen times more energy than a comparable commercial building, more than half of a plant's electricity goes to HVAC and cooling alone, and once you add clean steam, compressed air, and purified water, four utility systems quietly dominate the meter. The problem for most life-science energy teams isn't that the utilities are inefficient in principle — it's that they're managed off a monthly invoice that can't say which system is bleeding. A chiller drifting from 0.85 to 1.2 kW/ton, a compressed-air system leaking a third of its output, a steam trap failing open, a WFI loop over-heating against its microbial margin — none of these trip an alarm, and all of them show up only as a bigger number at month end. Utility energy monitoring fixes the visibility first: submeter the systems that actually move the meter, baseline them, track performance against that baseline, and act on drift before it becomes cost — all without compromising the validated, GMP-critical state these utilities have to hold. To see it running across your chiller plant and clean utilities, book a demo.
PHARMACEUTICAL · CHILLER & UTILITY ENERGY MONITORING
Four Utility Systems Dominate the Meter. Monitoring Tells You Which One Is Bleeding.
Chillers, purified water, clean steam, and compressed air run continuously in a pharma plant — and drift into waste silently, without ever breaching a spec. iFactory's utility energy monitoring submeters each system, baselines it, and surfaces the efficiency loss in real time, so the energy team acts on a defensible number instead of a month-end surprise — all inside the firewall, without touching the validated state.
15×
Energy a cleanroom can use vs a comparable commercial building
>50%
Of plant electricity going to HVAC and cooling
up to 30%
Of compressor output lost to compressed-air leaks
0.85 kW/ton
Efficient chiller target — many pharma plants run well above
Why Utility Waste Hides in a Pharma Plant
Pharma utilities were historically managed as black boxes — manual checks and basic alarms confirming they were running, with no visibility into how efficiently. That works for compliance and fails for energy, because a utility can hold its validated setpoints perfectly while quietly consuming far more energy than it should. The system is "fine" by every alarm the plant has, and expensive by every measure it doesn't. For an energy team, the core problem is that the four biggest consumers are invisible at the individual level — the monthly invoice sums them into one number that can't be diagnosed.
The Invoice Can't Diagnose
A monthly utility bill tells you the plant spent more, not which system caused it. Without submetering the significant energy uses, the chiller plant, steam system, air compressors, and water loops are lumped into a single figure — so drift in any one of them is invisible until it's large enough to move the whole bill, by which point months of waste are already spent.
Validated Doesn't Mean Efficient
A utility can sit perfectly within its GMP-validated range and still waste enormous energy — a WFI loop over-heating, a chiller running colder than the process needs, an AHU reheating air it just cooled. Compliance alarms watch the quality setpoints, not the energy cost of holding them, so the waste never registers as a problem the plant is built to catch.
Degradation Is Gradual and Silent
Condenser fouling creeps a chiller's kW/ton upward over months, a compressed-air leak starts small and grows, a steam trap fails without announcement. None of these are events — they're slow slopes, invisible to a spot check and only obvious when trended continuously against a baseline the plant may never have established.
No Baseline, No Accountability
Without a documented baseline and performance indicators tracked against it, there's no way to say whether a system is drifting or a maintenance action actually helped. Energy stays an unmanaged cost rather than a controlled one, and the team can't defend a fix or flag a regression because there's no reference to measure either against.
Utility digitization is the shift from black boxes to intelligent, data-driven assets — turning passive infrastructure that the plant merely keeps running into monitored systems that reveal their own inefficiency. The first thing it buys an energy team isn't savings; it's visibility into where the savings are.
The Four Systems That Move the Meter
Effective utility monitoring starts by treating each major system as its own consumer with its own efficiency signature. These four dominate a pharma plant's energy footprint, and each fails toward waste in its own characteristic way — which is exactly what makes submetered, per-system monitoring so much more powerful than a single plant-level number.
CHILLERS
kW/ton & approach temperature
The chiller plant cools AHUs, cold rooms, and process loads, and its efficiency is measured directly in kW/ton — where an efficient plant runs around 0.85 kW/ton or better and a neglected one drifts past 1.2. Condenser fouling is the most common and most preventable cause of loss, invisible without approach-temperature trending against a documented baseline. Beyond single machines, chiller sequencing matters: keeping plant load factor in the efficient 40–80 percent band and staging the right combination of machines can recover double-digit percentages that no single-chiller tune-up would find.
PURIFIED WATER & WFI
Pumping & heating energy
Purified water and Water for Injection are vital, validated utilities and significant energy consumers — hot WFI loops recirculate continuously at 70–80°C, and generation by distillation or membrane processes carries very different energy profiles. The monitoring challenge is uniquely GMP-shaped: pumping and heating energy has to be weighed against the microbial-control margin the loop must hold, so the goal isn't minimum energy but minimum energy that still protects water quality. Visibility into where that balance actually sits is what turns an over-conservative, over-heated loop into a right-sized one.
CLEAN STEAM
Trap losses & insulation
Steam drives sterilization, SIP, humidification, and heating, and steam systems leak energy in well-known but hard-to-see ways: failed steam traps venting live steam, insufficient pipe and vessel insulation, oversized boilers, and poor blow-down control. Each loss wastes energy and undermines the reliability of the whole steam system. Continuous monitoring surfaces the failed trap and the insulation gap that a periodic manual steam audit would miss between rounds, turning an intermittent audit into a standing watch.
COMPRESSED AIR
Leaks & specific power
Oil-free compressed air meeting ISO 8573 drives pneumatic controls, process equipment, and cleanroom operations — and it's the most notoriously leaky utility in any plant, with leaks alone capable of wasting up to 30 percent of a compressor's output. Because the compressor keeps running to hold pressure, the leak never announces itself; it just shows up as electricity. Submeter data that flags rising specific power or off-hours consumption is what triggers the leak audit that finds the losses, often one of the single largest savings a plant uncovers.
Find Out Which Utility Is Bleeding
Bring your chiller plant configuration and a recent utility bill to the call. iFactory engineers will show how per-system submetering and baselining surface the chiller drift, the air leak, the failed trap, and the over-heated water loop — with the energy penalty of each in defensible numbers.
The Method: Submeter, Baseline, Track, Act
Utility energy monitoring isn't a dashboard you install and admire — it's a disciplined loop aligned to ISO 50001 that turns raw consumption data into acted-upon savings. The same four steps apply to every system, and it's the repetition of the loop, not any single measurement, that drives energy down and keeps it there.
1
Submeter the Significant Energy Uses
Install submetering on the systems that actually move the meter — chiller plant, steam, compressed air, water loops — so each is measured as its own consumer instead of lost inside a plant-level total. A wave-based rollout puts the highest-impact points in first, proves savings, then expands, respecting the ROI math rather than metering everything at once.
2
Establish a Performance Baseline
Set a documented baseline for each system — kW/ton for chillers, specific power for air, energy per unit for the plant — normalized against production so you're comparing like with like. This baseline becomes the reference every future reading and every maintenance action is measured against, the benchmark that makes drift and improvement both visible.
3
Track EnPIs and Detect Drift
Energy performance indicators are trended continuously against the baseline, and the system flags deviation — a chiller's kW/ton climbing from condenser fouling, compressed-air consumption rising off-hours, a steam system's efficiency slipping. Real-time tracking catches the slow slope while it's still small, not after it has moved the monthly bill.
4
Act, Then Verify the Saving
A flagged anomaly triggers a maintenance work order with the energy data and probable cause attached, and after the fix, post-intervention performance is measured against the pre-fault baseline to calculate the verified saving. That closes the loop — turning each action into a documented energy-ROI record that justifies the next one.
Where the Savings Actually Come From
The value of per-system monitoring is concrete: it finds specific, recoverable losses that a plant-level view never isolates. These are the recurring discoveries that submetered utility monitoring surfaces in life-science plants, each a defensible percentage of the bill rather than a vague efficiency aspiration.
01
Compressed-Air Leaks
Often the single largest discovery — a leak audit triggered by submeter data can reveal losses worth several percent of the total bill, eliminated over a few months of systematic repair. Because leaks waste up to 30 percent of compressor output and never self-announce, the submeter signal that prompts the audit is what unlocks the saving.
02
Chiller Sequencing & Fouling
Consolidating running chillers during low-load periods and correcting condenser fouling recover efficiency a single-machine view misses. A documented case took a pharma plant from 1.2 to 0.85 kW/ton for a 30 percent cooling-energy cut, and load-factor-aware sequencing alone can contribute double-digit percentages on the cooling load.
Steam Trap & Insulation Losses
03
Continuous monitoring catches the failed-open trap venting live steam and the insulation gap that a quarterly manual audit misses between rounds. Because these losses also undermine steam-system reliability, fixing them protects uptime as well as the energy budget — a double return on a single find.
04
Right-Sized Water Loops
Visibility into pumping and heating energy against the microbial-control margin reveals over-conservative WFI loops running hotter or harder than quality actually requires. Right-sizing that balance — without touching the validated quality target — trims the continuous energy draw of a utility that runs every hour of every day.
The pattern is consistent: the biggest wins come from systems everyone assumed were fine because they never alarmed. Submetering doesn't make the utilities more efficient by itself — it makes their inefficiency visible, which is the precondition for every saving that follows.
Monitoring That Respects the Validated State
In a pharma plant, no energy initiative is worth compromising GMP compliance or product quality — and a well-designed monitoring layer never asks you to. It observes and analyzes; it doesn't sit in the control loop or alter a validated setpoint. That separation is what makes energy optimization safe in a regulated environment.
Analytics, Not Control
The platform reads utility data and surfaces inefficiency, but it doesn't take control of the chiller, the water loop, or the steam system. Optimization recommendations go to the energy team and maintenance planner as work orders and insights, leaving the validated control layer untouched — so improving energy never means re-qualifying a control system.
Quality Margin Comes First
Every efficiency recommendation is framed against the compliance constraint it has to respect — the microbial-control margin on a water loop, the sterilization requirement on steam, the classification requirement on cleanroom air. The objective is the lowest energy that still fully protects quality, never energy savings that trade against the validated state.
Turnkey, On-Premise — Inside Your Firewall
For a pharma plant, utility and process data stays inside the walls, and adopting monitoring shouldn't mean a long IT project. iFactory ships as a turnkey system on an on-premise stack, so energy visibility goes live quickly without cloud dependency or data leaving your network.
1
Racked, Ready, and Sovereign
A pre-configured on-premise NVIDIA server arrives racked and ready — you connect power and network, and the analytics run inside your firewall with no cloud and no data egress. For a plant that treats its operational data as sensitive, the whole stack stays sovereign by design.
2
Integrates With BMS and Existing Meters
The platform ingests chiller, water, steam, and air data through BMS integration and IoT sensors, reading existing instrumentation where it exists and adding submeter points only where a real gap exists — connecting to the plant you already run rather than requiring a rebuild.
3
Wave-Based Deployment, Fast ROI
Submetering rolls out in waves — highest-impact systems first to prove savings, then expansion — so value shows up early and the deployment respects the ROI math instead of demanding full instrumentation before the first result lands.
4
Work Orders and Verified Savings Built In
Anomaly-triggered work orders route to maintenance with energy context attached, and post-maintenance verification quantifies the saving from each action — closing the loop between energy analytics and the maintenance workflow that actually captures the value.
What Changes for the Energy Team
Utility energy monitoring changes the energy team's job from explaining last month's bill to managing this month's consumption — from a reactive, invoice-driven role to a proactive, data-backed one.
01
Every System Has a Number
Instead of one plant-level bill, the team sees each utility's efficiency as its own tracked metric, so a chiller drifting or an air system leaking is a specific, attributable signal — not a mystery hidden in a total. Diagnosis replaces guesswork.
02
Drift Gets Caught Early
Continuous EnPI tracking against a baseline flags the slow slope — fouling, a growing leak, a failing trap — while it's still small, so the team intervenes before the waste compounds into the monthly bill. The energy conversation moves upstream of the invoice.
03
Maintenance ROI Becomes Provable
Post-intervention verification against the pre-fault baseline gives every energy-related work order a measured saving, turning maintenance from a cost center argument into a documented ROI record that justifies the next investment and defends the last one.
04
Compliance and Efficiency Stop Competing
Because recommendations are framed against the quality margin they must respect, the team pursues savings without ever risking the validated state — ending the false trade-off between running efficient and running compliant that used to stall every energy project.
Frequently Asked Questions
The questions pharma energy and facilities teams ask most often when evaluating utility energy monitoring.
Our utilities pass every GMP check. How can they be wasting energy?
Because compliance and efficiency are different things measured by different means. A utility can hold its validated setpoints perfectly — the WFI loop at temperature, the cleanroom at classification, the steam at pressure — while consuming far more energy than the process actually requires. Compliance alarms watch the quality parameters; they say nothing about the energy cost of holding them. A chiller running colder than needed, an AHU reheating air it just cooled, a water loop over-heated against its microbial margin all pass every GMP check and still waste energy, because nothing in the plant is watching efficiency. That's exactly the gap monitoring fills — visibility into the cost of compliance, not a challenge to compliance itself. To see it on your systems,
book a demo.
Will energy monitoring interfere with our validated utility systems?
No — it's designed as an observation and analytics layer that sits outside the control loop. The platform reads utility data through BMS integration and submeters and surfaces inefficiency, but it doesn't take control of the chiller, water loop, or steam system or alter any validated setpoint. Optimization comes to your team as recommendations and work orders, leaving the control layer untouched, so improving energy performance never requires re-qualifying a control system. Every recommendation is also framed against the compliance constraint it must respect — the microbial margin, the sterilization requirement, the air classification — so the objective is always the lowest energy that still fully protects quality. Monitoring makes the validated state visible and defensible; it never trades against it.
Which utility should we submeter first?
Start with the systems that move the meter most and where waste is most common, then expand in waves. In most pharma plants that means the chiller plant and compressed air first — cooling because it's the largest single electricity consumer and drifts silently through condenser fouling and poor sequencing, and compressed air because leaks routinely waste up to a third of compressor output and it's frequently the single largest discovery a submetering program makes. Steam and water loops follow closely, since failed traps and over-heated WFI loops are significant continuous losses. A wave-based rollout installs the highest-impact points first to prove savings quickly, then extends coverage, which respects the ROI math rather than requiring you to instrument everything before seeing a return. The right first wave depends on your plant's mix, which a scoped assessment identifies.
How does this connect to our maintenance program?
Tightly — the whole point is to close the loop between energy data and maintenance action. When monitoring detects an efficiency anomaly, such as a chiller's kW/ton climbing past its baseline or compressed-air consumption rising off-hours, it generates a maintenance work order with the energy data, the probable cause, and the asset's history attached, so the planner acts on a diagnosed problem rather than a vague alert. After the work is completed, the platform measures post-intervention performance against the pre-fault baseline and calculates the verified energy saving from that specific action. That creates a financial record of maintenance ROI, which is often the strongest justification for the next intervention and the clearest way to show that condition-based maintenance on utilities pays for itself. Energy analytics and maintenance stop being separate functions and become one workflow.
Does our data go to the cloud?
No — the platform is turnkey and fully on-premise, running on a pre-configured server inside your own firewall with no cloud dependency and no data egress. For a pharmaceutical plant, operational and utility data is sensitive, and a sovereign, on-site architecture keeps it entirely within your network rather than shipping it to a vendor environment. The system arrives racked and ready, integrates with your BMS and existing meters, and produces its analytics locally. This matters not just for data security but for the resilience that regulated manufacturing demands — the monitoring keeps working regardless of external connectivity, and nothing about your plant's energy profile, configuration, or operations leaves the building. Contact
iFactory support to discuss the on-premise deployment for your site.
STOP MANAGING UTILITIES OFF A MONTHLY INVOICE
See Every Utility's Energy in Real Time — Chillers, Water, Steam, and Air.
Per-system submetering, baselined performance, drift detection, and verified savings across your chiller plant and clean utilities — with anomaly-triggered work orders and quality margins respected at every step. Turnkey, on-premise, inside your firewall. Turn the four systems that dominate your meter from black boxes into managed, defensible assets.