Continuous Environmental Monitoring in Pharma Cleanrooms
By David Cook on August 27, 2026
Environmental monitoring is how a cleanroom proves it is still a cleanroom. Every particle count, every viable sample, every pressure differential is evidence that the space where sterile product is made is holding its classification — the GMP backbone that underwrites everything done inside. Done the old way, that evidence is sparse and slow: an operator walks a route, takes a sample, reads a plate a day later, writes a number on a sheet. The excursion that mattered happened between two of those samples, and nobody knew until the product was already exposed. For a maintenance team, there is a second loss too — the slow drift in pressure or particles that was the first sign of a loading filter, buried in paper nobody trends. Continuous digital environmental monitoring closes both gaps.
Cleanroom Monitoring and Reliability for Pharma
Continuous Environmental Monitoring in Pharma Cleanrooms
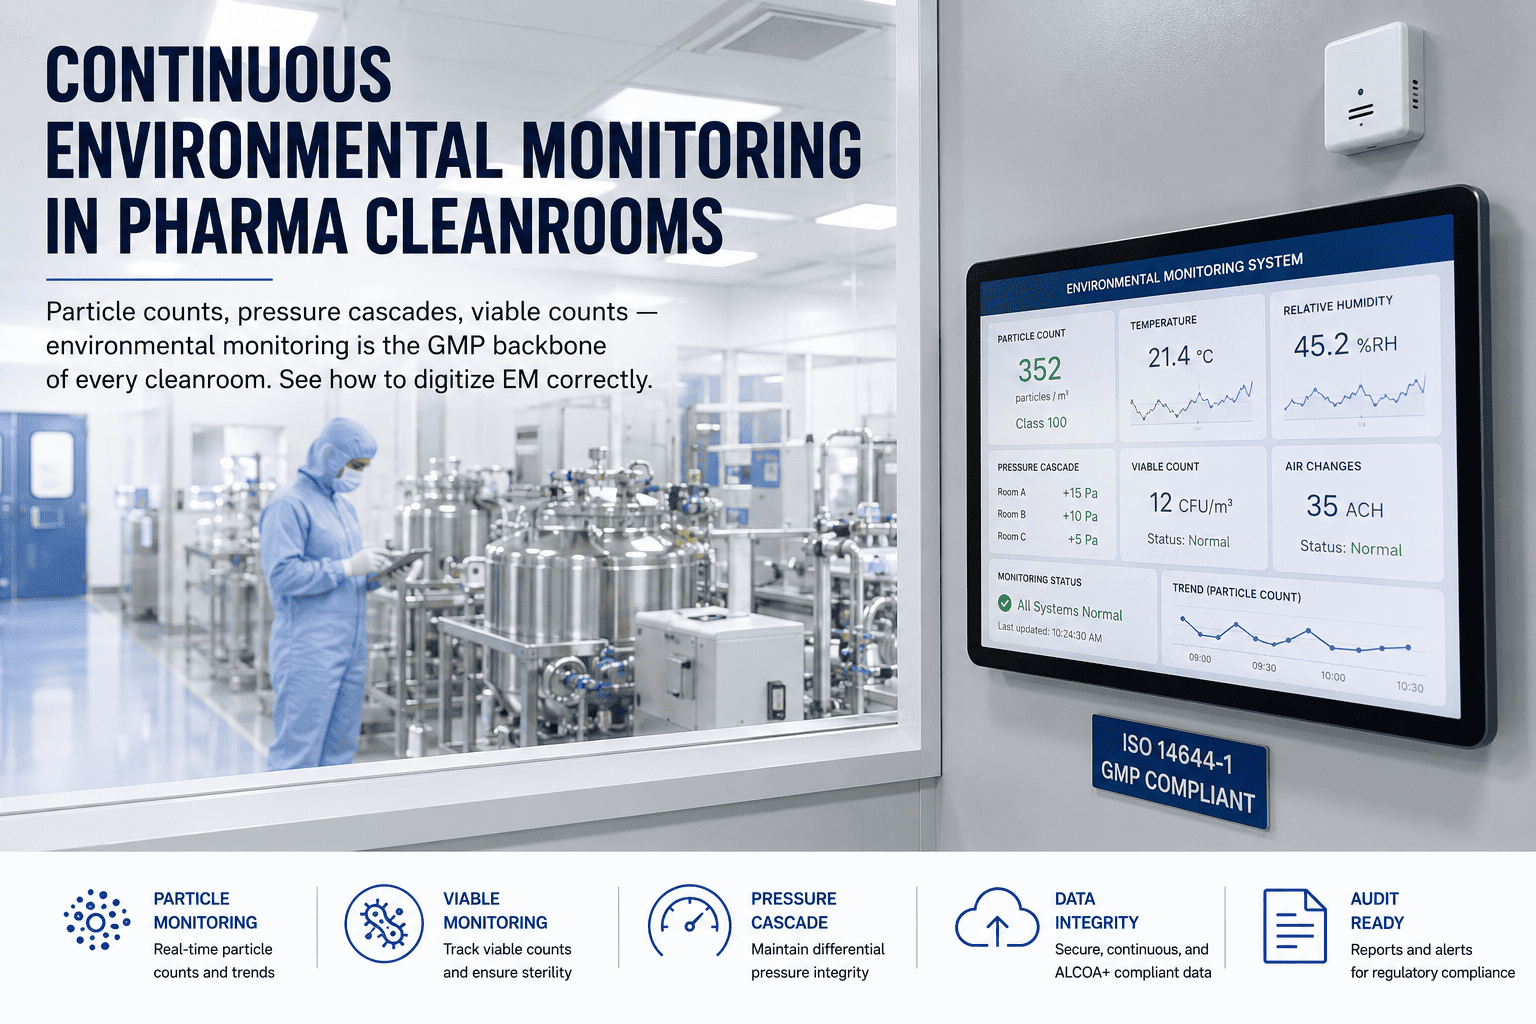
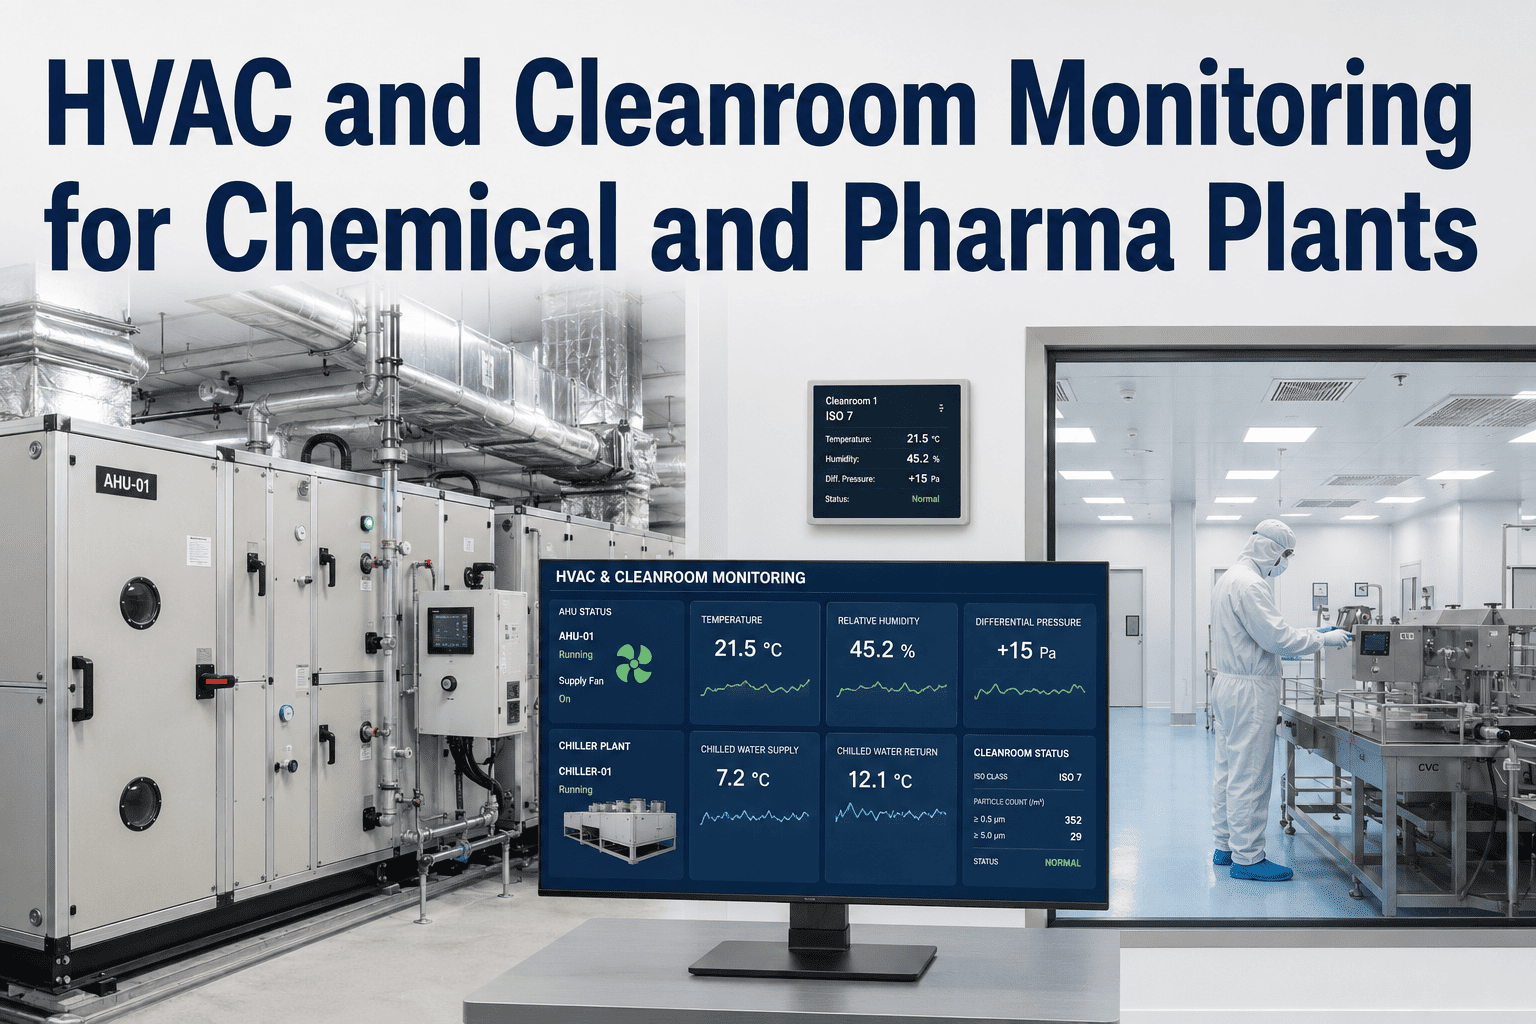
Particle counts, viable monitoring, and pressure cascades are the GMP backbone of every cleanroom. See how to digitize EM correctly — continuous, compliant, and doubling as an early warning for the HVAC and filters that keep the room clean.
A cleanroom classification is not a one-time certificate; it is a claim that has to be demonstrated continuously, in operation, for as long as product is made. Environmental monitoring is the demonstration. When it is manual and periodic, the record has gaps by design — you know the state of the room at the moments you sampled and can only assume the rest. Continuous monitoring removes the assumption, turning a set of snapshots into an unbroken record and, at the same time, into a live signal the maintenance team can act on.
Three Things Every Cleanroom Must Prove
Environmental monitoring rests on three pillars. Together they show the room is clean, stays clean, and keeps contamination from getting in.
Non-viable particles
Airborne particle counts at 0.5 and 5.0 microns, against the classified limits for the grade under ISO 14644 and Annex 1.
Viable monitoring
Microbial load from active air sampling, settle and contact plates, and personnel monitoring — the living contamination the counts cannot see.
Pressure cascade
Differential pressures, air changes, temperature, and humidity that keep air flowing from clean to less clean and hold the room in spec.
The Pressure Cascade That Keeps Contamination Out
The single most important barrier in a cleanroom is invisible: the pressure difference between rooms. Each grade is held at a higher pressure than the dirtier space beside it, so air always flows outward, from clean to less clean, and contamination cannot drift in. Lose a differential and the cascade can reverse — which is why pressure is monitored continuously and why a drift in it matters so much.
Air flows from clean to less clean
Corridor
0 Pa
Grade C
+15 Pa
Grade B
+30 Pa
Grade A
+45 Pa
Pressures are illustrative — typical steps run around 10 to 15 Pa per grade. The arrows show air pushed outward from the cleanest zone; continuous monitoring catches a differential drifting before the cascade is at risk.
The Excursion Hides Between Samples
Periodic sampling can only tell you about the moments you sampled. A particle spike or a brief pressure loss that happens in the gap between two rounds leaves no trace on the record, even though the product was exposed to it. Continuous monitoring watches the whole timeline, so the excursion that manual sampling would step right over is caught as it happens.
A spike between rounds — missed by sampling, caught by continuous
The amber dots are the moments a manual round happened to sample — all in spec. The spike between them is the one that mattered.
EM Is Also a Maintenance Signal
For a maintenance team, continuous EM data is more than a compliance record — it is the earliest warning that the systems keeping the room clean are starting to slip. The excursion you want to prevent usually announces itself first as a slow drift, and drift is exactly what a continuous trend reveals.
Particle baseline creeping up
Points to a HEPA filter loading or a developing leak.
Plan the filter change before it breaches the limit.
Pressure differential drifting
Points to a fan, damper, or filter beginning to fail.
Investigate before the cascade is at risk of reversing.
Sensor reading drifting
Points to an instrument due for calibration.
Service the sensor before the data can be questioned.
How to Digitize EM Correctly
Digitizing environmental monitoring is not simply putting the paper log on a screen. Done correctly, it means continuous data you can trust, alarms you can act on, and records that stand up to an audit.
Continuous networked sensors
Particle counters, pressure, temperature, humidity, and active air sampling feeding data without a manual round.
Real-time excursion alarms
Alerts the moment a limit is approached or crossed, so the response begins before product is affected.
Part 11 and ALCOA+ integrity
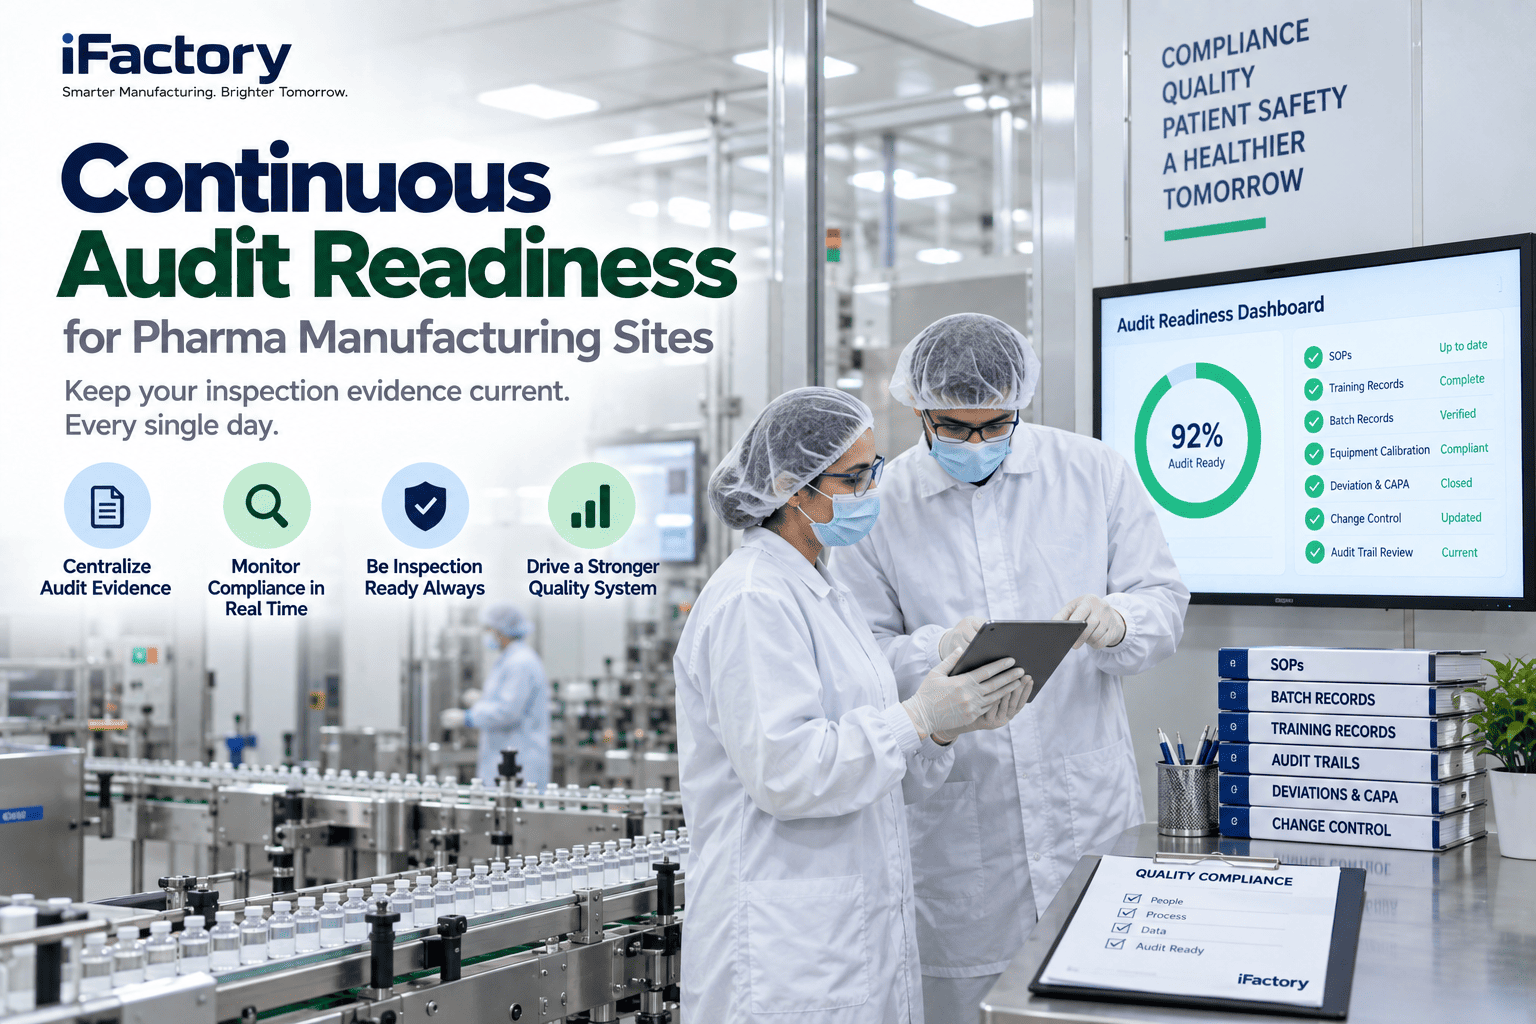
Attributable, contemporaneous, tamper-evident records with a full audit trail, ready for inspection.
Trending and control strategy
Trends across rooms and time that feed the contamination control strategy Annex 1 expects.
Sensor calibration and health
Instrument status and calibration tracked, so the monitoring system itself stays qualified.
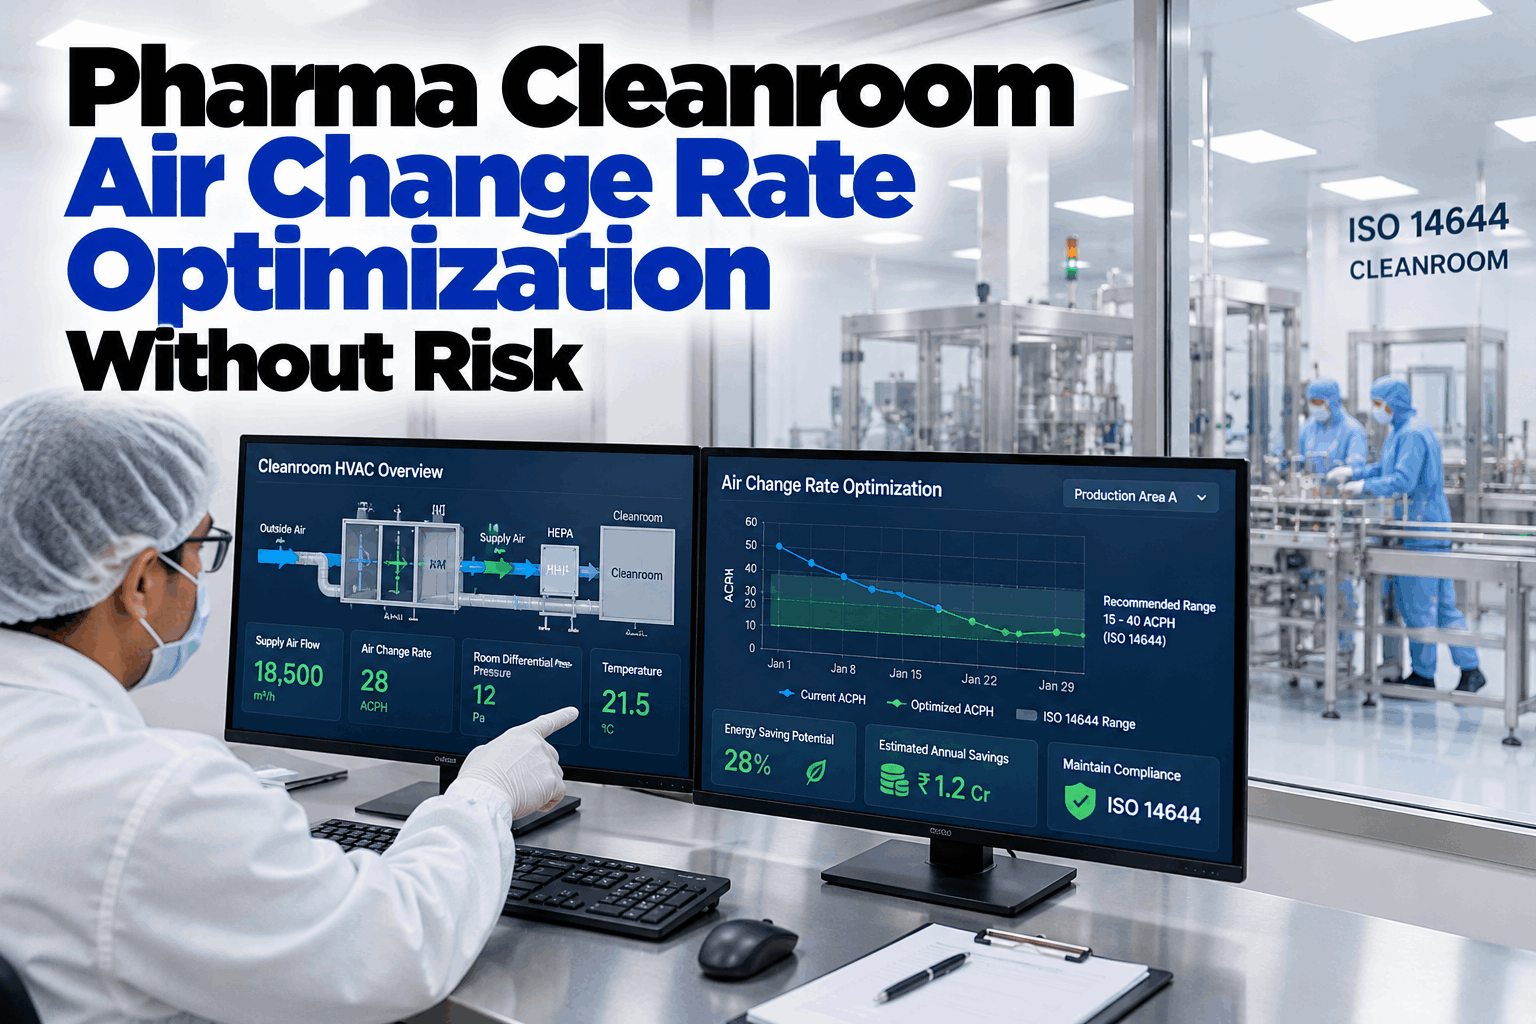
Integration with HVAC and BMS
EM data tied to the systems that drive it, so a reading and its cause are seen together.
How much of your cleanroom's timeline is still just assumed between samples? Book a 30-minute demo and we'll show continuous EM on one of your rooms.
What Continuous EM Delivers
Making environmental monitoring continuous strengthens the compliance record and hands maintenance a head start at the same time.
Caught
Excursions early
no gap between samples to hide in
Audit
Ready records
complete, attributable, retrieved in seconds
Fewer
Manual rounds
time returned to the team
Early
HVAC and filter warning
drift caught before it becomes an excursion
Frequently Asked Questions
Does continuous monitoring replace our viable sampling program?
No. Continuous monitoring is strongest for the parameters that can be measured in real time — non-viable particles, pressure, temperature, and humidity — and for active air sampling. Viable monitoring still involves incubation and microbiological reading that take their own course. The digital system brings all of it into one record and trend, so your viable results sit alongside the continuous data rather than in a separate logbook, but it complements your microbiology program rather than replacing it.
How does it help with Annex 1 and data integrity?
The revised Annex 1 expects a contamination control strategy supported by monitoring and trending, and data integrity expectations require records that are attributable, contemporaneous, and tamper-evident. Continuous digital EM captures data automatically with a full audit trail, aligned to 21 CFR Part 11 and ALCOA+, and provides the trending across rooms and time that a contamination control strategy draws on. It is built to produce exactly the evidence inspectors look for.
Why does the maintenance team care about EM data?
Because the environment EM measures is created by equipment the maintenance team owns — HVAC, HEPA filters, fans, dampers, and the sensors themselves. A slowly rising particle baseline or a drifting pressure differential is often the first sign that a filter is loading or a fan is weakening, well before it becomes an excursion. Reading EM as a reliability signal lets maintenance schedule the fix in a planned window instead of responding to a contamination event.
Does the monitoring system itself need to be qualified?
Yes. The sensors and the system are part of the GMP environment, so they must be qualified and kept calibrated, and the software managing the records must meet data integrity requirements. A correct digitization tracks instrument calibration and health as part of the system, so the monitoring that proves the room stays trustworthy itself. This is one of the reasons doing EM digitally correctly matters more than simply doing it digitally.
How do we get started?
Start with one room or one critical zone. The best next step is a demo where we show continuous particle and pressure monitoring, real-time excursion alarms, and the audit-ready record on a representative space, along with how the same data surfaces an HVAC or filter drift early. From there it extends room by room across the classified areas.
Prove the Room Continuously, Not in Snapshots.
See Continuous EM on Your Cleanroom
Bring one classified room. We'll show continuous particle and pressure monitoring, real-time excursion alarms, and the audit-ready record — plus how the same data warns your maintenance team of an HVAC or filter drift before it becomes an excursion.