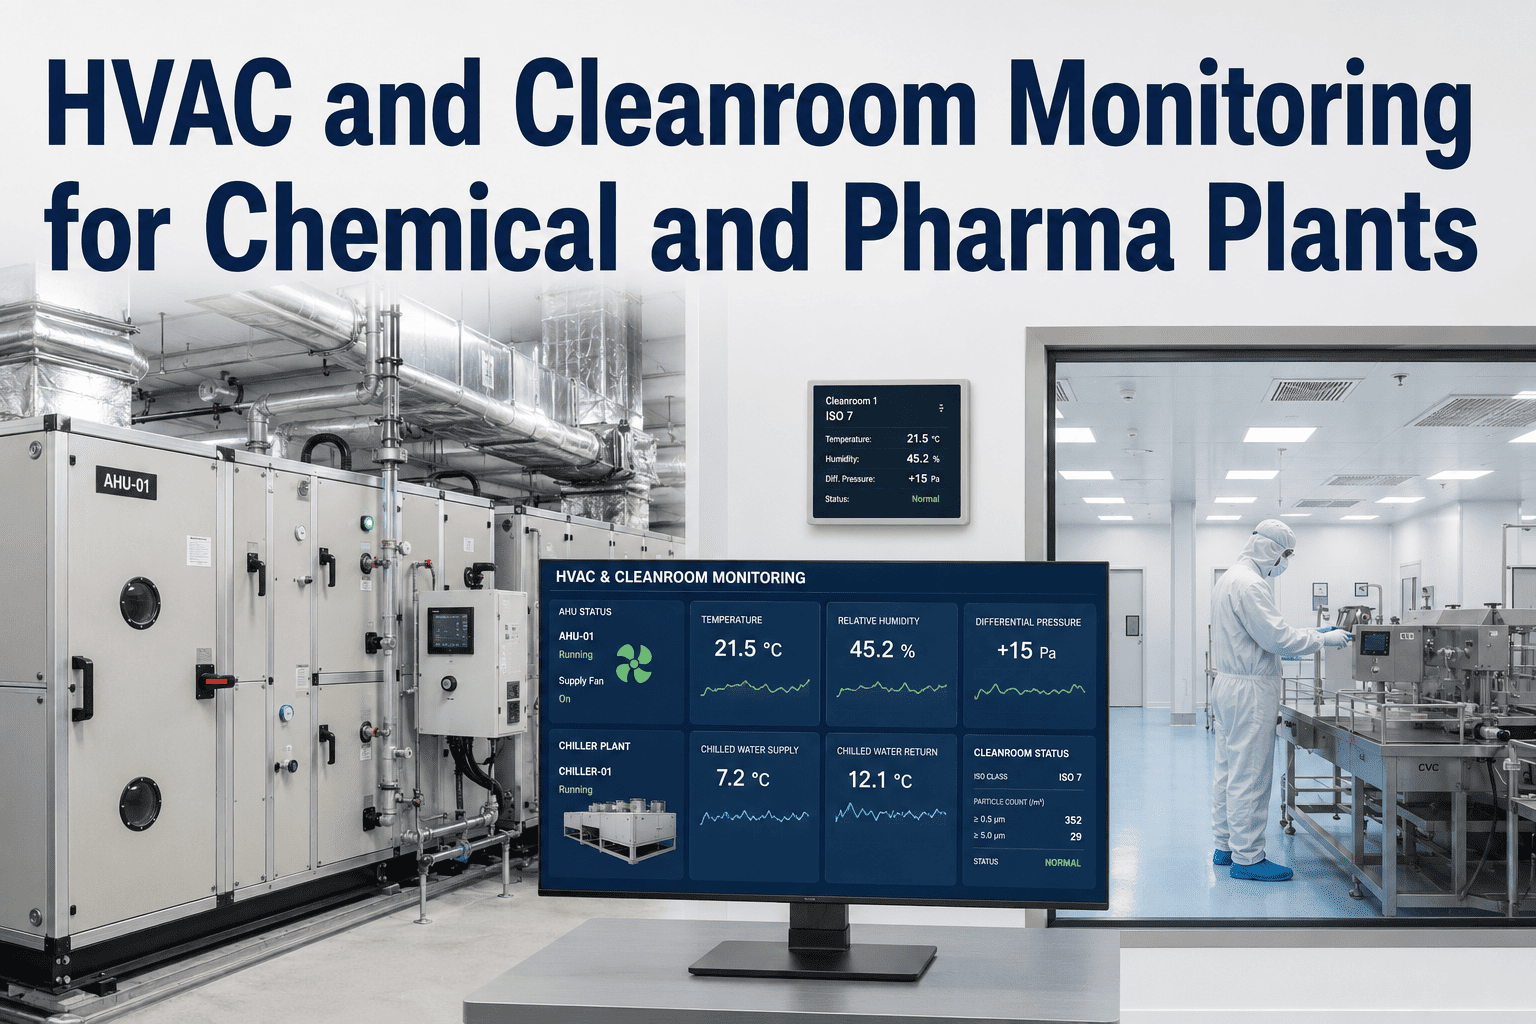
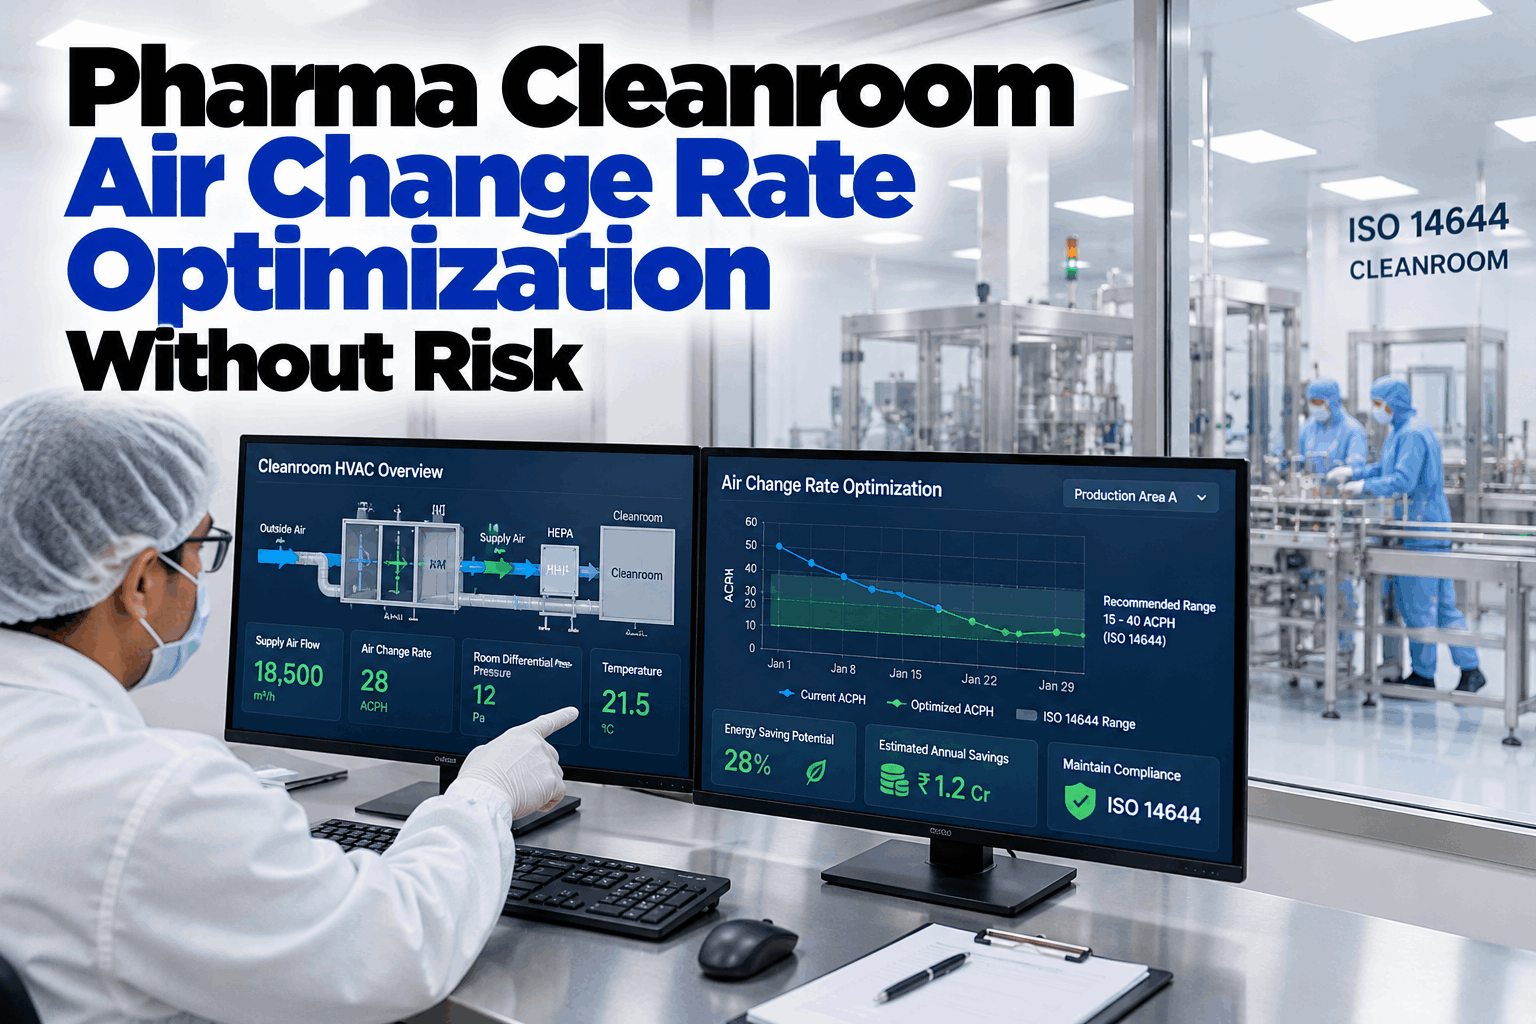
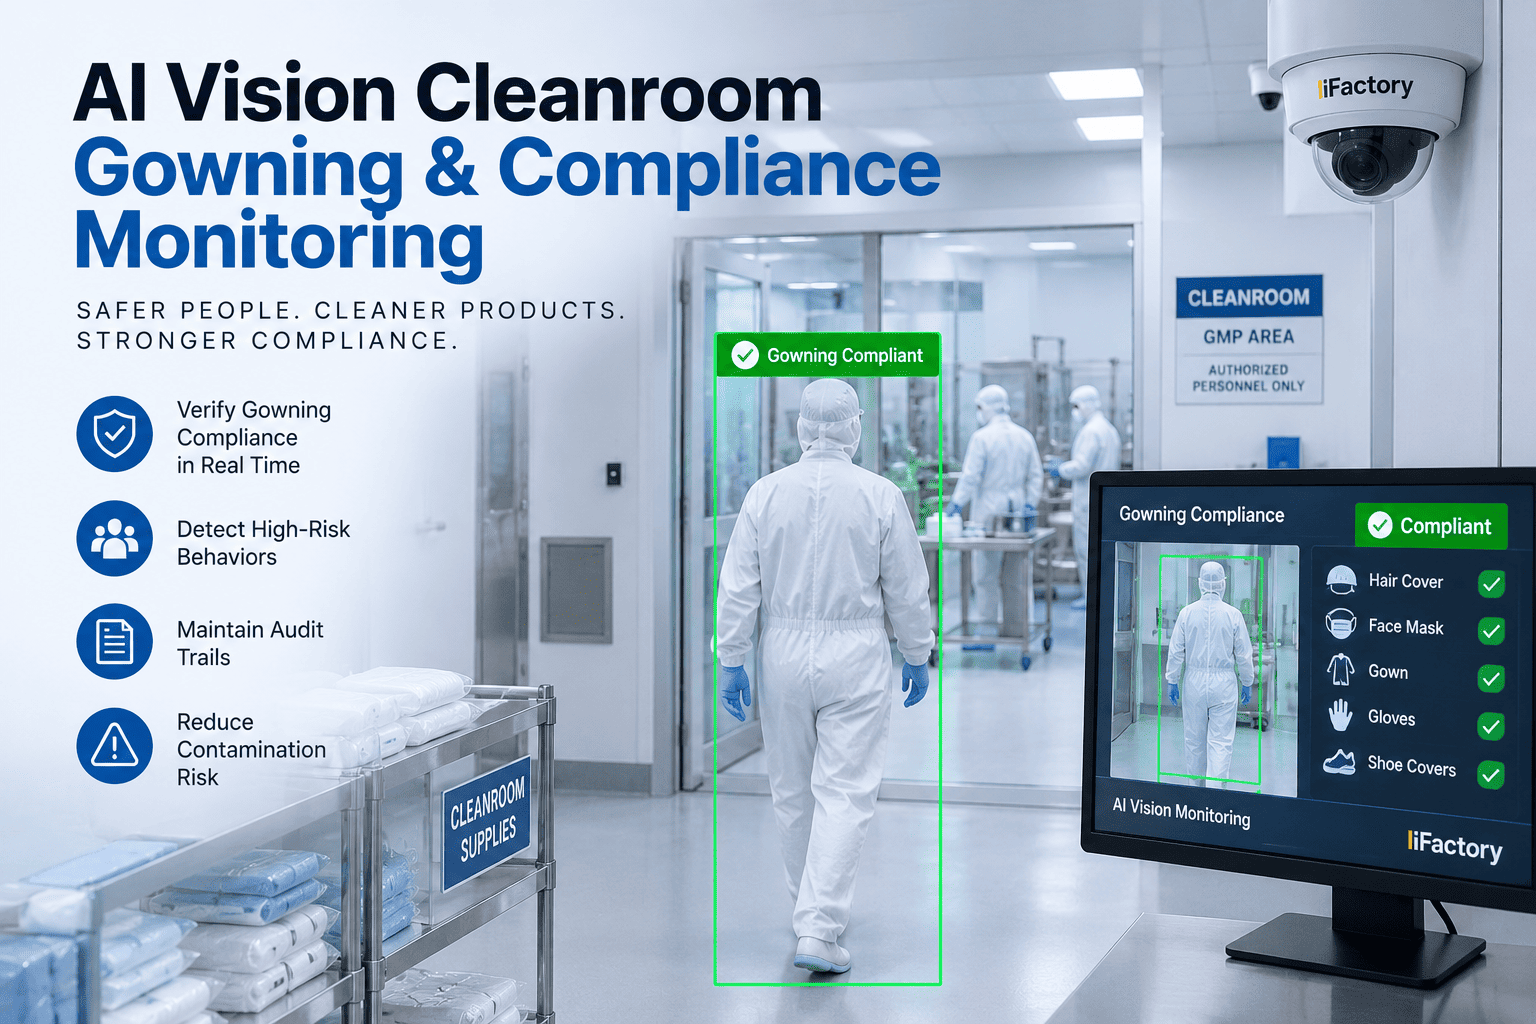
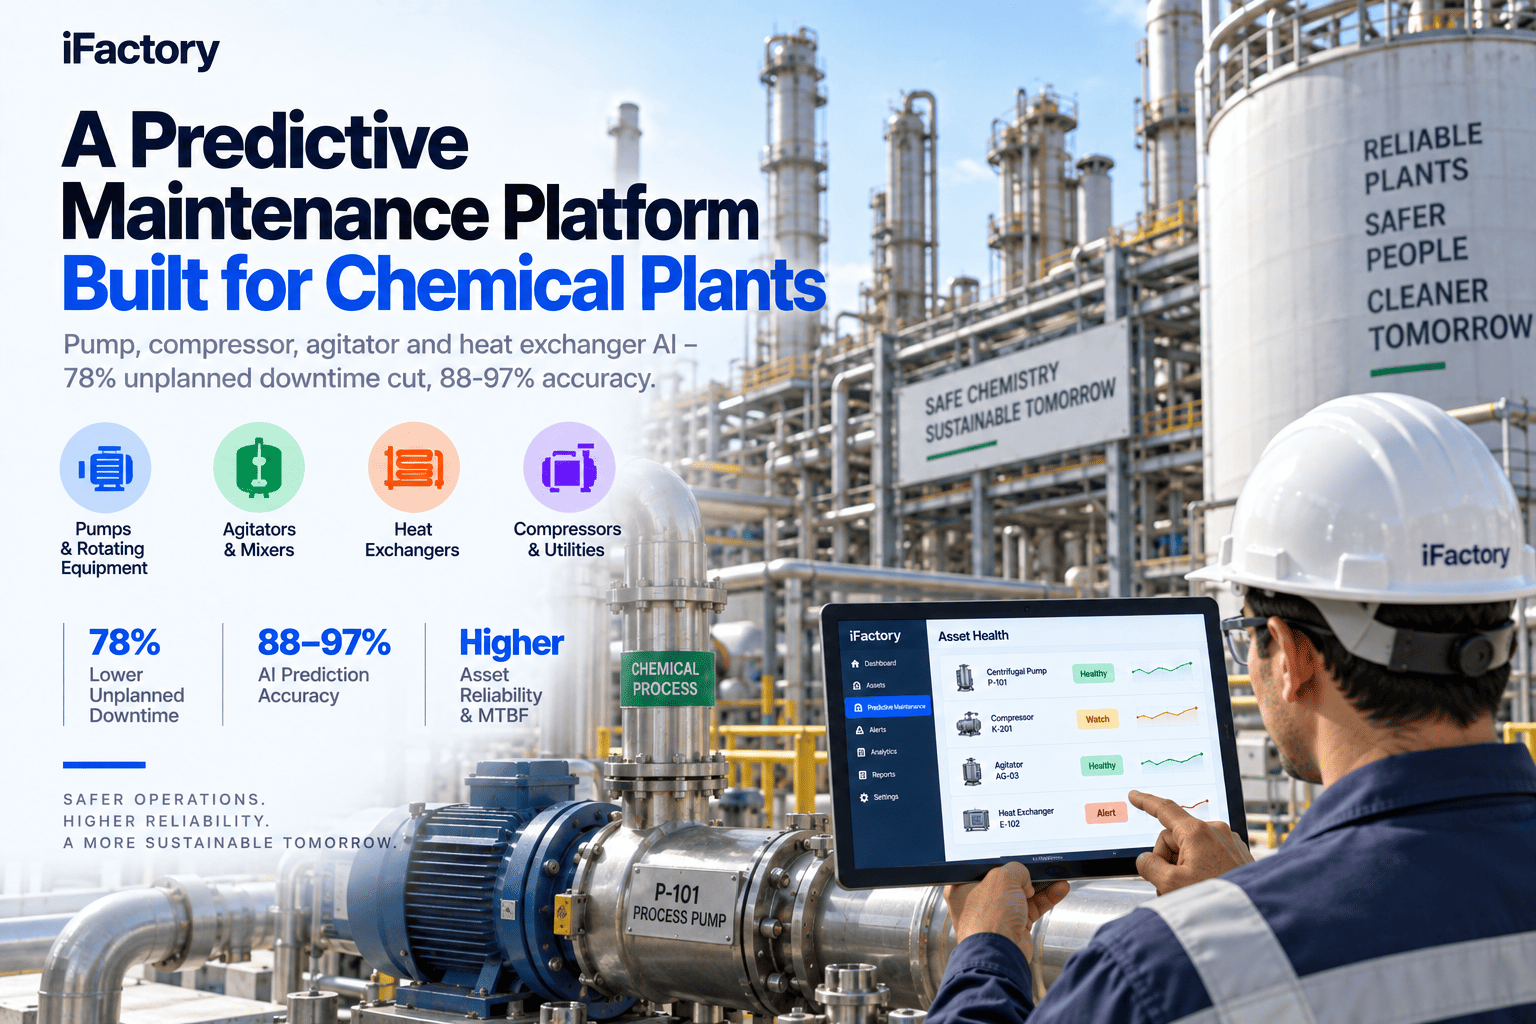
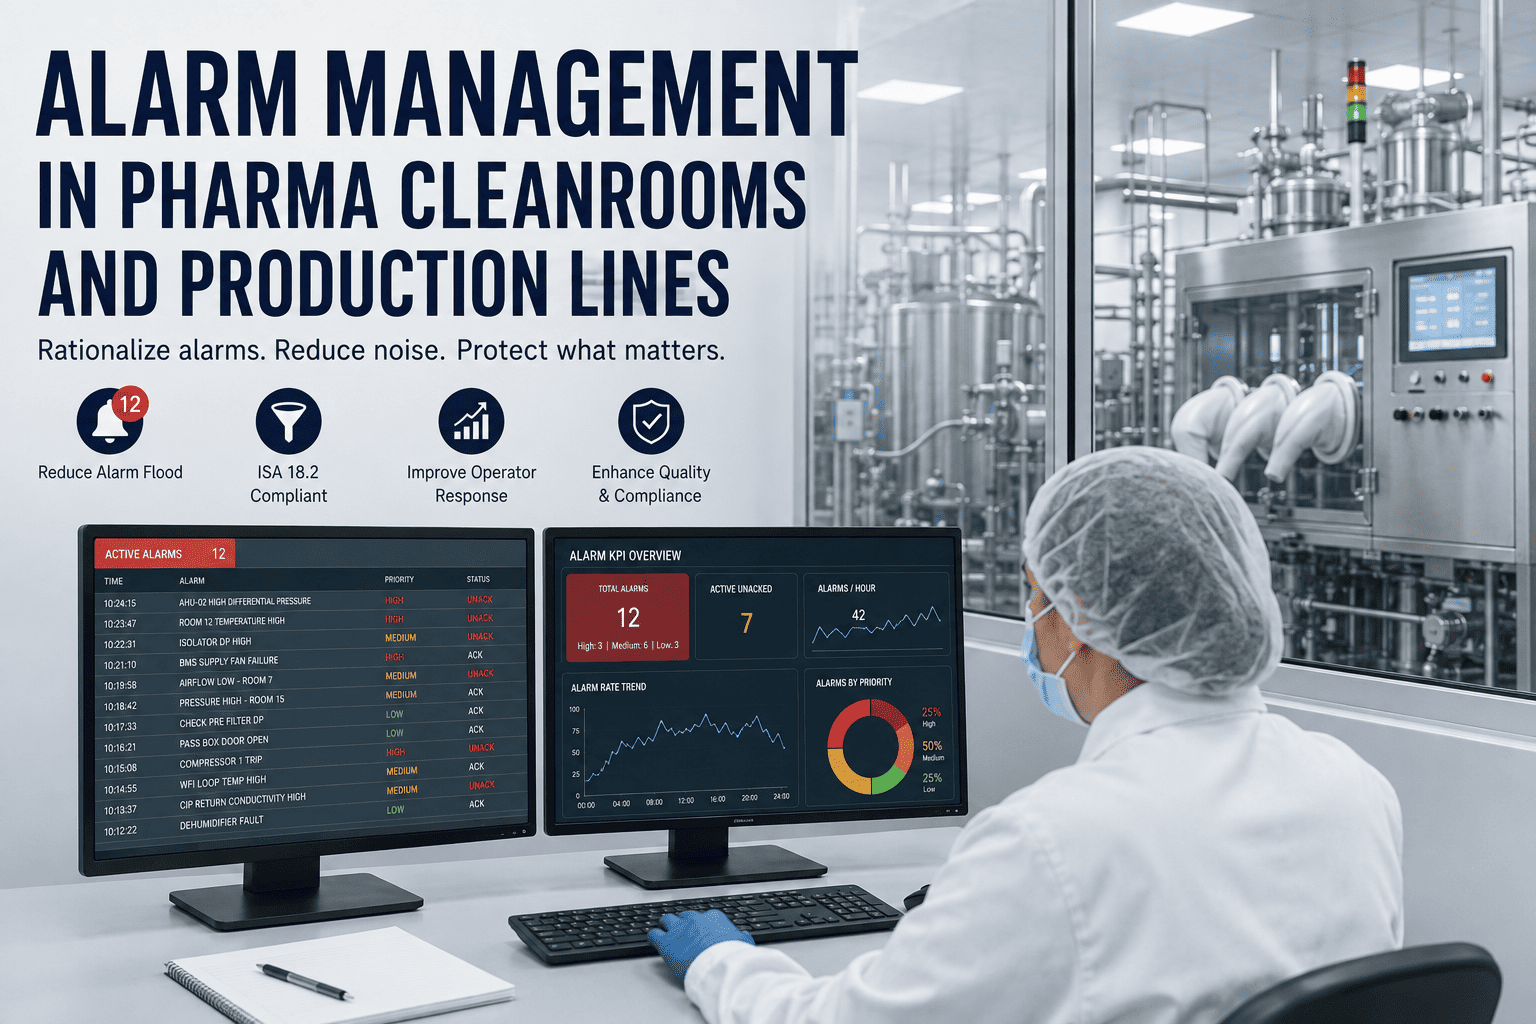
Your Grade B suite drifted 4 Pascals negative for 47 minutes at 2 AM. Nobody noticed. The batch cleared QC. Six months later an FDA inspector pulls the differential pressure logs and finds the excursion nobody investigated — and now the CCS, the QMS, and the site's next PAI are all in scope. Cleanroom HVAC failures rarely announce themselves. They drift silently through pressure cascades, chiller kW/ton, HEPA loading, and AHU coil fouling until a warning letter, a batch loss, or an energy bill makes the cost visible. iFactory HVAC and cleanroom AI watches every AHU, chiller, HEPA filter, and pressure cascade continuously — on-prem, GMP-ready, live in 6 to 12 weeks.
iFactory HVAC & Cleanroom AI
Continuous HVAC and Cleanroom Monitoring for Chemical and Pharma Plants
AI for AHUs, chillers, HEPA filters, and ISO Class cleanrooms — built to hold EU GMP Annex 1, FDA, and ISO 14644 compliance while cutting the energy bill your cleanrooms already carry.
50%+
of cleanroom energy is HVAC
10-15Pa
pressure cascade minimum
15x
energy vs commercial buildings
6-12wk
to go-live, on-prem
Cleanroom Grades Every Pharma Plant Runs
EU GMP Annex 1 defines four grades (A, B, C, D) that map onto ISO 14644 classes. Each grade has its own particle limit, monitoring cadence, and pressure cascade requirement — and the difference between a compliant Grade B and a Grade C excursion is not a paperwork issue. It is the difference between releasing a batch and losing one. This is the operational reference every facilities engineer works from.
Grade
ISO Class
Typical Use
Particle Monitoring
Requalification
Grade A
ISO 5 (at rest & in operation)
Aseptic filling, open product handling, sterile connections
Continuous, mandatory
Every 6 months
Grade B
ISO 5 at rest, ISO 7 in operation
Immediate background to Grade A
Continuous, mandatory
Every 6 months
Grade C
ISO 7 at rest, ISO 8 in operation
Preparation, solution filtration, less critical steps
Periodic, risk-based
Every 12 months
Grade D
ISO 8 at rest
Component washing, less critical support
Periodic, risk-based
Every 12 months
The Pressure Cascade That Keeps Contamination Out
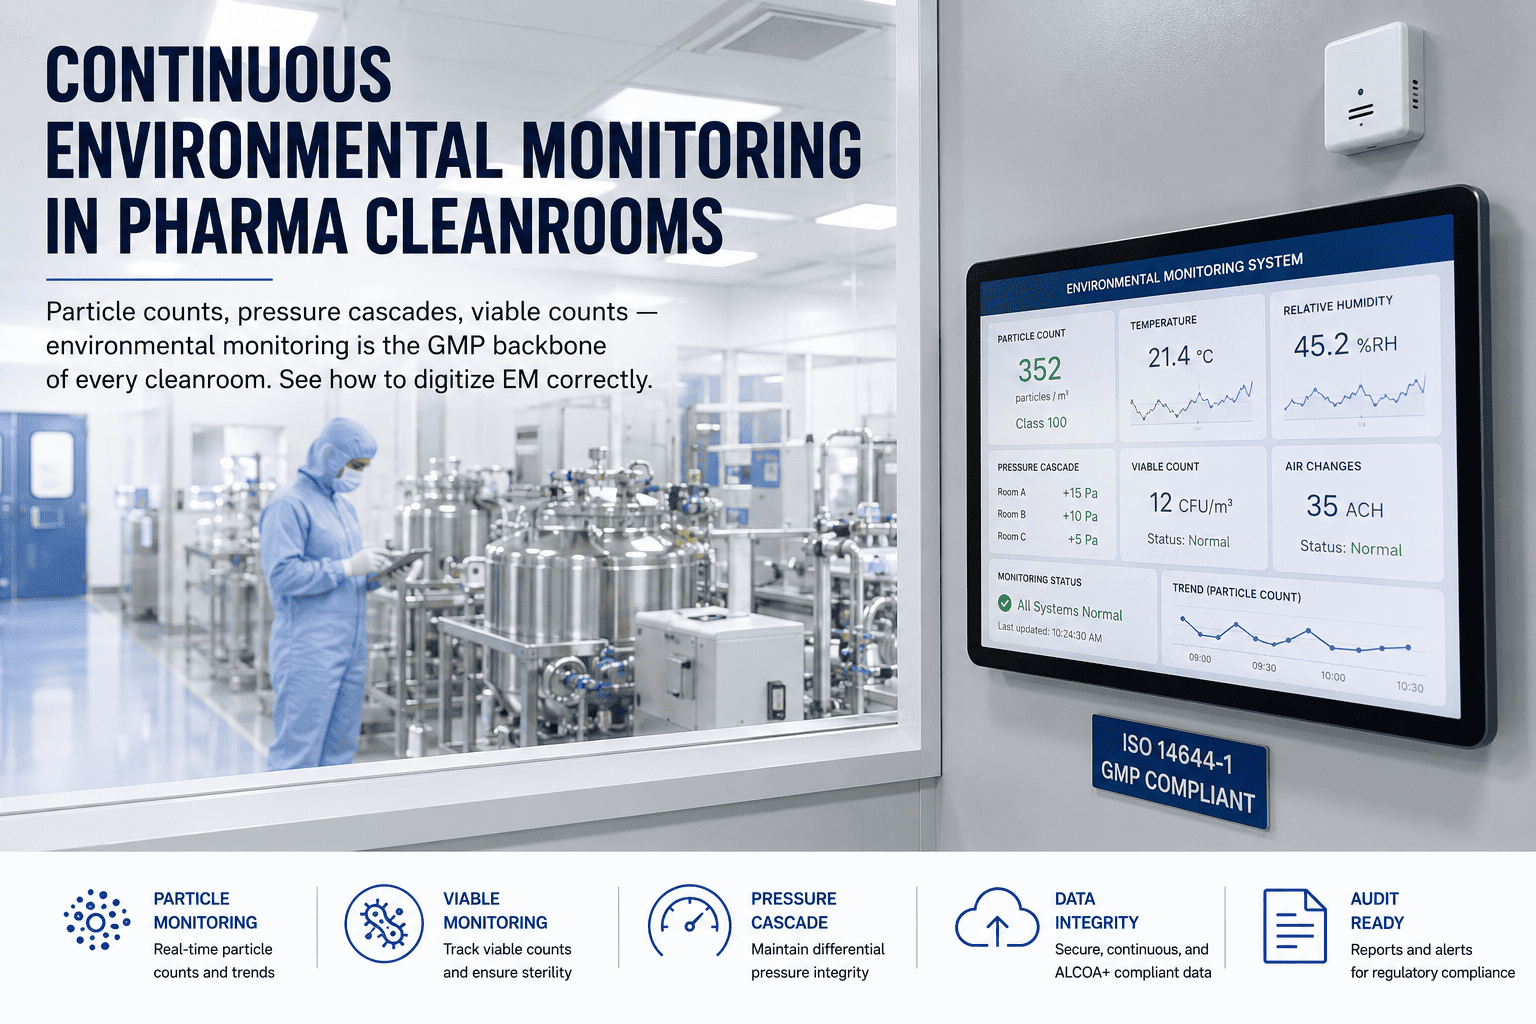
Every classified area sits at positive pressure to the next grade down — typically 10 to 15 Pascals per step. Lose the cascade and particles migrate the wrong way the moment a door opens. FDA warning letters routinely cite failures to investigate negative differential pressure events. Manual chart readings on a 4-hour cycle cannot see a 47-minute drift at 2 AM. Continuous monitoring can.
+15 Pa
Grade B
Sterile background
+15 Pa
+10 Pa
+10 Pa
Unclass.
External corridors
Where Cleanroom HVAC Actually Fails
Cleanroom HVAC does not fail once — it drifts. Four patterns account for almost every excursion that ends up in a deviation report, and every one of them is invisible to periodic BMS chart review. These are the failure modes iFactory learns to catch weeks before they become batch events.
Pattern 01
Silent Pressure Drift
Airlock seal wear, door interlock timing, exhaust damper stick. The Grade B to Grade C cascade slides from 15 Pa to 6 Pa over three weeks — nobody sees it because the BMS alarm threshold sits at 5 Pa.
Pattern 02
HEPA Loading Curve
Filter pressure drop climbs, fan speed compensates, air change rate holds — until the fan hits VFD ceiling and airflow drops overnight. The particle count spikes on the morning shift and nobody knows why.
Pattern 03
Chiller kW/ton Creep
Condenser tube fouling, refrigerant subcooling loss, oil charge degradation. Chiller efficiency erodes silently, the energy bill climbs $50k to $200k per year on a mid-size plant, and no one links the cost back to the chiller.
Pattern 04
AHU Coil & Humidity Loss
Cooling coil fouling shifts sensible-to-latent ratio, humidity control lags, RH excursions trigger deviation reports. Root cause traces back to coil cleaning that was skipped six months earlier.
Which of these patterns is quietly running in your plant right now? Book a demo and we'll walk your cleanroom asset list against live monitoring capabilities.
The Four Systems iFactory Watches Continuously
A pharma or chemical plant's cleanroom HVAC stack is four systems that must run in sync — and each has its own failure signature. iFactory ingests BMS, chiller controller, and cleanroom sensor telemetry into ensemble ML models trained on healthy-state behaviour, so drift shows up in the model long before it shows up in the deviation log.
Supply/return fan status, coil approach temperatures, filter dP, VFD speed, damper position, RH and temperature at supply and return. ML models flag coil fouling, belt wear, and control loop instability before airflow drifts.
Coil foulingFan healthACH stability
02
Chillers & Cooling Loops
Compressor discharge/suction pressure, condenser and evaporator approach, refrigerant subcooling and superheat, motor current signature, kW/ton, oil temperature. Predicts fouling and compressor wear 2 to 4 weeks ahead.
kW/ton driftRefrigerant lossFouling
Non-viable particle counts by size band, differential pressure per cascade step, temperature, RH, door-open events. Correlates each excursion with the AHU, chiller, or HEPA event that caused it.
Particle trendsDP alarmsDoor events
04
HEPA / ULPA Filter Bank
Filter dP vs baseline, VFD compensation headroom, projected life to changeout, integrity test schedule. Turns filter replacement from calendar-based to condition-based and eliminates surprise breakthrough events.
Loading curveLife predictionIntegrity
Compliance Map for Chemical and Pharma
Three frameworks govern cleanroom HVAC monitoring — and they overlap without being identical. Meeting one does not mean meeting the others. iFactory captures the data every framework wants in the format each auditor expects, so one monitoring platform covers all three.
EU GMP Annex 1
2022 revision
Continuous non-viable particle monitoring mandatory in Grade A and Grade B. Contamination Control Strategy (CCS) required across the facility. Alert limits at 90th percentile, action limits at 95th percentile of historical trends. 5 µm particle monitoring retained for Grade A and B despite ISO revisions.
FDA cGMP
21 CFR 210/211
Environmental control commensurate with process risk. Warning letters routinely cite failure to investigate negative pressure differentials, uninvestigated particle excursions, and inadequate HEPA integrity documentation. Data integrity per 21 CFR Part 11 for all captured records.
ISO 14644
Parts 1, 2, 3
Classification by particle concentration (ISO 1 to 9). Requalification every 6 months for ISO 5 and cleaner, every 12 months for ISO 6 through 9. ISO 14644-3 defines test methods for airflow, differential pressure, filter integrity, and airflow visualisation.
What a Single Cleanroom Excursion Actually Costs
The math on cleanroom HVAC failure is stark. A single Grade A excursion during aseptic filling can cost more than the entire monitoring program. And the recurring energy waste from a drifting chiller runs longer, quieter, and often larger over a year than any single event. This is what facilities engineers defend against.
$50k-$200k
Chiller efficiency drift
annual excess energy on a mid-size plant from silent kW/ton degradation
Batch loss
Single Grade A excursion
aseptic batches routinely written off after uninvestigated particle events
Warning letter
Undocumented pressure event
most common FDA citation pattern for cleanroom facilities
15x
Energy vs commercial
cleanroom HVAC intensity per ISPE / LBNL benchmark studies
What Live HVAC and Cleanroom Monitoring Shows
Facilities engineers spend most of their week chasing exceptions the BMS did not warn them about. iFactory turns that pattern inside out — every asset ranked by health state, every excursion traced back to its cause, and every framework's required record captured at the source, not reconstructed at audit time.
Health Ranked, All Assets
Every AHU, chiller, HEPA bank, and cleanroom ranked healthy, moderately stressed, highly stressed, or critical. Attention goes to what actually needs it, not what the schedule says.
Excursion Root Cause, Traced
Particle spike at 03:14. Correlated to Grade B door held open 4 minutes. Linked to AHU-3 damper hunting for 20 minutes prior. The deviation writes itself.
Energy Baseline, Live
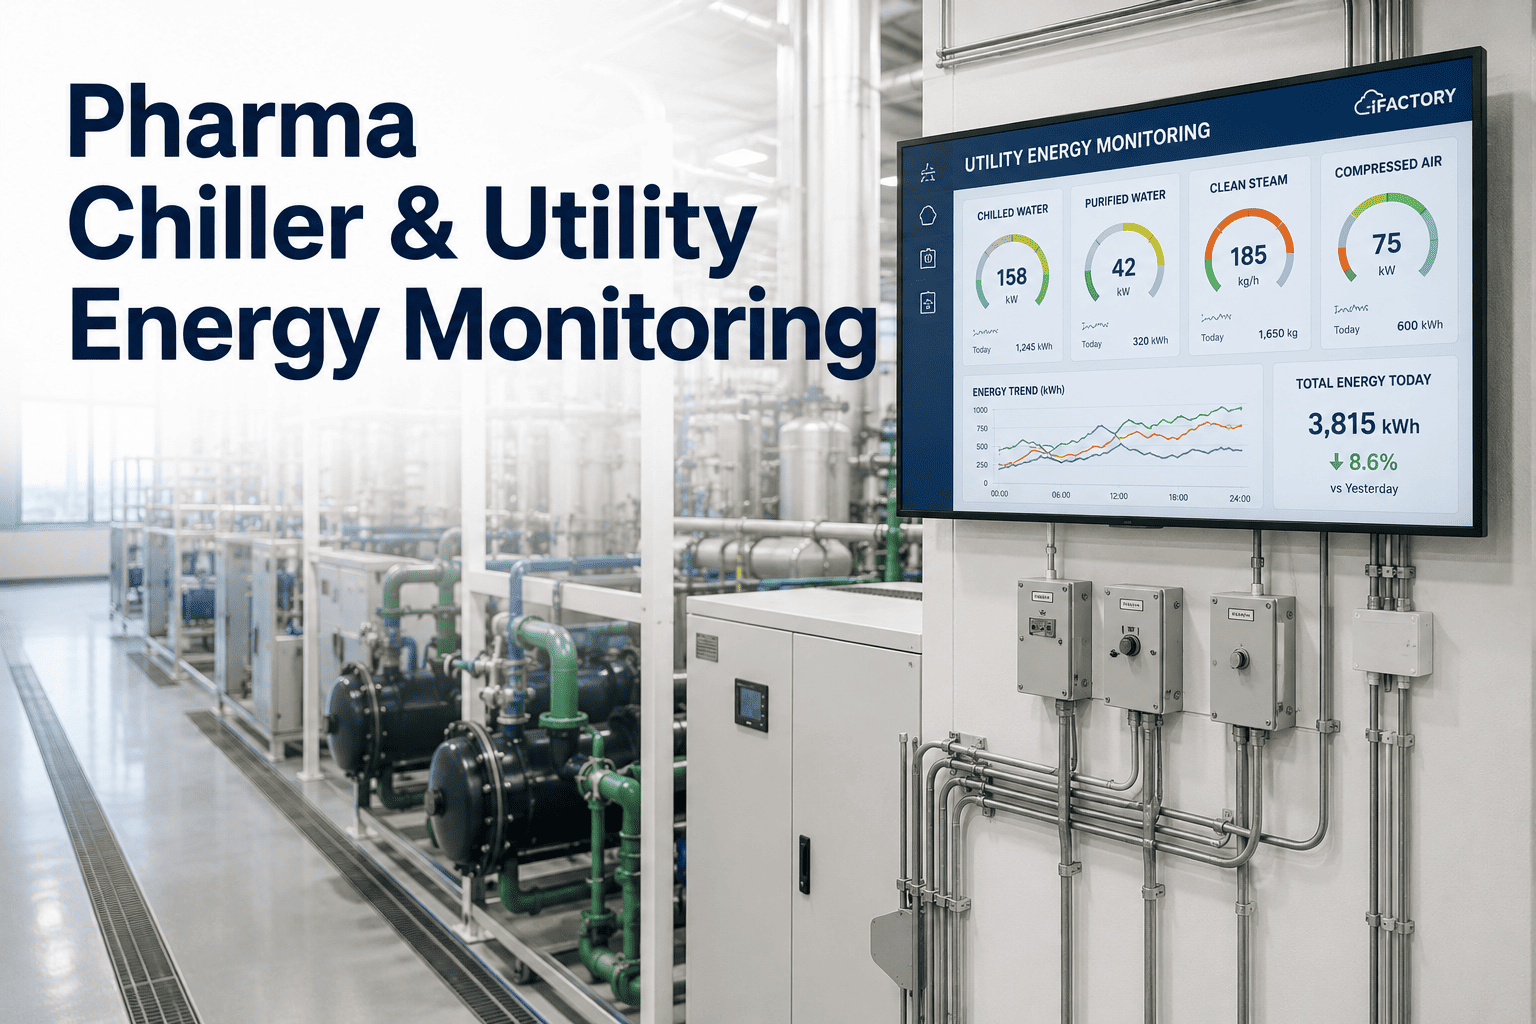
Chiller kW/ton, AHU fan power, and total HVAC load tracked against seasonal baseline. Silent drift shows up as a trend line long before it shows up on the utility bill.
GMP-Ready Records
Audit-grade event logs, 21 CFR Part 11 compliant records, requalification data trends per ISO 14644-2. Inspectors get the same view your engineers do.
Curious what your cleanroom HVAC looks like under continuous monitoring? Talk to our pharma team and walk through a live cleanroom dashboard.
On-Prem AI, Live in 6 to 12 Weeks
Cleanroom environmental data, deviation records, and process parameters are core GMP-regulated IP. The iFactory AI runs on a pre-configured edge server on-premise, with all processing inside your firewall and no external egress required to operate. It ships racked and ready with the software pre-loaded, and a structured deployment puts it live across your HVAC and cleanroom stack in a single quarter.
1
Rack the edge server
A pre-configured edge AI server slots into your plant, shipped pre-validated with the HVAC and cleanroom software pre-loaded.
2
Connect BMS & sensors
Read-only links to BMS, chiller plant manager, VFD drives, particle counters, and cleanroom sensors let the AI learn each asset's baseline.
3
Dashboards go live
HVAC health, cleanroom pressure cascades, and GMP-ready records run on-prem inside your firewall — your environmental data never leaves the plant.
What Live Cleanroom Monitoring Delivers
Moving from BMS chart review to continuous ML-driven HVAC and cleanroom monitoring converts directly into fewer excursions, less energy waste, and audit-readiness that does not need a two-week fire drill. These reflect outcomes pharma and chemical plants report in the first two quarters after go-live.
2-4wk
Early warning
chiller and AHU degradation flagged weeks before production impact
15-25%
HVAC energy
recoverable from chiller kW/ton drift and AHU control loop tuning
Zero
Uninvestigated excursions
every particle spike and DP event correlated to root cause automatically
Audit
Ready by default
Annex 1, FDA cGMP, ISO 14644 records captured at source
Frequently Asked Questions
Does iFactory replace our BMS or work alongside it?
iFactory sits on top of the BMS, not in place of it. Your BMS keeps control authority for HVAC operation. iFactory takes read-only telemetry — BMS points, chiller plant manager data, VFD registers, particle counters, cleanroom sensors — and adds ensemble ML models that flag degradation, correlate excursions, and produce GMP-ready records. Nothing on the control side changes.
How does iFactory support EU GMP Annex 1 continuous monitoring?
Annex 1 (2022) requires continuous non-viable particle monitoring in Grade A and Grade B areas as part of a documented Contamination Control Strategy. iFactory ingests particle counter data continuously, applies alert and action limits at your defined 90th and 95th percentile thresholds against rolling historical trends, and correlates every excursion to the HVAC event that likely caused it — the CCS documentation writes itself against real data instead of retrospective assumption.
What differential pressure signals are captured?
Every cascade step you monitor. iFactory tracks the pressure differential between adjacent classified zones continuously, alarms on drift below your specified threshold (typically 10 to 15 Pa per FDA guidance), timestamps every excursion, correlates with door-open events and AHU damper position, and records the whole chain as a single traceable event. This is the pattern most warning letters cite as missing.
Can we cover chemical plant HVAC and pharma cleanroom on the same platform?
Yes. Chemical intermediates, electronics chemicals, and pharma cleanrooms share the same underlying asset stack — AHUs, chillers, HEPA banks, differential pressure cascades. iFactory scales from a single ISO 8 support room up to multi-suite GMP facilities with Grade A isolators. One deployment covers process HVAC, comfort HVAC, and classified area monitoring under one health view.
Where does the data live, and how long to deploy?
Everything runs on-prem. The AI is delivered on a pre-configured edge server with software pre-loaded and no external egress required to operate. Cleanroom environmental data, deviation records, and process parameters stay inside your firewall. A structured deployment puts monitoring live in 6 to 12 weeks. The fastest way to see fit is a demo on your own asset list — book one and bring your BMS point count and cleanroom grade map.
See Every Excursion Before It Reaches the Batch Record.
Continuous Cleanroom HVAC Monitoring, On-Prem
Bring your BMS point list, chiller inventory, and cleanroom grade map. We'll show live monitoring across AHUs, chillers, HEPA banks, and pressure cascades — GMP-ready, audit-ready, live in 6 to 12 weeks.