A semiconductor fab is one of the most energy-hungry buildings humanity has ever operated, and the strangest part is how much of that energy it spends whether or not it is actually making chips. The cleanroom air handlers run at full force around the clock. Down in the sub-fab, a thousand vacuum pumps and gas abatement units run full-tilt whether the tool above them is processing a wafer or sitting idle. The energy per wafer is the number that decides both your cost and your carbon footprint, and it is quietly inflated by loads nobody is watching at the level where they can be fixed. Plant-wide energy visibility — cleanroom, tool, and utility, all on one map — is what turns that invisible spend into a managed one. An iFactory facility energy layer is where that map lives.
iFactory · Semiconductor Fab Energy
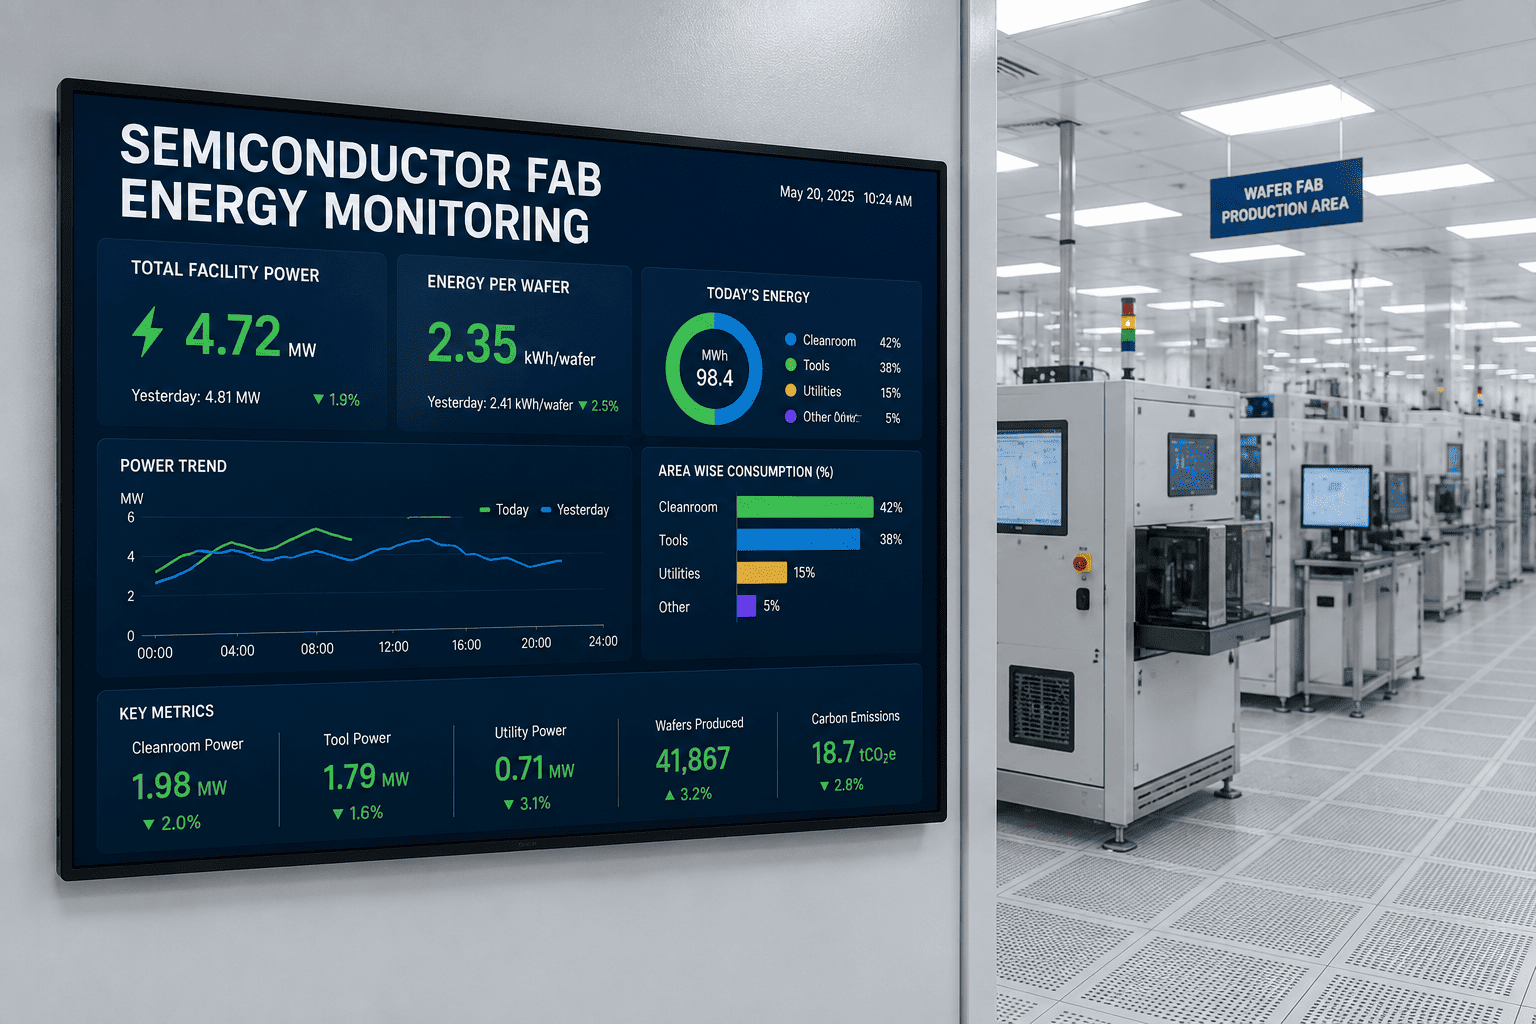
Fab Energy Monitoring: Cleanroom, Tool, and Utility on One Map
Fabs are among the most energy-intensive plants on earth, and much of the load runs whether or not a wafer is present. Monitor every layer of consumption and cut the energy per wafer without touching the process.
~57%
of fab power is facility systems
~40%
is the process tools
~25%
of total energy is vacuum pumps alone
24/7
cleanroom load, wafer or no wafer
Where a Fab's Energy Actually Goes
You cannot cut energy per wafer until you know where the kilowatt-hours live, and in a fab they split into two dominant blocks. Facility systems — the chiller plant, makeup and recirculation air, exhaust, gases, compressed dry air, process cooling water, vacuum, and ultra-pure water — take the largest share, around 57 percent. Process tools take most of the rest, roughly 40 percent. Everything else is a rounding error by comparison. Within the facility block, HVAC dominates, and cleanroom HVAC runs at roughly ten times the energy density of ordinary comfort air conditioning. That is the map. The savings live in reading it at the level of each system, not the plant total.
Facility systems ~57%
Process tools ~40%
Facility systems
Chiller plant · makeup & recirculation air · exhaust · process cooling water · ultra-pure water · vacuum · gases · compressed dry air
Process tools
Deposition, etch, litho, implant, CMP and the chambers that draw power directly at the point of processing
The Insight That Changes Everything: It Runs Whether or Not a Wafer Does
Here is the observation that reframes fab energy. Most process-support components run all the time — pumps, purge gas, water-bath heaters, abatement — maintaining a constant process environment regardless of whether the tool is actually processing wafers. Down in the sub-fab, vacuum pumps and abatement units are typically running at full power even when the tool above is idle for maintenance or waiting for the next lot. And the industry is cyclical: a fab's utilization can swing from over 90 percent down to 50. All those idle hours, the support systems keep burning full energy for wafers that are not there.
Tool idle
Pumps and abatement still at ~full power — energy spent on no wafer at all
Tool idle, with idle-mode control
Support systems throttled to what idle actually needs — the recoverable gap
The prize is large and well proven. Idle-mode control of abatement and dry pumps can cut their operating cost by around 10 percent even at high utilization, and far more during idle-heavy periods. One leading fab's sub-fab optimization saved over 13 million kilowatt-hours a year and cut carbon by thousands of tons — from a single fab. But you cannot throttle what you cannot see. The first step is always visibility down to the tool and the sub-fab unit.
The Three Layers to Monitor
Plant-wide visibility means metering three distinct layers, because the waste hides differently in each. A plant-level utility bill blends all three into one number you cannot act on. Separate them and each becomes a source of savings.
Cleanroom & Facility
~57% of fab energy
Chillers, makeup and recirculation air, exhaust, PCW, UPW. The biggest block, dominated by 24/7 HVAC. Watch for over-conditioning and free-cooling that goes unused.
Process Tools
~40% of fab energy
The deposition, etch, litho, and CMP chambers. Metering per tool reveals the outliers and the idle draw the plant average hides.
Sub-Fab Support
vacuum pumps ~25% of total
The pumps and abatement running full-tilt beneath the tools. The single richest, most-overlooked source of recoverable energy in the fab.
Want to see your fab split into these three layers, each metered and benchmarked? Talk to a fab energy specialist and we will baseline one bay on your data.
The Metric That Ties It Together: Energy per Wafer
All of this rolls up into one number that fab management actually lives by: energy per wafer. It is expressed two ways — energy per unit of wafer area, and energy per unit of production — and it is the honest measure of both cost and sustainability, because it normalizes for how much you actually made. Total consumption can look flat while energy per wafer climbs, if output slipped or idle waste grew. Monitoring drives this number down by attacking the loads that consume energy without producing wafers.
kWh / cm²
Per wafer area
Energy normalized to the silicon area processed — the classic fab benchmark, historically trending down as fabs improve.
kWh / UoP
Per unit of production
Energy per finished unit — ties consumption directly to output and to the cost of every wafer that ships.
Live
Not a monthly bill
Tracked continuously against target so a climbing energy-per-wafer is caught while it is happening, not at month-end.
What Plant-Wide Visibility Changes
Moving from one blended utility bill to a live, layered energy map changes what a fab team can actually do about consumption.
One plant-level kWh number on the bill
becomes
Energy split by cleanroom, tool, and sub-fab
Idle pumps and abatement burning full power
becomes
Idle draw surfaced and ready to throttle
Energy per wafer known at month-end
becomes
Energy per wafer tracked live against target
A high-draw tool hidden in the average
becomes
The outlier tool named and ranked
Carbon reporting assembled by hand
becomes
Emissions derived straight from live energy data
Want every tool and sub-fab unit on one live energy map with per-wafer KPIs? Book a demo and we will scope it to your fab.
Frequently Asked Questions
Where does most of a fab's energy actually go?
Two blocks dominate. Facility systems — chillers, makeup and recirculation air, exhaust, process cooling water, ultra-pure water, vacuum, and gases — take the largest share at around 57 percent, with HVAC the biggest slice inside that. Process tools take roughly 40 percent. Cleanroom HVAC alone runs at about ten times the energy density of ordinary comfort air conditioning, which is why the facility block is so large.
Why is the sub-fab such a big opportunity?
Because sub-fab support systems — vacuum pumps and gas abatement in particular — traditionally run at full power regardless of whether the tool above is processing wafers. Vacuum pumps alone can account for around a quarter of total fab energy. Since fab utilization is cyclical and can drop well below full, a great deal of that energy is spent maintaining readiness for wafers that are not currently there.
How much can idle-mode control really save?
Throttling abatement and dry pumps toward what idle actually requires can cut their operating cost by around 10 percent even at high utilization, and considerably more during idle-heavy periods. Real fab deployments of sub-fab optimization have reported savings of over 13 million kilowatt-hours a year and thousands of tons of carbon from a single fab. The precondition is visibility down to the individual tool and sub-fab unit.
What is "energy per wafer" and why track it live?
It is fab energy normalized to output — expressed as energy per wafer area (kWh/cm²) or per unit of production (kWh/UoP). It is the honest measure of both cost and sustainability because it accounts for how much you actually made. Tracked live rather than at month-end, it catches a climbing energy-per-wafer while you can still act, instead of explaining it after the bill arrives.
Do we have to touch the process to save energy?
No, and that is the point. The largest recoverable savings come from loads that do not affect the wafer at all — over-conditioned cleanroom air, unused free-cooling, and sub-fab support running full-tilt while idle. Monitoring targets exactly those. A facility energy layer over your existing metering and building systems gives the visibility without altering a single process recipe.
The biggest energy load in the plant is also the least watched.
See Your Fab's Energy per Wafer — Layer by Layer
Bring one bay. We will meter cleanroom, tool, and sub-fab energy, surface the idle draw and over-conditioning your utility bill hides, and roll it all into a live energy-per-wafer KPI tracked against target. Turnkey facility energy monitoring over your existing metering and building systems — no process changes, emissions reporting built in. Live in weeks, not quarters.
3
layers: cleanroom, tool, sub-fab
Per-wafer
KPI, tracked live
0
process changes required
Weeks
to live on your metering