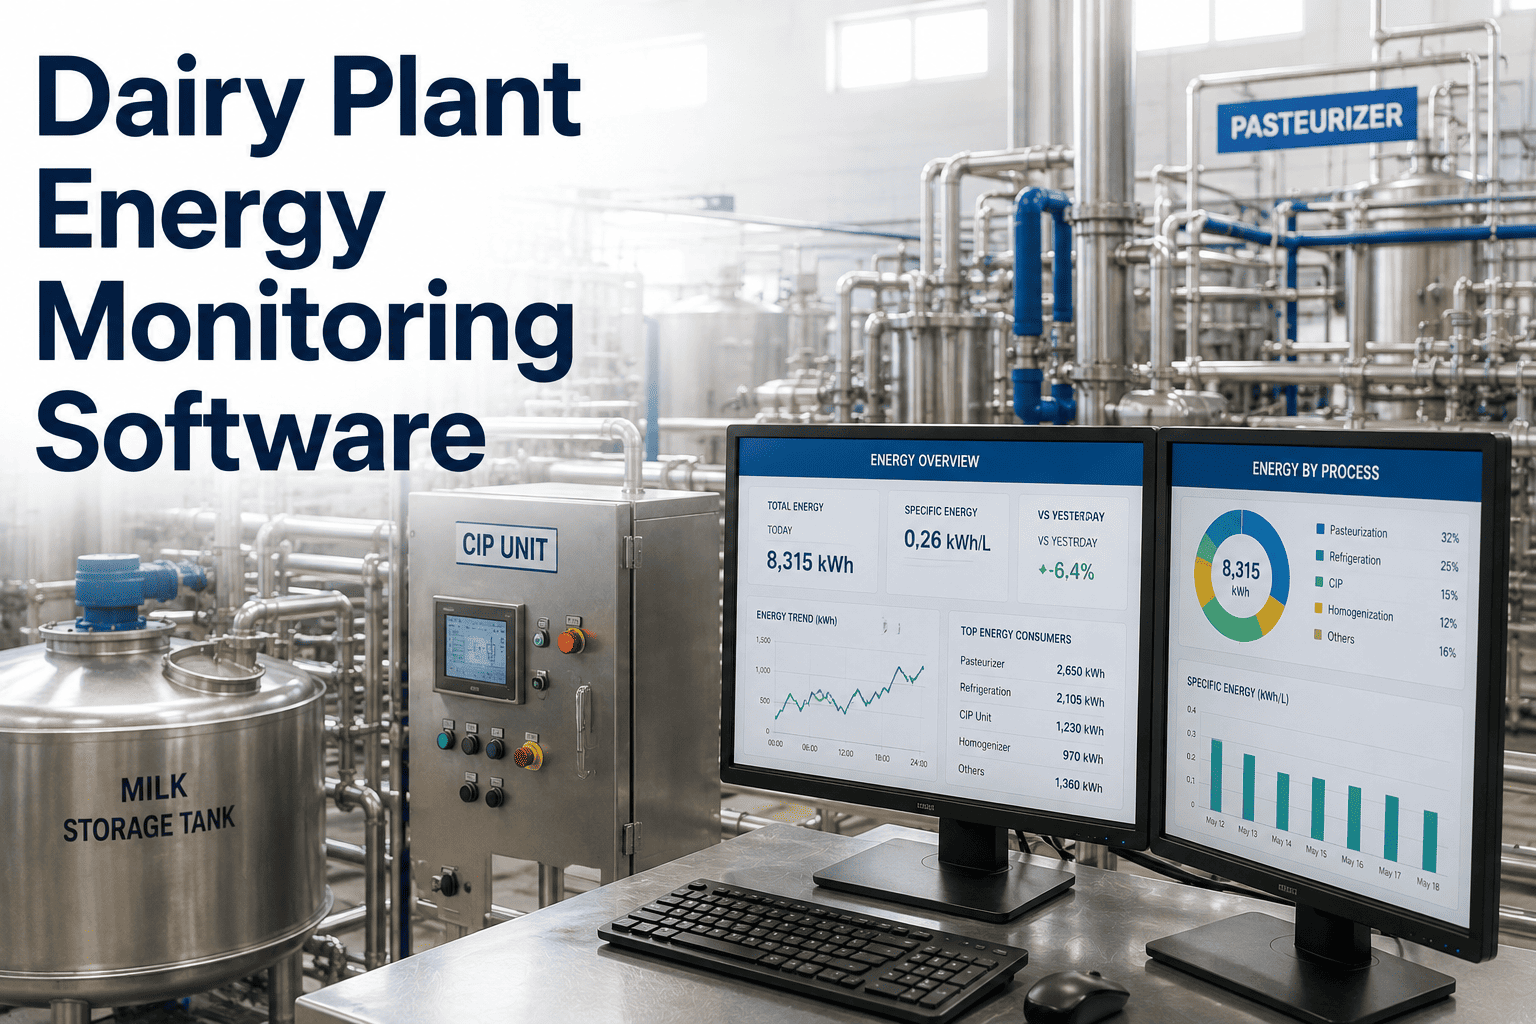
In a dairy plant, energy is heat and cold in constant tension — milk pasteurized above 72°C, then chilled back to 4°C, cleaned with hot caustic, and held cold through storage, with steam and refrigeration running against each other all day. Up to 70 percent of a dairy operation's total energy is tied to thermal processes: pasteurization, UHT, evaporation, and CIP. Yet most plants manage all of it off a single utility meter that can't say whether the pasteurizer's regeneration section is under-recovering, the refrigeration plant is running colder than product needs, or CIP is heating far more water than the clean requires. The waste is real and specific — a degraded plate-heat-exchanger regeneration section quietly forces the boiler and chiller to do work the process should have recovered, and nobody sees it because the milk still hits temperature and the invoice still gets paid. Process energy analytics changes that: it measures energy where it's consumed, normalizes it per liter of milk processed, and surfaces the thermal and refrigeration waste while it's still recoverable. To see it running across pasteurization, homogenization, refrigeration, and CIP, book a demo.
FOOD & BEVERAGE · DAIRY PLANT ENERGY MONITORING
Heat and Cold, Measured Per Liter — Not Guessed From One Meter.
Pasteurization, homogenization, refrigeration, and CIP each waste energy in their own way, and a plant-level meter hides all of it. iFactory's process energy analytics tracks thermal and refrigeration energy per process and per liter of milk, surfacing under-recovering regeneration, over-cold chilling, and over-heated CIP in real time — so the energy team cuts waste without ever touching product safety.
up to 70%
Of dairy energy tied to thermal processes
72°C → 4°C
The heat-then-chill cycle every liter goes through
25–50%
Pump and fan energy recoverable with variable speed drives
4 systems
Steam, refrigeration, electricity, and water to resolve
Why Dairy Energy Waste Hides in Plain Sight
Dairy processing is a constant interplay of heat-intensive operations — pasteurization, homogenization, drying, refrigeration — and the energy for all of them is usually managed as bulk utility generation: so much steam, so much electricity, so much refrigeration, billed monthly. That framing works for accounting and fails for efficiency, because it can't see which process is wasting. A pasteurizer whose regeneration section has drifted, a refrigeration plant holding an unnecessarily low setpoint, a CIP cycle over-heating and over-running its water — each passes every quality and safety check while consuming far more energy than the process needs. The plant is producing safe product efficiently by every measure it watches, and inefficiently by the measures it doesn't.
One Meter Can't See the Process
Steam, refrigeration, and electricity get summed into utility totals, so waste in the pasteurizer, the chiller, or the CIP skid disappears into an aggregate. The single biggest step in reducing energy is knowing which devices are the significant users — and a bulk meter can't tell you, so the losses stay unattributable.
Safe Doesn't Mean Efficient
A pasteurizer can hit its legally required time-temperature perfectly while its regeneration section under-recovers heat, and a cold store can hold product safely while running colder than it needs to. The safety interlocks watch the quality-critical setpoints, not the energy cost of holding them — so thermal waste never registers as a problem the plant is built to catch.
Heat and Cold Fight Each Other
Every liter is heated to pasteurize then chilled to store, and without visibility the two systems work against each other — the boiler adding heat the regeneration section should have recovered, the refrigeration plant removing heat that could have pre-warmed incoming product. Uncoordinated, the plant pays twice for energy it could have moved from one stream to another.
Waste Streams Go Unused
Dairy processing produces heat in excess — pasteurization cool-down, evaporator condensate, refrigeration reject — and much of it is simply vented or dumped because no one is measuring it. That unused waste heat is recoverable energy leaving the building, invisible on a meter that only counts what's purchased, not what's thrown away.
A utility failure in dairy is uniquely unforgiving — if refrigeration goes down, product spoils within hours; if steam fails mid-pasteurization, the batch is discarded. That criticality makes plants run these systems conservatively, with generous margins that are safe but energy-hungry. Visibility into where the real margin sits is what lets a plant tighten it without ever risking the product.
The Four Processes That Drive the Meter
Effective dairy energy monitoring treats each major process as its own consumer with its own efficiency signature and its own recoverable waste. These four dominate a milk or cheese plant's energy footprint, and each fails toward waste in a characteristic way that only per-process measurement can surface.
PASTEURIZATION
Regeneration efficiency
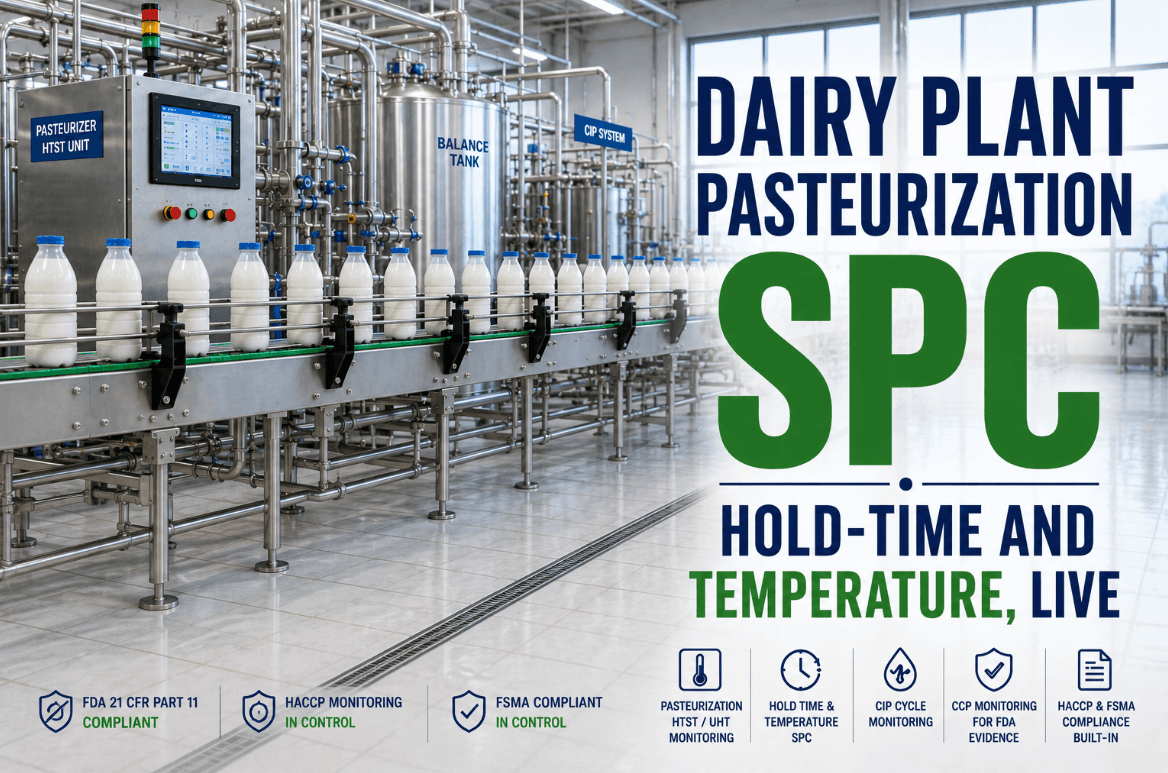
HTST pasteurization holds milk above 72°C for at least 15 seconds; UHT drives it past 135°C. The plate heat exchanger's regeneration section is the key efficiency lever — it uses outgoing hot pasteurized milk to pre-heat incoming cold milk, recovering a large share of the thermal load before the steam-fed final heating section tops it up through an intermediate hot-water loop. When regeneration efficiency drifts down from fouling or fouled plates, the boiler quietly makes up the difference and the refrigeration plant re-removes it — a double penalty that per-process monitoring catches by trending recovery against baseline.
REFRIGERATION
Setpoint & compressor efficiency
Refrigeration is one of the largest energy consumers in any dairy plant, chilling milk to 4°C and holding cold storage continuously, and it's the utility whose failure spoils product within hours — so it tends to run conservatively cold. Compressor efficiency, condenser condition, and setpoint discipline are the levers: even a modest setpoint optimization or a plate-cooler pre-cool cuts significant load, and refrigeration heat-recovery can turn reject heat into hot water instead of dumping it. Monitoring compressor kW against cooling load reveals where the plant is over-cooling or where a fouled condenser is inflating the draw.
CIP (CLEAN-IN-PLACE)
Water heating & cycle time
Cleaning-in-place is a hidden energy heavyweight — it heats large volumes of caustic and rinse water to temperature and runs on every changeover and shift. The waste modes are over-heating, over-running cycle times, and single-use water: reusing final-rinse water for the next pre-rinse saves both the water and the energy to heat it, and right-sizing cycle temperature and duration to the actual soil trims a recurring daily draw. Because CIP runs constantly and quietly, monitoring its energy per cycle surfaces savings a production-focused view never looks at.
HOMOGENIZATION & DRIVES
Motor load & VFD opportunity
Almost all dairy products are homogenized, forcing milk through high-pressure valves to disperse fat — an electrically intensive mechanical step — alongside the pumps, separators, agitators, and fans that move product and air throughout the plant. Here the biggest lever is matching motor speed to actual demand: variable frequency drives on pumps and fans deliver 25 to 50 percent energy savings, and even more on vacuum duty. Submetering motor loads against throughput reveals which drives run flat-out when they could modulate, and where a VFD retrofit pays back fastest.
Find the Thermal and Refrigeration Waste in Your Plant
Bring your process layout and a recent energy bill to the call. iFactory engineers will show how per-process analytics resolve pasteurization, refrigeration, and CIP into energy per liter — and where under-recovered heat or over-cold chilling is inflating your cost per liter of milk.
Process Energy Analytics: Energy Per Liter, Per Process
The core shift is from bulk utility totals to per-process measurement expressed in the unit that matters — energy per liter of milk processed, attributed to the specific process that consumed it. That attribution is what turns dairy energy from an undiagnosable monthly figure into a managed, process-level metric, and it's what makes every efficiency lever measurable.
01
Meter Each Process Separately
Pasteurization steam, refrigeration compressors, CIP heating, and homogenizer and pump drives are measured individually, so consumption is captured where it happens rather than summed into a utility total. Each process becomes its own tracked consumer, the precondition for attributing any deviation to a cause.
02
Normalize to Energy Per Liter
Raw steam and kW figures mean little without production context, so energy is expressed per liter of milk processed against live throughput — the metric that ties directly to product economics and makes consumption comparable across shifts, products, and lines.
03
Baseline Each Process
Each process's efficient energy-per-liter is established as its documented baseline — pasteurizer regeneration recovery, refrigeration kW per cooling load, CIP energy per cycle — so the system knows what good looks like and can flag drift against a real reference rather than a guess.
04
Detect Drift and Attribute It
When a process climbs above its baseline, the system flags which one and by how much — regeneration efficiency slipping, a compressor drawing more per ton of cooling, a CIP cycle over-heating. The overconsumption becomes a specific, attributable, actionable signal instead of a mystery in the monthly total.
Because heating and cooling are inherent to milk processing, the analytics don't just measure each process in isolation — they surface where residual energy streams could be harnessed, capturing waste heat from pasteurization to pre-heat boiler make-up water or feed the next process, turning two separate energy costs into one recovered stream.
The Biggest Lever: Heat Recovery and Regeneration
In a plant where up to 70 percent of energy is thermal, the largest single opportunity isn't using less heat — it's reusing the heat already in the building. Dairy processing has heat in excess, and most of it is recoverable. Process energy analytics is what makes that recoverable heat visible and its recovery measurable.
RECOVER
Regeneration & Waste-Heat Capture
The pasteurizer's regeneration section already recovers heat from outgoing to incoming milk, and plate heat exchangers extend that principle plant-wide — recovering heat that would otherwise load both boiler and chiller. Waste streams from the heat-intensive pasteurization process can be captured to pre-heat boiler make-up water or warm ambient spaces, and refrigeration reject heat can heat CIP and process water instead of being dumped. Monitoring recovery efficiency is what keeps these systems performing rather than silently degrading.
REDUCE
Right-Sized Setpoints & Drives
Beyond recovery, visibility enables reduction that never touches product safety: trimming a refrigeration setpoint that runs colder than product requires, right-sizing CIP temperature and cycle time to actual soil, and matching motor speed to demand with variable frequency drives for 25 to 50 percent savings on pumps and fans. Each is a lever the analytics quantify against baseline, so the saving is verified rather than assumed — and every one is framed against the food-safety constraint it must respect.
The pattern is consistent across dairy: the biggest wins come from heat that was already there and processes everyone assumed were fine because they never failed a safety check. Analytics doesn't make the plant more efficient by itself — it makes the inefficiency and the recoverable heat visible, which is the precondition for every saving that follows.
Monitoring That Never Risks Product Safety
In a dairy plant, no energy initiative is worth compromising food safety or product quality — and a well-designed analytics layer never asks you to. It observes and analyzes; it doesn't sit in the pasteurization control loop or move a safety-critical setpoint. That separation is what makes energy optimization safe in a food-processing environment.
Analytics, Not Control
The platform reads process energy data and surfaces inefficiency, but it doesn't take control of the pasteurizer, the refrigeration plant, or the CIP skid. Optimization comes to the energy team and maintenance planner as insights and work orders, leaving the validated safety controls and time-temperature interlocks completely untouched.
Food Safety Comes First
Every efficiency recommendation is framed against the food-safety requirement it must respect — the pasteurization time-temperature that can't be relaxed, the cold-chain limit that protects product, the CIP efficacy that prevents contamination. The objective is the lowest energy that still fully protects safety, never savings that trade against it.
Turnkey, On-Premise, Built for the Plant Floor
Dairy plants run mixed equipment and can't pause production for an IT project, so iFactory ships as a turnkey system that reads existing instrumentation, runs on-premise inside your network, and layers onto the plant you already operate.
1
Reads Existing Meters and Sensors
The platform ingests steam, refrigeration, electrical, and flow data from your existing instrumentation and controls, adding submeter points only where a real gap exists — connecting to the plant you already run rather than requiring a rebuild.
2
Baselines Your Actual Process
During a short learning phase, the system baselines the real energy signature of your pasteurization, refrigeration, CIP, and drive loads across your specific products and recipes — so the analytics fit your operation, not a generic dairy template.
3
Runs On-Premise, Inside Your Firewall
Analytics run on-premise within your own network, so production and energy data stays inside the plant with no cloud dependency or data egress — keeping your operational data sovereign and the monitoring resilient regardless of connectivity.
4
Work Orders and Verified Savings
Anomaly-triggered work orders route to maintenance with energy context attached, and post-intervention verification quantifies each saving against the pre-fault baseline — closing the loop between energy analytics and the maintenance action that captures the value.
What Changes for the Energy Team
Process energy analytics changes the dairy energy team's job from explaining last month's utility bill to managing this shift's consumption — from a reactive role to a proactive, data-backed one that finally sees inside each process.
01
Every Process Has an Energy Number
Instead of one utility bill, pasteurization, refrigeration, CIP, and drives each carry their own energy-per-liter against a baseline, so an under-recovering regeneration section or an over-cold chiller is a specific signal. Diagnosis replaces guesswork at the aggregate level.
02
Recoverable Heat Becomes Visible
The waste heat that used to be vented or dumped is now measured, so the team can target regeneration, heat recovery, and stream reuse with real numbers rather than intuition — turning the plant's excess heat into a managed asset instead of a loss.
03
Savings Are Verified, Not Assumed
Post-intervention consumption measured against baseline gives every energy action a proven saving in energy per liter, turning maintenance and efficiency work from a cost argument into a documented ROI record — and generating the audit trail that sustainability and ESG reporting increasingly demand.
04
Efficiency Stops Fighting Safety
Because recommendations are framed against the food-safety limit they must respect, the team pursues savings without ever risking the cold chain or the pasteurization requirement — ending the false trade-off between running efficient and running safe that used to stall every energy project.
Frequently Asked Questions
The questions dairy energy and plant engineers ask most often when evaluating process energy analytics.
We already track our utility bills. Why monitor energy per process?
Because a utility bill tells you the plant spent more, not which process caused it. Steam, refrigeration, and electricity get summed into totals that blend the pasteurizer, the chiller, the CIP skid, and the drives so completely that drift in any one is invisible until it's large enough to move the whole bill — by which point months of waste are spent and untraceable. The single most important step in reducing dairy energy is knowing which devices are the significant users, and only per-process measurement expressed as energy per liter can tell you. That attribution turns an inefficient process into a specific, actionable signal rather than a mystery in the aggregate, which is the precondition for every saving. To see per-process resolution on your plant,
book a demo.
Will energy monitoring interfere with pasteurization or food safety controls?
No — it's designed as an observation and analytics layer that sits entirely outside the control loop. The platform reads process energy data through your existing meters and sensors and surfaces inefficiency, but it never takes control of the pasteurizer, refrigeration plant, or CIP system, and it doesn't move any safety-critical setpoint or time-temperature interlock. Optimization comes to your team as recommendations and work orders, leaving the validated food-safety controls completely untouched. Every recommendation is also framed against the safety requirement it must respect — the pasteurization time-temperature that can't be relaxed, the cold-chain limit, the CIP efficacy — so the objective is always the lowest energy that still fully protects product safety. Monitoring makes the energy cost of safety visible; it never trades against safety itself.
Where do the biggest dairy energy savings usually come from?
From heat recovery and regeneration, because up to 70 percent of dairy energy is thermal and much of that heat is already in the building waiting to be reused. The pasteurizer's regeneration section, plant-wide plate heat exchangers, capturing pasteurization waste heat to pre-heat boiler make-up water, and using refrigeration reject heat for CIP and process water all recover energy that would otherwise load both boiler and chiller. After recovery, the next tier is right-sizing: trimming a refrigeration setpoint that runs colder than product needs, matching motor speed to demand with variable frequency drives for 25 to 50 percent savings on pumps and fans, and optimizing CIP temperature and cycle time. The exact mix depends on your plant, and because every lever is measured against a baseline, the savings are verified rather than estimated. Analytics makes both the recoverable heat and the over-provisioned processes visible so you can act on them.
How does CIP fit into energy monitoring?
CIP is a hidden energy heavyweight that a production-focused view rarely examines, which makes it one of the more rewarding things to monitor. Cleaning-in-place heats large volumes of caustic and rinse water to temperature and runs on every changeover and shift, so its recurring daily energy draw is substantial. The common waste modes are over-heating the cleaning solution, over-running cycle times beyond what the actual soil requires, and using fresh heated water for every step. Monitoring energy per CIP cycle surfaces these directly — and simple changes like reusing final-rinse water for the next pre-rinse save both the water and the energy to heat it, while right-sizing temperature and duration trims the draw without compromising cleaning efficacy. Because CIP runs constantly and quietly in the background, it's exactly the kind of process that per-cycle energy visibility improves most, and it's often overlooked entirely without it.
Does our production and energy data leave the plant?
No — the platform is turnkey and fully on-premise, running inside your own network with no cloud dependency and no data egress. For a dairy processor, production data, recipes, and energy profiles are competitively sensitive, and a sovereign, on-site architecture keeps them entirely within your firewall rather than shipping them to a vendor environment. The system reads your existing meters and controls locally, runs its analytics on-premise, and routes anomaly-triggered work orders into your maintenance workflow without depending on external connectivity. This matters both for data security and for the resilience continuous dairy production demands — the monitoring keeps working regardless of internet availability, and nothing about your plant's energy profile, production rates, or process configuration leaves the building. Contact
iFactory support to review the on-premise deployment for your site.
STOP MANAGING DAIRY ENERGY OFF A MONTHLY UTILITY BILL
See Every Process's Energy Per Liter — Pasteurization, Refrigeration, CIP, and Drives.
Per-process thermal and refrigeration analytics, energy normalized per liter of milk, regeneration and heat-recovery visibility, and verified savings — with anomaly-triggered work orders and food safety respected at every step. Turnkey, on-premise, inside your firewall. Turn the four processes that dominate your meter from black boxes into managed, provable costs per liter.