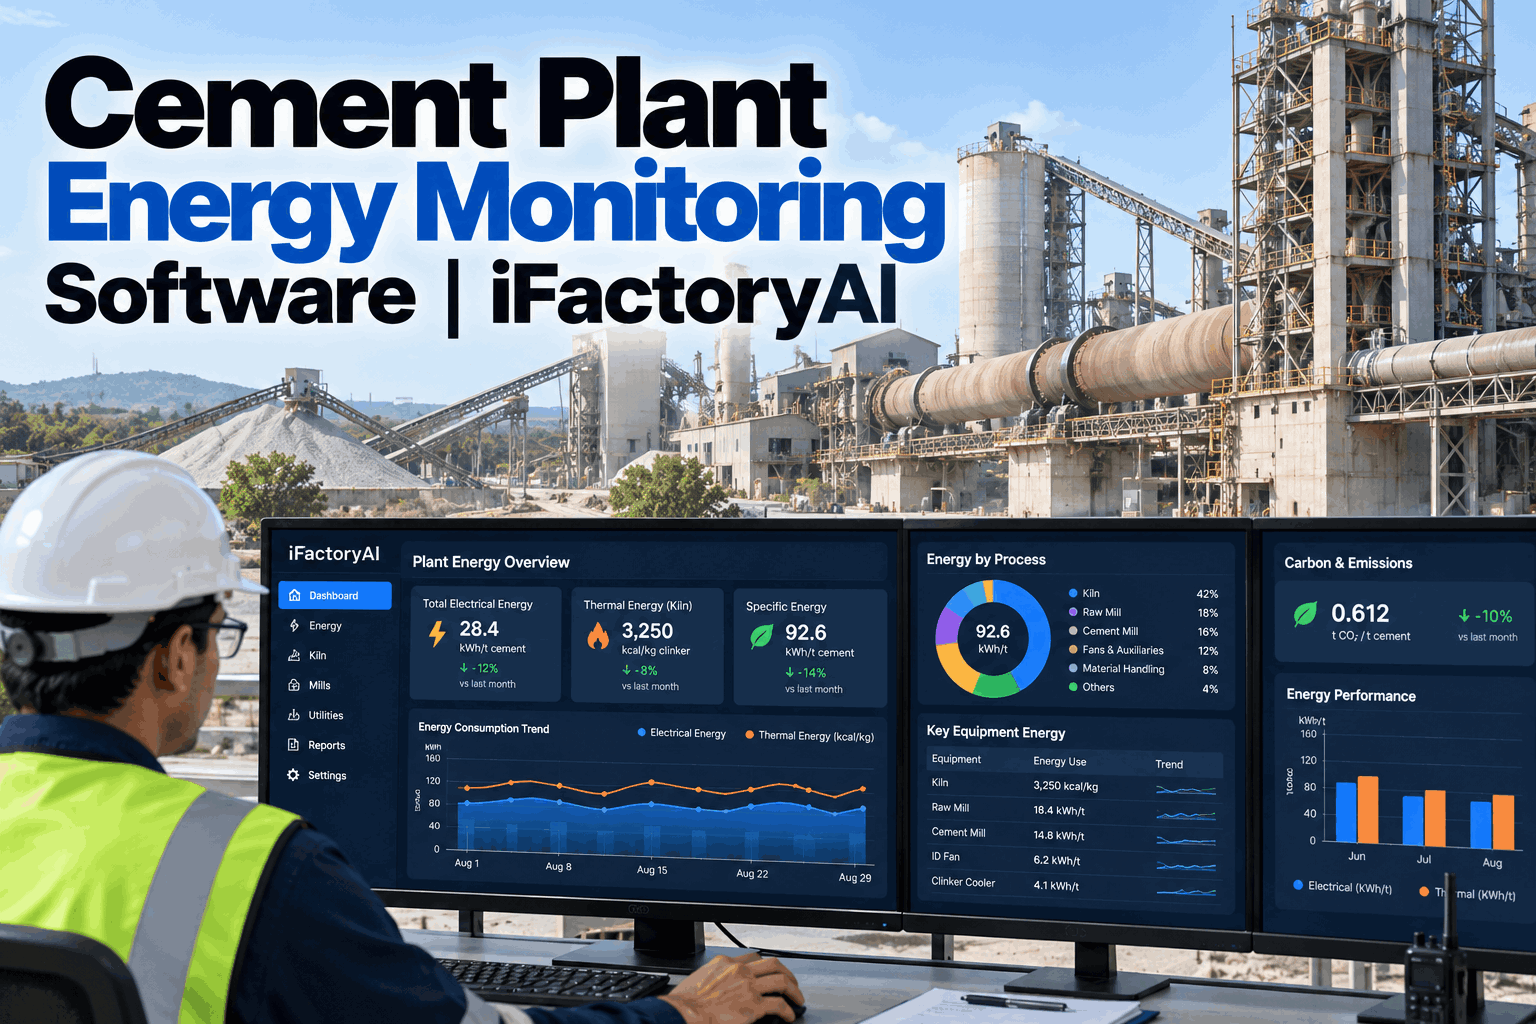
Most cement plants know their monthly energy bill to the last unit. Far fewer know which mill wasted power on the night shift or how much extra heat the kiln burned after a cooler upset. This guide shows how plant-wide energy monitoring turns kiln, mill and clinker data into per-tonne numbers you can act on each shift. Start with an energy review.
Cement Plant Energy Monitoring Software
See thermal and electrical energy per tonne, area by area and shift by shift. Find the kiln, mill or fan that drifted, fix it before the month closes and report carbon from the same trusted data.
- Thermal and electrical energy per tonne, live
- Kiln, mill and fan losses found within the shift
- Carbon reporting built on metered data
Why a Monthly Energy Number Hides the Losses
By the time the bill arrives, the shift that wasted the energy is long forgotten.
Many plants still report energy as a single monthly figure: total fuel, total power, total tonnes. That number shows the trend but hides the cause. A mill that ran 10% heavy for three nights, a kiln that burned extra fuel after a feed upset or a fan left at full speed during a stop all disappear into the average. Monitoring changes the unit of control from the month to the shift and from the plant to the machine. Our energy engineers can show where your averages hide the most.
Thermal intensity
Fuel heat per tonne of clinker. Shows kiln, preheater and cooler efficiency.
Electrical intensity
Power per tonne, split by area. Shows mills, fans and transport efficiency.
Carbon intensity
Process, fuel and power emissions per tonne. Shows the carbon result of both.
Total energy rises when output rises, which tells you nothing. Specific energy, per tonne of clinker or cement, is the number that shows whether the plant is getting better or worse.
Where the Energy Goes in a Cement Plant
Heat lives in the kiln line. Power lives in the mills and fans.
Cement uses two kinds of energy in very different places. The kiln system takes most of the fuel, while grinding takes most of the electricity. A useful monitoring plan follows the material from quarry to bag and meters each step that matters. To plan which areas to meter first, book a metering plan session.
Crusher
Lower share, but sensitive to feed size and idle running.
Raw mill
Large motor and fan load, driven by moisture and fineness.
Preheater and kiln
Most of the fuel, plus ID fan and kiln drive power.
Clinker cooler
Heat recovery and cooling fan power.
Cement mill
Often the single largest power user in the plant.
Packing and dispatch
Small share, but fans and compressors run long hours.
The rest goes into the chemical reactions that make clinker and other smaller losses. Exhaust gas is usually the biggest single place to look.
Kiln heat depends on the preheater, the burner and the cooler working together. A cooler that recovers less heat sends cooler secondary air to the kiln, so the burner adds fuel. Meter the whole line together, or a cooler problem will look like a burner problem.
Build a Metering Hierarchy That Explains Itself
Meters should answer one question: why did energy per tonne change?
A plant meter tells you that energy changed. Department and equipment meters tell you where. Process variables, such as feed rate, fineness, moisture and oxygen, tell you why. When all four levels sit in one system, a rise in kWh per tonne points to a cause instead of starting a hunt. Our metering team can help design the levels.
A mill grinding a finer cement will always use more power. Track kWh per tonne by cement type and fineness, or a better recipe will look like worse efficiency.
What Per-Tonne Visibility Is Worth
Small per-tonne gains look minor on a single shift. Multiplied across a year of clinker and cement, they become one of the largest savings a plant can find without new equipment.
Carbon Reporting From the Same Data
The meters that cut energy also prove your emissions.
Cement emissions come from three sources: the chemistry of calcination, the fuel burned in the kiln and the electricity bought from the grid. Energy monitoring already measures two of the three directly, and clinker output gives the third. When customers, lenders or regulators ask for carbon per tonne, the answer comes from metered data instead of yearly estimates. To check your carbon data path, book a carbon data review.
Calcination
CO2 released when limestone becomes lime. Tied to clinker output and the clinker share in cement.
Kiln and drying
CO2 from coal, petcoke, gas, biomass and waste-derived fuels, based on metered fuel flow and fuel analysis.
Purchased electricity
Indirect emissions from grid power, based on metered kWh and the grid factor.
The EU Carbon Border Adjustment Mechanism moved into its definitive regime on 1 January 2026, and cement is a covered product. Importers need embedded emissions confirmed by accredited verifiers, so producers selling into the EU are being asked for credible, metered carbon data.
Because calcination emissions come with every tonne of clinker, the share of clinker in each cement type matters as much as kiln efficiency. Tracking clinker factor alongside energy per tonne shows the full carbon effect of recipe changes, not only fuel savings.
From Visibility to Action on Every Shift
A dashboard nobody acts on saves nothing.
The value of monitoring comes from what happens after a number moves. Good systems spot the drift, point to the likely cause and route it to the person who can fix it. Questions about alert design go to our support desk.
Often false air, cooler upsets or feed changes. Check O2 and cooler air first.
Often separator settings, wear or feed size. Compare with the best shift at the same fineness.
Often damper position or build-up. Check pressure loss across the circuit.
Equipment left running when the line is down. Usually the fastest win.
Energy Monitoring Mistakes to Avoid
Most programs fail on data trust, not on technology.
A monitoring system is only as good as the trust people place in it. Wrong meters, missing tonnes or numbers that do not match the control room quickly turn a new dashboard into a screen nobody opens. A short rollout plan session helps avoid the common traps.
What works
- Start with the kiln line and the largest mills
- Match production tonnes to the same time window as energy
- Compare each shift against its own best shift
- Give every alert a named owner and an action
What fails
- Metering everything before using anything
- Mixing different cement types in one kWh per tonne
- Reporting totals instead of per-tonne numbers
- Dashboards with no link to shift actions
Compare the sum of sub-meters with the main utility meter every week. A large gap means a missing or faulty meter, and every number built on it is suspect until it is fixed. Do the same for production: weigh-feeder totals should match the stock and dispatch records.
How iFactory Process Energy Analytics Works
Energy, process and output data in one view.
iFactory Process Energy Analytics reads power meters, fuel flows and process data from your DCS, PLCs and historians, then calculates thermal and electrical energy per tonne by area and shift. AI compares each shift with its best performance under the same conditions and points to the settings that changed. It runs on an on-prem AI platform inside your network. Fit questions go to our solutions team.
Live specific energy
Thermal and electrical energy per tonne for every area, refreshed through the shift.
Kiln heat tracking
Fuel per tonne of clinker linked to O2, cooler and feed data to show why heat changed.
Mill benchmarking
kWh per tonne by cement type and fineness, compared with each mill's best shift.
Drift alerts
Rising energy per tonne flagged with the likely cause and sent to the right owner.
Carbon per tonne
Process, fuel and power emissions calculated from metered data for reporting.
Shift energy reports
Each shift's energy, output and events in one report for the morning meeting.
Results depend on your meters, process data quality and how alerts are acted on. We measure specific energy and savings on your own data during the pilot, rather than promising a general figure.
Turnkey AI: Delivered, Connected and Live in 6–12 Weeks
You do not build this. It arrives ready.
iFactory ships as a pre-configured NVIDIA AI server with the software pre-loaded, racked and ready. Rack it, plug in power and Ethernet, and the AI is live on your network. Our team handles cabling, network setup, PLC, DCS, SCADA and meter integration, operator training and 24×7 remote monitoring. Data stays on your network. For a scope matched to your plant, request a turnkey quote.
Ship, network and data
Server installed. Meters, fuel flows, DCS and historian connected for the kiln line and main mills.
Model training and pilot
Baselines set by area and product. AI trained on your shift history. Pilot alerts live.
Go-live and training
Plant-wide energy board live. Shift teams trained. 24×7 monitoring begins.
Frequently Asked Questions
What is cement plant energy monitoring?
It is the continuous measurement of fuel and electricity use across the plant, matched to production so energy can be tracked per tonne by area, equipment and shift. It replaces monthly totals with numbers teams can act on during the shift.
What is a good thermal energy figure for a cement kiln?
Thermal intensity typically ranges from about 3.0 to 4.5 GJ per tonne of clinker, depending on kiln type, fuel quality and raw material moisture. Modern precalciner kilns sit toward the lower end.
How much electricity does a cement plant use per tonne?
A typical range is about 90 to 130 kWh per tonne of cement. Grinding can take up to 60% of the electrical load, so raw and cement mills are usually the first places to look.
How is energy monitoring different from an energy audit?
An audit is a detailed study at one point in time. Monitoring runs every day and shows when performance drifts. Many plants use an audit to find opportunities and monitoring to make sure the gains last.
Does energy monitoring help with carbon reporting?
Yes. Metered fuel and electricity, together with clinker output, cover the main sources of cement emissions. That gives a stronger basis for customer, lender and regulatory reporting than yearly estimates.
Do we need new meters?
Often only a few. Most plants already have useful data in the DCS, motor drives and historian. The pilot starts by mapping what exists and adds meters only where a gap hides a large load.
Can monitoring help with biomass and waste-derived fuels?
Yes. These fuels vary in heat value and moisture, which changes kiln heat per tonne from load to load. Monitoring fuel flow, fuel analysis and kiln response together shows how much substitution the kiln can take before heat use or clinker quality suffers.
How do we start?
Start with the kiln line and the largest mill, where most energy and most savings sit. A 6-week pilot connects the data, sets per-tonne baselines and switches on the first alerts. To plan it, contact our team.
See Every Tonne's Energy Cost
In thirty minutes we look at your meters, your process data and how energy is reported today. You keep the notes whether or not you go further with iFactory.
- 1Last year's monthly fuel, power and output
- 2Your list of meters and where they sit
- 3Kiln and mill specific energy targets
- 4Your current carbon reporting method
- 5The area you suspect wastes the most