A paint shop oven running at full temperature through a model changeover gap costs between £800 and £1,400 per idle hour in energy — and no one's monthly utility bill shows it as a line item. A press shop running 22 tonnes of compressed air overnight to serve three presses on day shift is visible only as a higher-than-expected kWh number at month end. A welding cell drawing 40% above its process baseline because a transformer is running degraded looks, from the energy bill, exactly like a welding cell doing its job. The problem in automotive plant energy management is not the amount of energy consumed — it is the resolution at which it is measured. A meter on the main incomer tells you the total. A submeter on every shop, every line, and every energy-intensive process tells you where to act. iFactory Equipment Submetering delivers exactly that — shop by shop, line by line, process by process, live.
iFactory Equipment Submetering — Automotive Manufacturing
Line-Level Energy Visibility for Paint Shops, Presses, Welding & Robotics
kWh, kVA, power factor, and compressed air — metered at the process level across every energy-intensive shop, with waste flagged against each line's own production baseline, live.
£800–1,400
per idle hour in a paint shop oven running at temperature
8–14%
typical recoverable waste found on first submetering audit
Process-level
every shop, line, and cell — not just the main incomer
kWh/unit
energy intensity benchmarked per vehicle, per shift, live
Why a Main Incomer Meter Tells You Nothing Useful
Most automotive plants know their total monthly energy consumption to within a few percent. Very few know which shop, which line, or which process consumed it — or how much of it was wasted. These are the five reasons plant-level metering consistently fails to deliver energy cost reduction in automotive manufacturing.
01
No process attribution
A main incomer reading of 4.2 MWh tells you the plant consumed 4.2 MWh. It does not tell you that 1.1 MWh went to the paint shop, 0.6 MWh to pressing, and 0.4 MWh to compressed air feeding nothing overnight.
02
Idle consumption invisible
Non-production hours — changeovers, breaks, nights, weekends — often account for 25–40% of total plant energy in automotive. Without line-level metering, idle draw is buried in the total and never actioned.
03
Equipment degradation hidden
A press transformer drawing 18% above process baseline, a paint booth fan with a failing bearing running at higher current, a welding rectifier with deteriorating power factor — none visible at incomer level.
04
kWh/unit benchmark impossible
Without process-level metering, you cannot calculate energy per vehicle, per body, or per weld. You cannot compare shift-to-shift or line-to-line performance. The most important automotive energy KPI is untrackable.
05
Sustainability reporting estimated
Scope 1 and 2 reporting for OEM sustainability targets requires process-level data. Without submetering, every figure is an allocation estimate — a liability in an audit and a gap in any credible decarbonisation plan.
The Live Energy Dashboard — What Every Shop Should Show
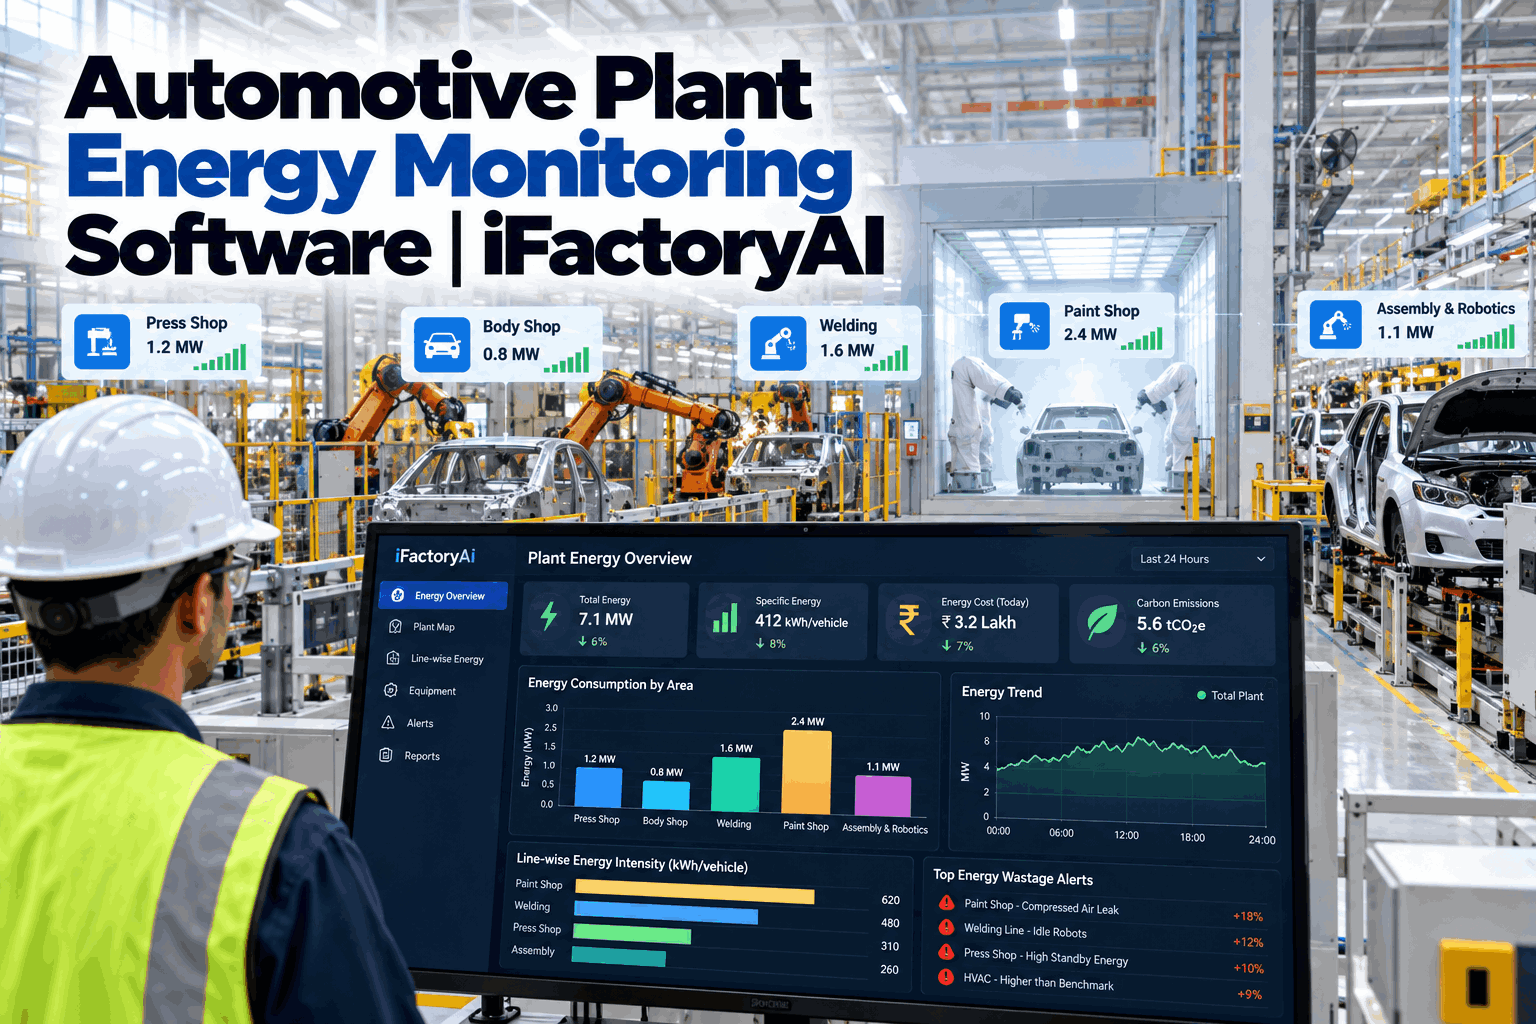
Plant-wide energy visibility means every shop reporting kWh, kVA, power factor, and energy per unit against its own production baseline — live, on one screen, with waste flagged before it rolls into the weekly utility bill. This is what an automotive plant energy dashboard looks like across a full vehicle manufacturing facility.
Paint Shop
Oven + booths + conveyors
On baseline
Demand2,840 kWwithin baseline band
kWh / body118 kWhtarget: ≤122 kWh
Idle draw14%of shift total — normal
Power factor0.94no PF penalty
Press Shop
Blanking + stamping lines
Waste detected
Idle draw38%+16 pts vs baseline
Compressed air12.4 barno demand — leak suspected
kWh / press cycle4.2 kWhwithin range
Demand1,620 kWoff-shift peak
Body Shop — Welding
Spot weld + MIG cells
On baseline
Demand890 kWwithin baseline
kWh / weld0.82 kWhtarget: ≤0.88 kWh
Power factor0.91within range
Idle draw9%of shift total — normal
General Assembly
Robotics + conveyors + tools
Peak breach
Peak demand2,180 kW+340 kW over contract
Penalty riskActivetriad window open
kWh / unit74 kWhwithin range
Alert sent06:42energy manager notified
Every Energy-Intensive Shop — One Submetering Platform
Automotive manufacturing is one of the most energy-diverse production environments in industry — a single vehicle plant may run six or seven fundamentally different energy-use profiles under one roof. iFactory submetering is configured per shop type, with energy models specific to each process's consumption pattern, idle profile, and waste signature.
🎨
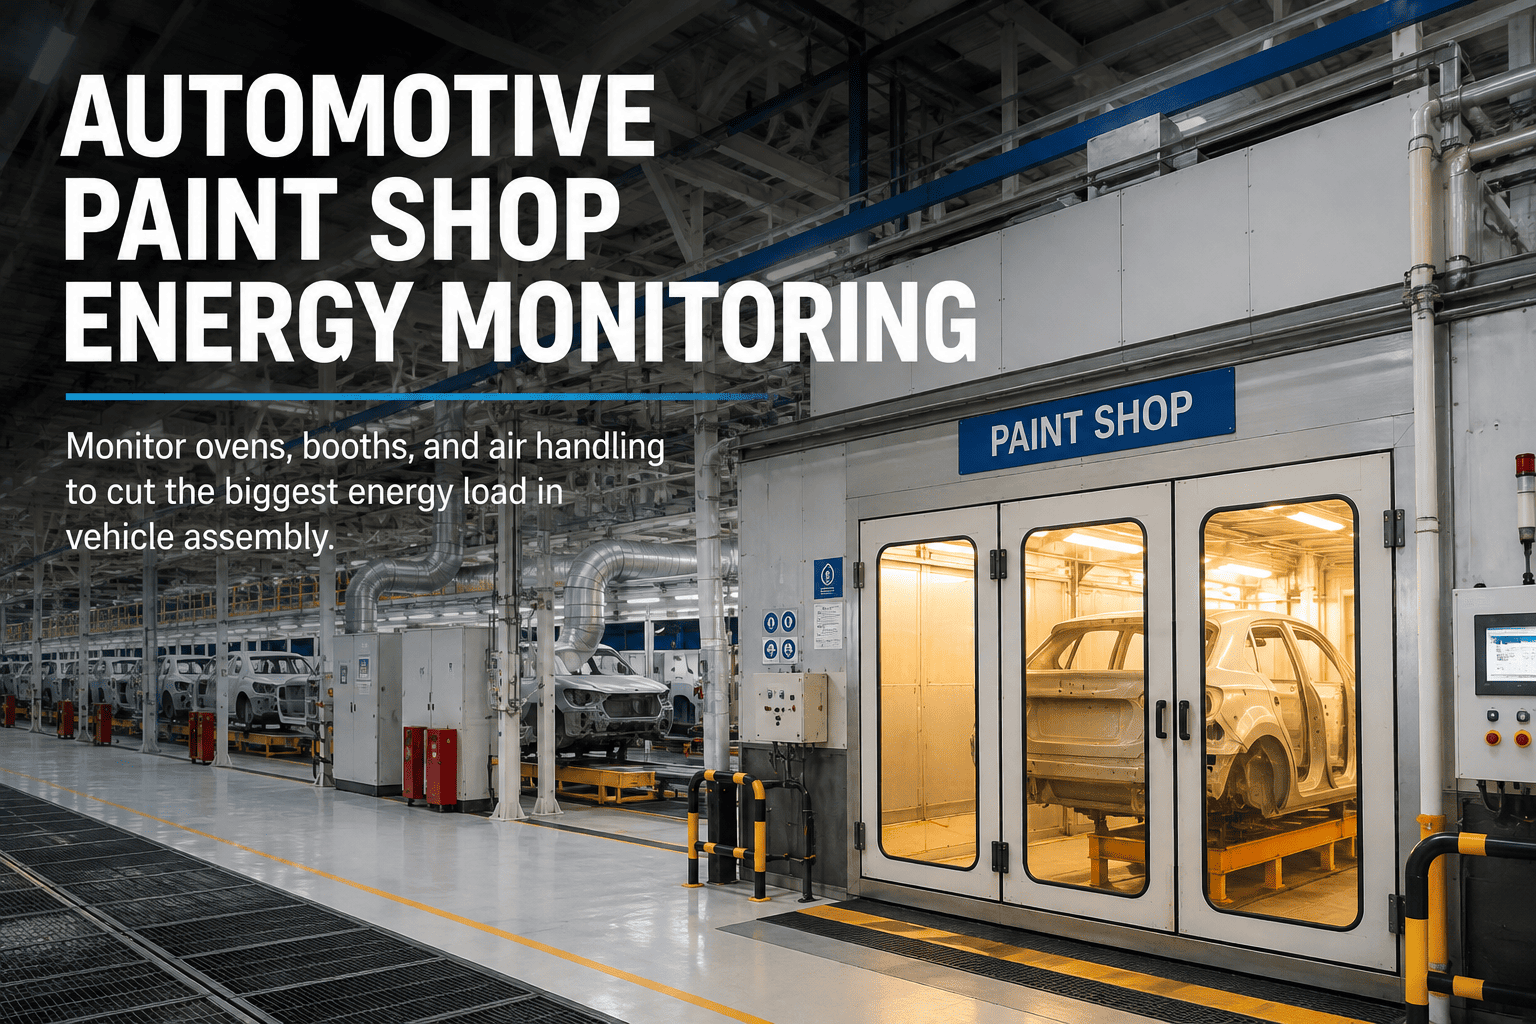
Paint Shop
Highest energy intensity in the plant
Oven zone temperature vs energy draw correlation
Booth fan VFD current and airflow efficiency
kWh per body — pre-treatment, primer, base, clear
Idle oven energy during model changeover gaps
Conveyor drive consumption per body throughput
Chiller / HVAC draw vs ambient and booth demand
⚙️
Press Shop
Highest peak demand — demand charge risk
Peak kVA per press cycle — demand charge exposure
Transformer loading and power factor per press
Compressed air consumption vs press demand profile
Idle draw during die change and material gaps
kWh per tonne of steel processed — line efficiency
Servo drive energy vs stroke count and tonnage
⚡
Body Shop — Welding
High power factor impact — reactive power cost
kWh per spot weld — cell by cell comparison
Welding rectifier power factor and reactive draw
Transformer temperature and loading — degradation signal
Robot idle power vs weld arc-on time ratio
MIG wire feed drive current vs wire consumption
Cooling water pump energy vs weld duty cycle
🤖
General Assembly — Robotics
Largest compressed air demand in the plant
Robot cell active vs standby energy split
Compressed air demand per tool and per station
Conveyor and AGV drive energy per unit moved
Torque tool and screwdriver energy vs cycle count
Line balancing waste — idle robot energy between calls
kWh per vehicle — shift-to-shift and line-to-line benchmark
🏭
Utilities & Infrastructure
25–40% of plant energy — mostly unmanaged
Compressed air leakage — off-shift demand baseline
Chiller plant efficiency — kW per tonne of cooling
Boiler efficiency and steam distribution losses
Lighting energy vs production schedule alignment
HVAC demand vs occupancy and ambient temperature
Water treatment pump energy per m³ processed
🔧
Powertrain & Engine Shop
High precision — energy per test cycle critical
Engine test cell energy per cycle by variant
Dynamometer loading energy vs test duration
CNC machining centre kWh per component type
Coolant and cutting fluid pump energy vs spindle time
Assembly torque and press-fit energy per operation
Leak test and end-of-line equipment idle draw
The Two Energy Problems Every Automotive Plant Has — Neither Is on the Utility Bill
Automotive plant energy waste comes in two forms that look identical on a monthly kWh report but require completely different interventions. Submetering at the process level is what separates them — and makes both actionable.
Idle & parasitic waste
"Energy consumed when nothing is being produced."
Paint ovens at temperature during model changeover and line stops
Compressed air pressurised overnight — 8 hours of leak loss
Robots in ready-state between JP calls — full servo power, zero output
Press shop HVAC and lighting running through weekend non-production
Welding cells in standby drawing 60–80% of active current
Process & equipment inefficiency
"Energy consumed during production — but more than it should be."
Welding transformer degraded — 18% above process energy baseline
Paint booth fan bearing wear — higher current at same airflow
Press power factor drifting — reactive penalty on every cycle
Chiller below COP target — 12% more kWh per tonne of cooling
Robot path inefficiency — longer cycle, higher energy, same output
How iFactory Submetering Works — From Meter to Action
The gap between a submeter installed on a distribution board and an energy manager knowing exactly which process to fix — and what it will save — is five steps. Each one is where iFactory converts raw metering data into a decision.
01
Submeter Installation
CT-based submeters installed at shop, line, and equipment level — on MV/LV distribution boards, motor control centres, and individual feeder circuits. No process downtime required for installation.
02
Live Data Ingest
kWh, kVA, kVAR, power factor, voltage, and current streamed every 30 seconds per circuit. Compressed air and gas submetering via pulse-output meters on the same platform.
03
Production Normalisation
Energy data joined to production schedule — bodies per hour, press cycles, weld counts, vehicles off-line — so every kWh is expressed as kWh per unit of output, not just an absolute number.
04
Waste Detection & Alert
AI flags idle draw above threshold, kWh/unit drift above baseline, peak demand approaching contract limit, and power factor penalties in real time — with circuit, shop, and estimated cost quantified.
05
Savings Verification
Every intervention closed with a before/after energy chart per circuit. kWh saved, cost avoided, and carbon reduced quantified per action — ISO 50001 measurement and verification ready.
The Energy KPIs That Matter in Automotive Manufacturing
Monthly utility spend and annual kWh totals are accounting outputs — they tell you what has already been paid. These are the operational energy KPIs that tell you what to change before the bill arrives, tracked live across every shop by iFactory submetering.
Intensity KPIs
kWh per vehicle produced
kWh per body — paint shop
kWh per press cycle / tonne
kWh per spot weld
kWh per m³ compressed air
Demand & Cost KPIs
Peak kVA per shop vs contract limit
Triad demand exposure — live during windows
Power factor per feeder — penalty detection
Reactive power (kVAR) by shop and circuit
Off-peak vs on-peak consumption split
Waste KPIs
Idle draw % — non-production hours per shop
Standby consumption per robot cell
Compressed air off-shift baseline (leak proxy)
Equipment energy vs process baseline drift
kWh per unit variance — shift-to-shift
Sustainability KPIs
kgCO₂e per vehicle — Scope 2 intensity
Renewable consumption share by shop
Carbon reduction vs prior period — verified
ISO 50001 EnPI tracking per boundary
OEM sustainability target reporting
Want to see what your idle and parasitic waste looks like by shop? Book a demo — bring three months of available metering data and we'll show you where the recoverable energy sits before any new meters are installed.
What Plant-Wide Energy Submetering Delivers
The return on submetering in an automotive plant is measured in the same currency as production: cost per unit reduced, sustainability targets met, and penalty charges avoided. These are the outcomes automotive manufacturers see after moving from plant-level metering to shop and process-level visibility.
8–14%
Energy cost reduction
typical recoverable waste identified in first 90 days
Live kWh/unit
Per shop, per shift
not a month-end allocation — a real-time operational KPI
Zero triad
Demand penalty risk
real-time alerts during triad windows before breach occurs
ISO 50001
M&V ready
verified savings per intervention, per boundary, per EnPI
Curious what process-level metering would surface in your plant? Talk to our automotive energy team — we'll map your shop layout to a submetering architecture before any hardware is specified.
Frequently Asked Questions
How is this different from our existing Building Energy Management System (BEMS)?
A BEMS manages building services — HVAC, lighting, heating — at zone or floor level. iFactory submetering operates at process and equipment level: individual press feeders, welding cells, paint shop zones, robot MCC circuits. The two are complementary — BEMS manages the building envelope, iFactory manages the production energy. Most automotive plants have a BEMS covering 20–30% of their energy footprint. The production processes that represent 70–80% of consumption are typically unmonitored below the shop incomer.
Does installation require production downtime?
In the vast majority of cases, no. CT-based submeters clamp onto existing conductors in distribution boards and MCCs without breaking the circuit — installation is carried out during normal operation. The only cases requiring a planned outage are where the distribution board itself needs modification to accommodate new metering hardware, which we identify and schedule in the survey phase before any hardware is ordered.
How does the platform know what "normal" looks like for each shop?
Baselines are built from the first 4–8 weeks of metering data, with the energy signal segmented by production state — active production, idle/changeover, non-production, planned maintenance. The system then compares live energy against the relevant state baseline, so a press shop in changeover is benchmarked against changeover energy, not active production energy. This eliminates the false alarms that plague simpler threshold-based systems when production schedules change.
Can the platform support ISO 50001 measurement and verification?
Yes. The platform tracks Energy Performance Indicators (EnPIs) per defined boundary — shop, line, or process — against baseline periods, adjusted for relevant variables (production volume, ambient temperature, product mix). Every energy-saving intervention is closed with a before/after M&V report that meets ISO 50006 metering requirements. For plants pursuing ISO 50001 certification, iFactory provides the data infrastructure for the energy review, baseline, and performance monitoring plan without requiring a separate M&V tool.
Can we start with one shop before committing to the full plant?
Yes — and the paint shop is usually the right starting point. It is the highest single energy consumer in a typical automotive plant, has the most complex energy profile, and is where idle waste (oven temperature maintenance during changeover gaps) is most financially significant. A paint shop pilot runs for 90 days: meter installation, baseline build, waste identification, and verified savings quantification. Book a demo with your paint shop layout and energy bills and we'll show you the expected savings range before a meter is installed.
Stop paying for energy you can't see and can't act on.
See Live Process-Level Energy Monitoring Across Your Automotive Plant
Bring your plant layout, shop energy bills, and any existing metering data. We'll map your highest-waste processes, show you where submetering would land in your distribution architecture, and quantify the expected recovery — before a single meter is specified.