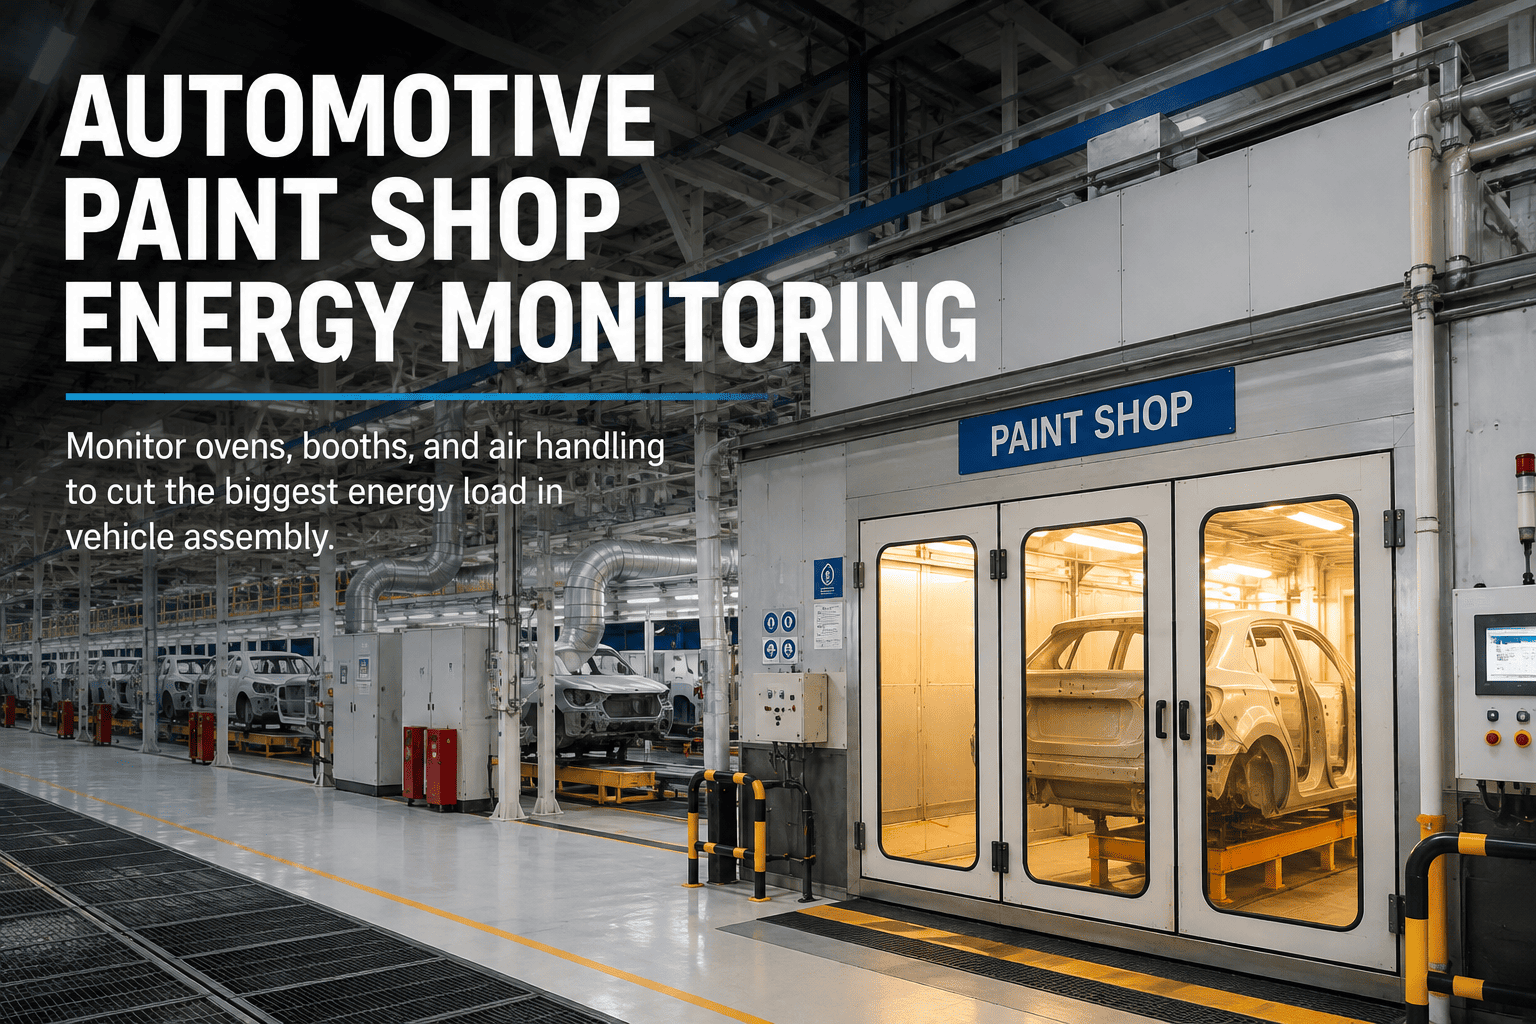
An automotive paint shop occupies about a third of the assembly plant's floor space. It consumes half of the plant's energy. It produces about 65% of the plant's CO₂. It is the single biggest, most expensive, and most closely watched piece of the vehicle-making chain — except for the part where the energy actually goes, which almost nobody watches in real time. Roughly 30 to 50% of the paint shop's own energy goes into the paint booths. Another 20% goes into curing ovens. HVAC takes 11-20%, compressed air 9-14%, and lighting 15% — and every one of those percentages moves with production rate, ambient temperature, and idle time in ways no monthly report ever catches. Dürr documented that around 50% of the heat supplied to a paint oven is ultimately lost to the environment, largely during idle cycles. That number is not a spec sheet — it's a live number, changing hour by hour, and it's the single biggest recoverable opportunity in the entire assembly plant. The paint shops that hit sustainability targets and cut cost per vehicle simultaneously don't do it with new ovens. They do it with live visibility on booth VOC exhaust, HVAC supply air, oven demand curves, and compressed-air load — with the drift caught while it's still a 5% loss, not a 15% one. iFactory Process Energy Analytics is built to run exactly that — every process step, every asset, every shift.
iFactory Process Energy Analytics for Paint Shops
Attack the Biggest Energy Load in Vehicle Assembly — Live
Live monitoring on booths, ovens, HVAC, and compressed air across every paint-shop process step — with 50% of oven heat routinely lost to idle cycles finally visible.
50%
oven heat lost to environment
2,000
MMBtu/day, single paint line
Where the Paint Shop's Energy Actually Goes
Paint-shop energy is not one big load — it is five, and they add up in a very specific order. Attacking them without knowing this breakdown is how big capital projects end up saving 3% when the operator was looking for 20%. This is the Energy Star breakdown of an automotive assembly plant.
01
Paint Booths
30-50%
Conditioned supply air — heated, humidified, filtered — pushed through the booth to hold coating quality. The biggest single load.
02
Curing Ovens
20-25%
Convection ovens heating BiWs and carriers — most of the fuel goes into raising body temperature, not curing paint film.
03
HVAC
11-20%
Building climate control plus dedicated paint-shop conditioning — reheat cycles are the biggest hidden waste.
04
Lighting
~15%
High-lux inspection zones, color-match booths, and 24×7 general lighting across a large facility footprint.
05
Compressed Air
9-14%
Atomizers, robots, pneumatic tools, and blow-off. Leak rates typically account for 20-30% of total compressed air spend.
The Idle-Cycle Problem — Where 50% of Oven Heat Actually Goes
An automotive paint oven is designed to hold a stable temperature, which means it burns fuel whether or not vehicles are actually inside. Dürr documented that around half of the heat supplied to a typical convection oven is ultimately lost to the environment — most of it during idle cycles, breaks between vehicles, and pauses that nobody counts on the shift report.
Full production
Vehicles entering every 90 seconds
100% heat useful
On demand
Peak throughput
The oven is doing its job — hot air transferring to BiWs and carriers, curing paint film, then leaving with exhaust.
Idle / Break
No vehicles in the tunnel, oven still hot
50%+ lost to environment
Off demand
Zero throughput
Fans still running, ducts still supplying hot air, exhaust still discharging. The oven is heating an empty tunnel.
Live idle detection with demand-following airflow — the Dürr EcoSmart approach — is what turns this 50% loss back into recoverable margin.
The Paint Process Steps — And What They Cost
Every step in the paint process has its own energy signature. Understanding each one lets you attribute drift to the right asset instead of "the paint shop" as a black box.
1
Pretreatment
30-70°C
Phosphate baths, rinses, drying. Heavy hot-water demand and continuous circulation pumping.
2
E-coat & Cure
175-185°C
Electrodeposition tank plus first curing oven — one of the two biggest fuel loads in the shop.
3
Sealer / PVC
140-160°C
Underbody sealer application and cure. Robotic application, moderate oven load.
4
Primer Booth & Oven
140-160°C
Spray booth with high-lux air handling, followed by flash-off and cure. Booth HVAC is the load driver.
5
Base Coat
70-110°C flash
Color application — usually two coats — with intermediate flash-off tunnels between applications.
6
Clear Coat & Cure
140-160°C
Final finish application and the biggest oven cycle. Quality and energy both peak here.
Want per-step energy attribution on your own line? Book a demo and bring one month of paint-shop meter data.
The Six Recoverable Losses
Every paint shop loses energy in slightly different places, but almost all the losses concentrate in six areas. Naming them separately is the first step to attacking each on its own terms.
01
Idle-cycle oven waste
Up to 50%
Ovens running full airflow with no vehicles inside. Biggest single lever — demand-following airflow closes most of the gap.
02
HVAC reheat loop
-630 kW typical
Air cooled to dehumidify, then reheated to setpoint — burning fuel on both ends. Liquid desiccant retrofits eliminate reheat entirely.
03
Booth over-ventilation
30-50% recoverable
Booths running peak airflow through non-spray windows. VOC-following ventilation matches airflow to actual solvent load.
04
Compressed air leaks
20-30% loss
Undetected leaks in atomizer feeds, robot supply lines, and blow-off nozzles. Ultrasonic detection surfaces them fast.
05
Missed exhaust heat
20% of oven fuel
Warm oven exhaust vented directly to atmosphere — heat recovery to pretreatment or HVAC preheat pays back in months.
06
Non-production hours
Weekend / holiday
Systems running at production setpoints during shutdowns. Scheduled setback protocols typically recover 5-8% annual energy.
How Process Energy Analytics Runs the Loop
Cutting paint-shop energy is not a report exercise. It is a live loop from meter to setpoint change to verified recovery.
01
Meter Every Step
Sub-metered gas, electric, compressed air, and steam by process step — pretreatment, e-coat, booths, ovens, HVAC.
02
Overlay Production Rate
Vehicles per hour tied to energy per vehicle by step. Idle detection built in from production signals.
03
Detect Idle & Waste
Ovens with airflow but no throughput. Booths with peak fans and no spray. HVAC reheating what it just cooled.
04
Route the Fix
Setpoint change, demand-following airflow, leak repair work order, heat-recovery diagnostic — with an owner and deadline.
05
Verify Energy Per Vehicle
Post-action energy-per-vehicle chart confirms the drop — event closes with quantified fuel, kWh, and CO₂ recovered.
What Live Paint-Shop Analytics Deliver
Paint-shop energy is the biggest single lever in an assembly plant's cost per vehicle and sustainability scorecard. These are the outcomes plants typically see after moving from monthly meter reads to live process-level analytics.
40%
Primary energy saving
documented with cascaded HVAC + desiccant
35%
Running cost cut
on the same paint-shop, published case
Idle
Detection live
50% oven loss finally visible
Lower
CO₂ per vehicle
the plant's biggest scorecard mover
Curious what a 20% paint-shop cut is worth on your cost per vehicle? Talk to our automotive team — we'll size it against your production and fuel tariff.
Frequently Asked Questions
Why is the paint shop specifically such an energy hog?
Three reasons stacked. First, it needs conditioned air at scale — booths need heated, humidified, filtered supply air continuously to hold coating quality. Second, curing ovens have to raise the temperature of the vehicle body and its carrier, not just the paint film — most of the fuel goes into that thermal mass. Third, the shop occupies about a third of the plant floor and runs 24×7, so HVAC, lighting, and compressed air baseloads compound. Together these push paint to 36-50% of assembly plant energy and about 65% of plant CO₂.
Is idle-cycle waste really 50% of oven energy?
Dürr documented that figure on a typical convection paint oven — around half of the heat supplied is ultimately lost to the environment, most of it during idle cycles and pauses in production. The oven can't be shut off between vehicles, so it holds temperature continuously. Demand-following airflow control (Dürr's EcoSmart VEC and equivalent systems) attacks that waste directly, and per-oven analytics tell you when the loss is happening and how big it is right now.
Do we need to sub-meter every process step?
Ideally, yes — but you don't have to start there. Most plants get 60-70% of the visibility from metering four or five biggest loads: e-coat oven, primer/base/clear oven, main HVAC air-handling unit, and compressed-air plant. iFactory Process Energy Analytics reads from your existing utility meters, DCS, and building management system, and adds sub-meters only where the payback justifies it. A staged rollout usually pays back the first phase before the second is deployed.
Does this help with sustainability targets and CO₂ scorecards?
Directly. The paint shop is responsible for roughly 65% of the assembly plant's CO₂. Every kWh, MMBtu, and cubic foot of compressed air you cut translates proportionally into avoided emissions. Live energy-per-vehicle tracking by process step gives you the audit-grade evidence your sustainability reporting needs — plus per-shift and per-crew accountability to keep the gains once you've made them.
Can we see it on our own paint shop before committing?
Yes. Bring one paint line and one month of BMS, DCS, or utility meter data. We'll build the per-step energy baseline, overlay production rate, and show every idle-cycle loss, HVAC reheat waste, and compressed-air leak that would have been flagged — plus what a 20% total reduction would look like on your specific cost-per-vehicle number. Book a demo and we'll walk it live.
Stop losing 50% of the oven to an empty tunnel.
See Live Paint-Shop Energy Analytics on Your Own Line
Bring one paint line and one month of BMS, DCS, or utility meter data. We'll baseline energy per vehicle by step, overlay idle detection on the ovens, flag HVAC reheat and compressed-air waste, and show the specific 20% reduction that's already sitting on your line.
Per-step
energy attribution