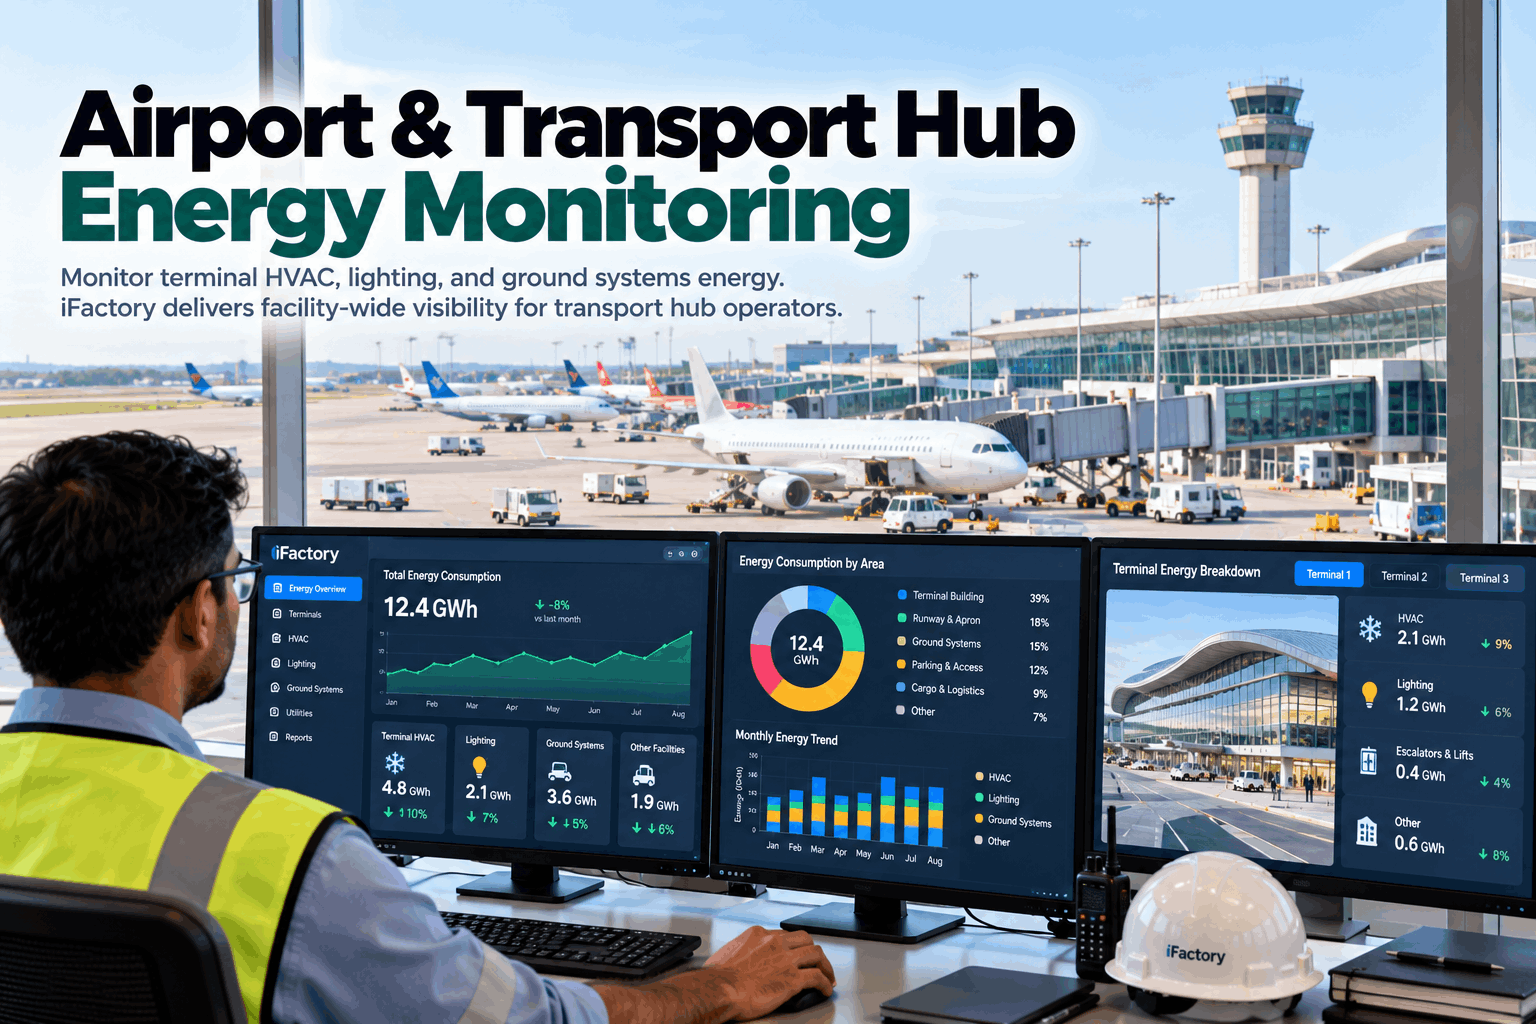
An airport never really closes, and neither does its energy bill. Terminals are cooled, lit and powered around the clock, often whether a flight is due or not. iFactory's Facility Energy Monitoring brings terminal HVAC, lighting, gate systems and ground equipment onto one screen, matched to the flight schedule. To see it with your own meters, book an energy walk-through.
Airport and Transport Hub Energy Monitoring
One view of terminal HVAC, lighting, gates and ground systems, set against passengers, flights and weather, so you can see which energy is serving travellers and which is not.
- Where an airport's energy goes, system by system
- Energy matched to flights, passengers and weather
- KPIs and records for carbon accreditation
The night bars are the first place to look. Energy used when the terminal is nearly empty is either needed for safety and systems that never stop, or it is waste. The data shows which.
Where an Airport's Energy Goes
HVAC and lighting lead, but a long tail of systems never switches off.
Energy use differs hugely between a regional airport and a major hub, and with climate, glazing and opening hours. Even so, the pattern from published studies is familiar. Heating and cooling come first, lighting second, and then come IT, airfield lighting, signage, security and baggage systems. Our support team can map which of these your meters already cover.
Shares from Seve Ballesteros-Santander Airport in Spain for 2015, as reported by Ortega Alba and Mañana in Energies, 2017. A large hub in a hot or cold climate will look different. That is why measuring your own split comes first.
Three zones, three kinds of load
Terminal
Heating, cooling, lighting, baggage systems, escalators, IT and retail. The largest share, and the most closely tied to passengers.
Airside
Airfield lighting, apron floodlights, gate air units, ground power and hangars. Tied to aircraft movements and night operations.
Landside
Car parks, lighting, EV chargers, rail links and rental car buildings. Often metered separately and easy to overlook.
Four Systems to Watch First
Each one has a simple test: is it running for a reason right now?
Most airport energy waste is not broken equipment, and it is rarely dramatic. It is working equipment running when no one needs it. The four systems below account for most of the energy that can be saved without new construction. To check them on your terminal, book a site review.
Terminal HVAC
Air handlers, chillers and boilers. Watch for zones conditioned with no departures, and heating and cooling fighting each other.
Lighting
Terminal, apron and car park lighting. Watch for full output in daylight and in closed piers.
Gate systems
Air units, ground power and jet bridges. Watch for units left running after the aircraft has gone.
Baggage and people movers
Conveyors, escalators and walkways. Watch for belts and stairs running with nothing on them.
When aircraft use the airport's ground power and air units instead of their own small onboard engines, aircraft fuel burn at the gate is almost eliminated, as the FAA notes for its emissions grant programme. The airport's electricity meter rises at the same time. Measure both, so the right kind of increase is not mistaken for waste.
Quick checks on a night walk
- Closed piers still lit and conditioned
- Gate units humming with no aircraft
- Escalators and walkways running empty
- Screens lit in areas nobody can enter
The same checks, in the data
- Zone energy against flights due in that zone
- Gate unit power against aircraft on stand
- Conveyor and escalator power against passenger counts
- Overnight load, broken down by system
A walk finds it once. The data finds it every night.
One Terminal, One Day
Energy is only "high" or "low" against what the day asked for. Here the platform sets yesterday's use against passengers and weather.
Energy That Follows the Flight Schedule
A terminal's real demand is set by flights and passengers, not by the clock.
Building systems in many terminals run on fixed time schedules set years ago. Flights move, piers close for works, seasons change. Linking energy data to the flight schedule and passenger counts shows where systems run ahead of need, and where they lag. Ask our energy engineers what your schedule data can show.
Pre-cool by departure
Start conditioning a gate area ahead of its first flight, not at a fixed hour.
Set back empty piers
Reduce air and light in piers with no flights for the next few hours.
Gate units by aircraft
Flag air and power units still running after the aircraft has left.
Lighting by daylight
Compare lighting power with daylight levels in glazed areas.
Night base load
Break down what runs overnight, and question each part of it.
Peak warning
Warn before a demand peak, when a bank of arrivals meets the hottest hour.
The platform recommends. Your building management team decides what to change in the controls.
A large station or bus interchange follows its own schedule of arrivals and departures, hour by hour, with big public halls, long opening hours and quiet nights. Swap the flight schedule for train or bus services and the same approach applies: condition and light spaces for the people actually due, and question everything that runs when the concourse is empty.
Airport Energy KPIs and Carbon Reporting
Normalise before you compare. A busy day should use more energy.
Total kWh rises and falls with traffic and weather, so on its own it says little. The KPIs below divide energy by what the airport actually did, which makes months, terminals and airports comparable. The same meter data supports carbon reporting. To set up your KPI set, book a KPI session.
Airport Carbon Accreditation asks airports to map, reduce and report the emissions they control directly, from fuel and bought electricity. Each step up its levels needs better evidence. Continuous, metered energy data by system makes that evidence far easier to produce, and shows where reductions came from.
A hot August will always use more cooling than a mild May. Comparing raw totals makes a heatwave look like waste and a cool month look like success. The platform adjusts expected energy for outside temperature, so a real improvement shows up as one, whatever the weather did.
One View Across Terminal, Airside and Landside
Different systems, different owners, one picture of energy.
Airport energy data is spread across the building management system, lighting controls, electrical meters, gate equipment and car park systems, often owned by different teams and contractors. The platform reads them side by side, adds flight and passenger data, and runs on a server inside your network. Nobody has to replace a system they already own. Our integration team can confirm what your systems already provide.
Data the platform reads
- Building management system points and alarms
- Main and sub-meters for power, gas and water
- Lighting control systems
- Gate air units and ground power controllers
- Flight schedule and passenger counts
What it gives back
- Energy by terminal, zone and system
- Expected against actual, every day
- Equipment running without a reason
- KPIs normalised for traffic and weather
- Records ready for carbon reporting
One set of data, three views
- Energy manager. Daily gaps, KPIs and carbon reports.
- Facilities team. Equipment running without a reason, by location.
- Airport leadership. Energy per passenger, by terminal and season.
It reads your systems. Control changes stay with your team. Energy can also be split by tenant airline or concession, where sub-meters allow, so shared costs are allocated on measured use.
Turnkey AI: Delivered, Connected and Live in 6–12 Weeks
You do not build this. It arrives ready.
iFactory ships as a pre-configured NVIDIA AI server, racked and ready, with the software pre-loaded. Rack it, plug in power and Ethernet, and the AI is live on your network.
Our team handles cabling, network setup, PLC and SCADA integration, operator training and 24×7 remote monitoring. The server sits inside your own network, so building and passenger data stay on site. For a scope matched to your terminals, request a turnkey quote.
Ship, network and data
Server installed. Building management, meters and lighting controls connected for one terminal. Flight schedule linked.
Model training and pilot
Expected energy learned from traffic and weather. First gaps traced and checked on site with your facilities team.
Go-live and training
Daily reports and KPIs live. Gates and airside systems added. 24×7 remote monitoring begins.
Frequently Asked Questions
What is airport energy monitoring?
Collecting energy data from terminal buildings, gates, airfield and landside systems in one place, and comparing it with what the airport actually did: passengers, flights and weather. It shows where energy serves travellers and where equipment runs without a reason, terminal by terminal and hour by hour.
How much energy does HVAC use in a terminal?
It varies with size, climate and design. One published study of a Spanish airport found about 31% went to HVAC and about 20% to lighting. Larger, heavily glazed terminals in hot or cold climates often report a higher HVAC share. Measuring your own split is the first step.
Does it replace our building management system?
No. The building management system keeps running the equipment. The platform reads its data alongside meters, lighting controls and gate systems, and shows patterns the BMS alone does not. Control changes stay with your team. Many airports find the BMS already holds the data needed. It simply has not been set against flights, passengers and weather before.
Why link energy to the flight schedule?
Because passengers and flights drive demand. A gate area needs conditioning before its departure, not all day. Linking the two shows systems running ahead of need, and lets you compare busy and quiet days fairly. It also helps when a pier closes for works or a new route opens, because the expected energy changes with it.
Does it help with Airport Carbon Accreditation?
It provides the metered energy data that carbon footprints and reduction plans rest on, by system and over time. Accreditation itself is granted by the programme. The platform makes the evidence easier to gather and check, and keeps a monthly record so progress between assessments is visible to your own team, not only to the assessor.
Does it work for rail stations and bus hubs too?
Yes. Any transport hub with large public spaces, long opening hours and schedule-driven demand has the same pattern. The schedule simply comes from trains or buses instead of flights, and passenger counts from gates or ticket barriers.
How long does it take to go live?
Six to twelve weeks from delivery for a first terminal. We need a place for the server with power and Ethernet, read access to building management and meter data, and a flight schedule feed. To check your set-up first, contact our team.
Bring One Month of Terminal Data
In thirty minutes we set one terminal's energy against its passengers and weather, and point out the hours that look out of line. You keep the review whether or not you go further with iFactory.
- 1One month of meter data for a terminal
- 2Daily passenger numbers for the same month
- 3The flight schedule, or a typical week of it
- 4Building management system operating hours
- 5Your carbon accreditation level, if you have one