For U.S. food and beverage manufacturers running multi-SKU filling operations, changeover time is the most recoverable source of lost capacity on the floor. A filling line switching between bottle formats or product recipes can burn 60 to 90 minutes per transition—and with five to ten changeovers per shift becoming common, that math erodes OEE faster than any equipment failure. The answer is not buying new machinery. It is applying Single-Minute Exchange of Die (SMED) discipline, parallel work sequencing, and operator parts kitting to compress filler changeovers from 90 minutes down to 12. Book a Demo with iFactory to see how AI-driven changeover analytics gives your production team the data to make that compression permanent.
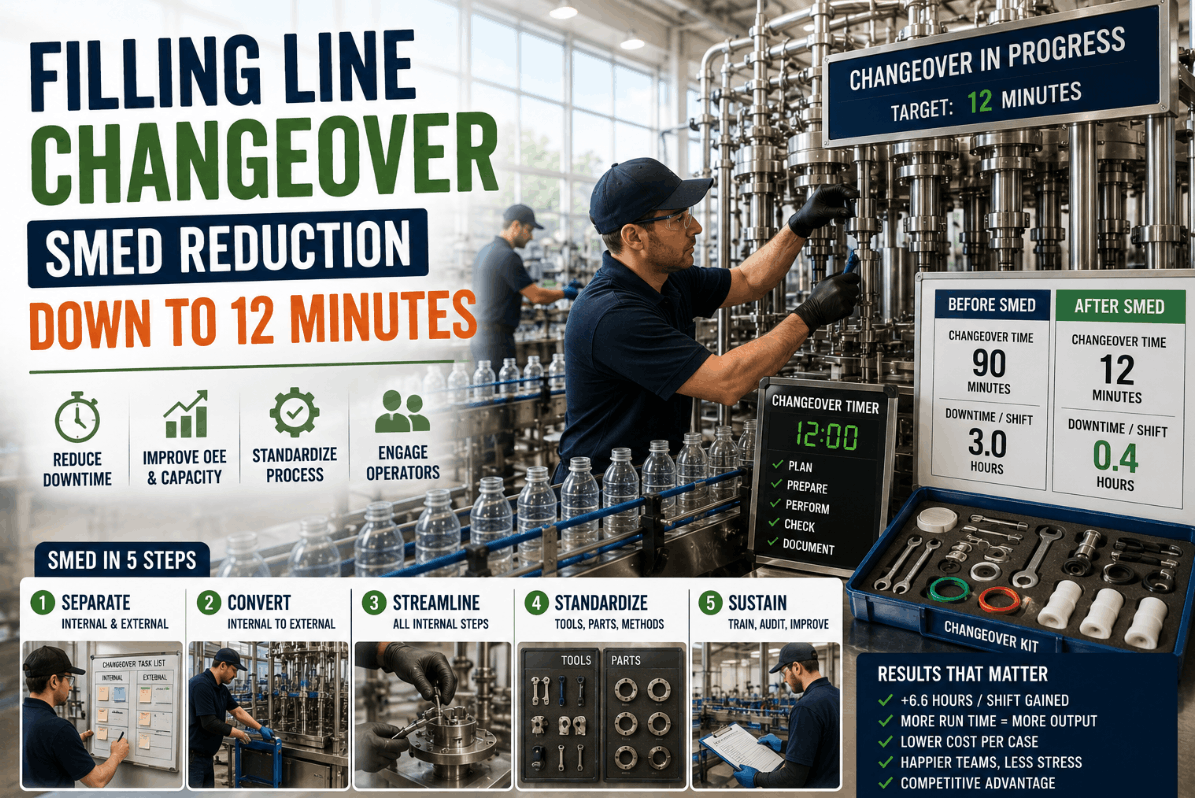
Filling Line Changeover SMED Reduction: From 90 Minutes to 12
A practical framework for U.S. food and beverage engineers to apply SMED principles, parallel task execution, and digital changeover tracking to achieve rapid, repeatable filler size changes that protect OEE and fill rate commitments.
See Your Changeover Time Compressed in Real Time
iFactory's analytics platform captures every second of your filler changeover, identifies which steps are truly internal, and builds the SMED baseline your team needs to reach 12-minute transitions.
Why Filling Line Changeovers Destroy OEE Without Showing Up as Failures
Changeover downtime is classified as planned loss in most MES systems, which means it is often invisible in standard OEE dashboards. Yet a filling line running ten SKUs per shift and averaging 70-minute changeovers can lose more than 700 minutes of capacity before a single bottle enters finished goods inventory. That is not a maintenance problem—it is a process design problem, and it requires a structured countermeasure.
Availability Collapse on High-Mix Lines
Every changeover minute is a direct subtraction from planned run time. A line with two 90-minute changeovers per 8-hour shift has an availability ceiling of 62.5%—before a single unplanned stop is counted.
Startup Waste After Product Change
Poorly standardized filler setups generate first-fill rejects and fill-weight drift during startup, adding hidden quality loss on top of downtime. SMED includes startup quality as part of the changeover clock.
Operator Variability Between Shifts
Without a standardized sequence and kitted parts, changeover time varies 40% or more between shifts for identical product transitions—making planning unreliable and improvement impossible to sustain.
Allergen & CIP Compliance Overhead
Food and beverage fillers carry allergen segregation and CIP validation requirements that add mandatory internal steps. Without analytics, teams cannot distinguish regulatory-required time from preventable process waste.
No Baseline, No Improvement
Most facilities still time changeovers with a stopwatch and a clipboard. Without granular step-level data, teams cannot identify which specific tasks are consuming the most time or which operators have the best-practice sequence.
Inventory Buffer Dependency
Long changeovers force larger production runs to justify the lost time, inflating WIP inventory and reducing the line's ability to respond to short-notice SKU demand changes from retail customers.
SMED Applied to Filling Lines: Internal vs. External Task Conversion
SMED—Single-Minute Exchange of Die—is a lean methodology developed by Shigeo Shingo that has since proven effective across food, beverage, and pharmaceutical packaging. Its core principle is straightforward: separate every changeover task into internal work (machine must be stopped) and external work (can be done while the line is still running), then convert as many internal tasks to external as possible. The first stage of this conversion alone typically delivers 30–40% time reduction with zero capital spend. For filling lines, the highest-value conversions target parts retrieval, cleaning staging, and recipe verification.
Observe & Document the Current State
Video-record the full changeover from last good fill to first good fill on the new product. Break every action into discrete steps with timestamps. Do not filter or pre-judge—capture everything, including tool searches, waiting, and walkbacks. iFactory's analytics platform automates this through sensor timestamps and operator tablet inputs, replacing video review with structured digital data.
Classify Every Step as Internal or External
Review the documented steps and tag each as Internal (I) or External (E). Common external conversions on filling lines include: retrieving format parts, pre-staging cleaning supplies, loading the next recipe on the HMI, and pre-heating filler heads. What remains internal—head swaps, seal replacements, CIP verification—becomes the true irreducible changeover core.
Build the Parallel Work Plan
Assign external tasks to a dedicated second operator who works the changeover kit while the filler is still producing the outgoing product. Parallel execution is where the steepest time compression occurs. A single-operator changeover that takes 75 minutes often drops below 30 minutes when external work is separated and run concurrently with production end-of-run activities.
Streamline Internal Steps with Quick-Change Tooling
For steps that cannot be externalized, reduce their duration through standardization. Quick-release clamps replace bolted filler heads. Color-coded adjustment points eliminate trial-and-error calibration. HMI recipe memory loads fill volume, speed, and temperature parameters in a single touch. Each of these reduces internal time without requiring operators to memorize complex procedures.
Standardize & Measure Every Changeover Going Forward
Document the optimized sequence as a digital standard operating procedure with time targets for each step. Measure actual vs. target on every changeover. Track which operator teams consistently beat the standard—their sequence becomes the facility-wide benchmark. iFactory's changeover analytics module surfaces this data in real time, making deviation visible the moment it occurs rather than in next week's production report.
Operator Parts Kitting: The Single Fastest Win in Changeover Reduction
Parts retrieval—searching for the correct filler heads, gaskets, O-rings, and adjustment tools—accounts for 15 to 25 minutes of a typical 90-minute changeover. Changeover kitting eliminates this entirely. A dedicated kit, pre-staged on a shadow board or rolling cart, contains every component needed for the next run, assembled by a material handler while the current run is still producing.
- Operator leaves line to retrieve parts from central store
- Wrong part sizes discovered mid-changeover
- Tool searches add 10–20 minutes of untracked waste
- Changeover sequence varies by shift and by operator
- No pre-staging of cleaning supplies or CIP chemicals
- Pre-staged kit cart rolled to line before shutdown
- iFactory verifies kit completeness against the run schedule
- Shadow board layout enforces correct tool selection
- Digital SOP on tablet guides every step in sequence
- CIP chemicals and cleaning tools staged 20 min before shutdown
Reactive vs. SMED-Optimized Filling Line Changeover KPIs
The table below reflects documented performance ranges for food and beverage filling lines. The iFactory AI column reflects outcomes from deployments using the platform's changeover analytics module combined with operator kitting and digital SOPs. Ready to benchmark your operation? Book a Demo and run a gap assessment against these targets.
| KPI | Industry Laggard | Best-in-Class Manual | iFactory AI + SMED |
|---|---|---|---|
| Average Changeover Time | 75–90 min | 25–35 min | 10–15 min |
| Changeover Time Variability | ±40% shift-to-shift | ±20% | <±8% |
| Startup Reject Rate | 3–5% of first-fill volume | 1–2% | <0.5% |
| OEE Availability Impact | -25 to -35 points | -10 to -15 points | -3 to -5 points |
| Parts Retrieval Time | 15–25 min per changeover | 5–10 min | <1 min (pre-kitted) |
| Changeovers Trackable per Shift | Manual log (incomplete) | Manual log | 100% automated capture |
How iFactory AI Accelerates the SMED Journey on Filling Lines
iFactory's analytics platform provides the data infrastructure that turns SMED from a one-time workshop event into a continuously improving production system. The platform connects to existing filling line PLCs and operator tablets without requiring capital equipment replacement.
Real-Time Changeover Timing
Sensor inputs automatically mark the start and end of each changeover phase—shutdown, cleaning, mechanical swap, recipe load, and first-fill confirmation. Every step is timestamped without operator input, eliminating logging variability and providing a complete, accurate record of where time is spent.
Internal vs. External Task Classification
The platform's analytics engine compares the machine state log against operator activity timestamps to automatically flag tasks that occurred while the filler was stopped but that could have been completed during the prior run. This surfaces conversion candidates without requiring a lean consultant to be on the floor.
Digital Changeover SOPs & Kitting Checklists
Operators receive the correct changeover sequence, parts checklist, and torque specifications on a tablet before the line stops. The SOP updates automatically when the engineering team refines the standard, ensuring every shift runs the current best practice without re-training sessions.
Changeover Performance Trending & Alerts
The platform tracks every changeover against the established time target and alerts supervisors in real time when a changeover is running over target at any step. Weekly trending reports identify which SKU transitions are consistently underperforming, enabling targeted SMED workshops on the highest-impact transitions first.
See all four modules in action — Book a Demo with an iFactory filling line specialist.
"We were averaging 78 minutes per bottle-size changeover across three filling lines. After mapping every step with iFactory's analytics and building kitting carts for each SKU transition, we got the first line down to 14 minutes within two months—without touching any mechanical hardware. The biggest surprise was discovering that 22 minutes of every changeover was one operator walking to the parts cage and back. That was pure process waste, and we never would have quantified it without the step-level data. Now our production planners can actually schedule five changeovers in a shift without sacrificing throughput targets."
Filling Line SMED: Frequently Asked Questions
Q: What is a realistic changeover time target for a filling line applying SMED?
For most bottle and product changeovers, 10–15 minutes is achievable within 60–90 days when SMED is combined with operator kitting and digital SOPs. Some facilities reach under 10 minutes after a second improvement cycle.
Q: Does SMED require new equipment to work on filling lines?
No. The first phase—converting internal tasks to external and pre-staging parts—requires zero capital investment and typically delivers 30–40% time reduction through process change alone.
Q: How does iFactory measure changeover time automatically?
iFactory connects to your filling line PLC and operator tablets to timestamp each changeover phase automatically—shutdown, cleaning, mechanical swap, recipe load, and first good fill—without manual logging.
Q: Can changeover kitting work across multiple bottle formats on the same line?
Yes. iFactory links each kit checklist to the scheduled run order, so the correct parts and cleaning supplies are pre-staged for whichever SKU transition is coming next, regardless of format complexity.
Q: How long does it take to see measurable improvement after deploying iFactory?
Most filling line customers establish a step-level changeover baseline within 30 days and achieve measurable time reduction within 60 days of implementing the platform's SOP and kitting recommendations.
Conclusion: 12-Minute Changeovers Are a Process Problem, Not a Hardware Problem
The gap between a 90-minute filler changeover and a 12-minute one is almost entirely a process gap—not a machine gap. SMED converts external tasks out of the downtime window, parallel work compresses what remains, and operator kitting eliminates the single largest category of untracked waste. What makes these gains permanent is data: step-level changeover timing that identifies drift before it becomes habit, and digital SOPs that ensure the best-practice sequence is the default sequence on every shift. iFactory's analytics platform provides exactly that infrastructure, giving your production and engineering teams the visibility to build on SMED gains quarter over quarter rather than watching them erode. The investment in measurement pays back in the first avoided hour of capacity loss.
Ready to Build a 12-Minute Changeover on Your Filling Line?
Speak with an iFactory specialist to map your current changeover baseline, identify your highest-impact SMED conversions, and deploy real-time tracking across your filling operations.