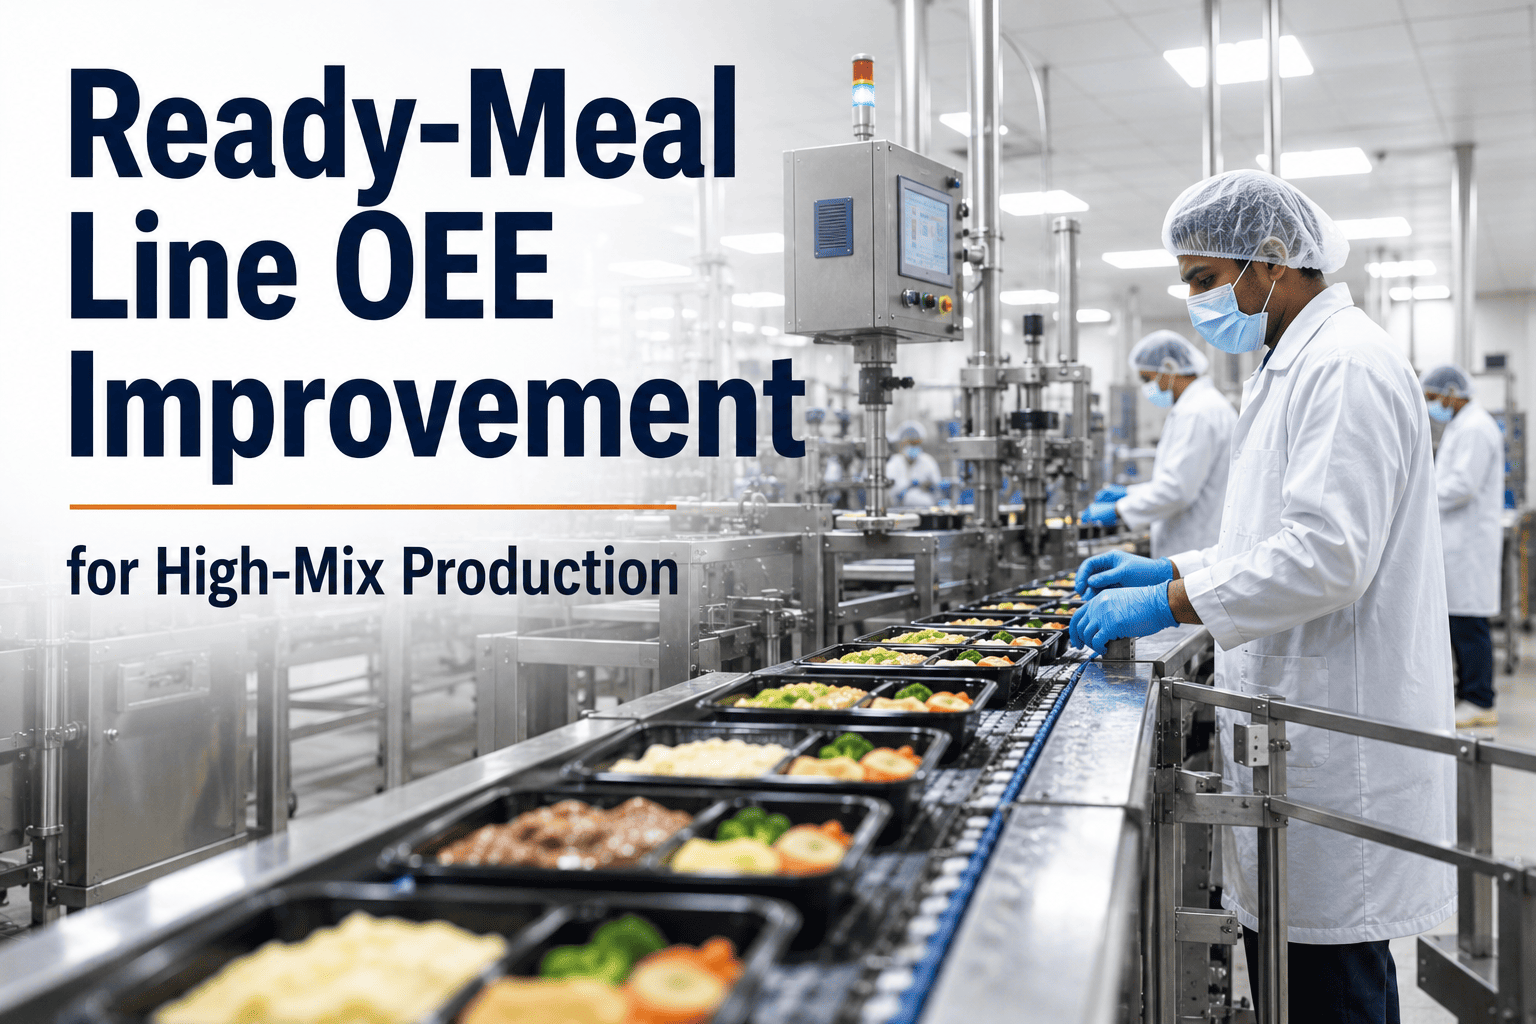
A ready-meal plant is a factory disguised as a kitchen. Forty-plus SKUs. Six-component trays. Dairy on one line, gluten on the next, nut-free on the third — and an allergen matrix that turns the weekly schedule into a combinatorial puzzle. Then somebody quotes the classic 85% "world-class" OEE benchmark, and everyone shakes their head because it feels unreachable. It is unreachable — because it is the wrong target. The right target for a multi-SKU, allergen-managed ready-meal line sits at 75–82% OEE, and industry data shows most plants running at 58–65%. That gap is real, recoverable, and does not require compromising a single food-safety control. A structured ready-meal OEE program attacks it by loss category, not by heroics.
iFactory High-Mix Food OEE
Ready-Meal OEE Improvement That Respects Allergens, SKUs and the Schedule
Real-time loss detection, SKU-level OEE, allergen-aware scheduling and an audit-ready compliance layer — engineered for high-mix ready-meal lines that can't slow down and can't cut corners.
58-65%
typical ready-meal OEE today
75-82%
realistic multi-SKU target
40%
changeover cut via parallel tasks
8-14%
hours lost to allergen flushes
You Are Benchmarking Against the Wrong Number
The 85% "world-class" OEE figure was popularised in the 1990s for discrete manufacturing — automotive, electronics, plastics. Dedicated lines. Low product mix. No cleaning cycles. No allergen flushes. Applied to a ready-meal plant running 40+ SKUs with mandatory sanitation between allergen classes, it is the wrong target — and it convinces plants their real gap is unachievable when in fact it is 10–17 points of recoverable ground.
The wrong target
85%
Discrete-industry world class
A dedicated automotive stamping line, one SKU, no CIP, no allergen management, no regulatory holds. Comparing your ready-meal plant to it hides where the real opportunity actually is.
The right target
75-82%
Multi-SKU allergen-managed food line
Built for high-mix ready-meal reality — mandatory CIP treated as planned stop, allergen flush time separated from unplanned downtime, SKU-level OEE benchmarking. This is the number worth chasing.
The Six Losses Ready-Meal Lines Fight Every Single Day
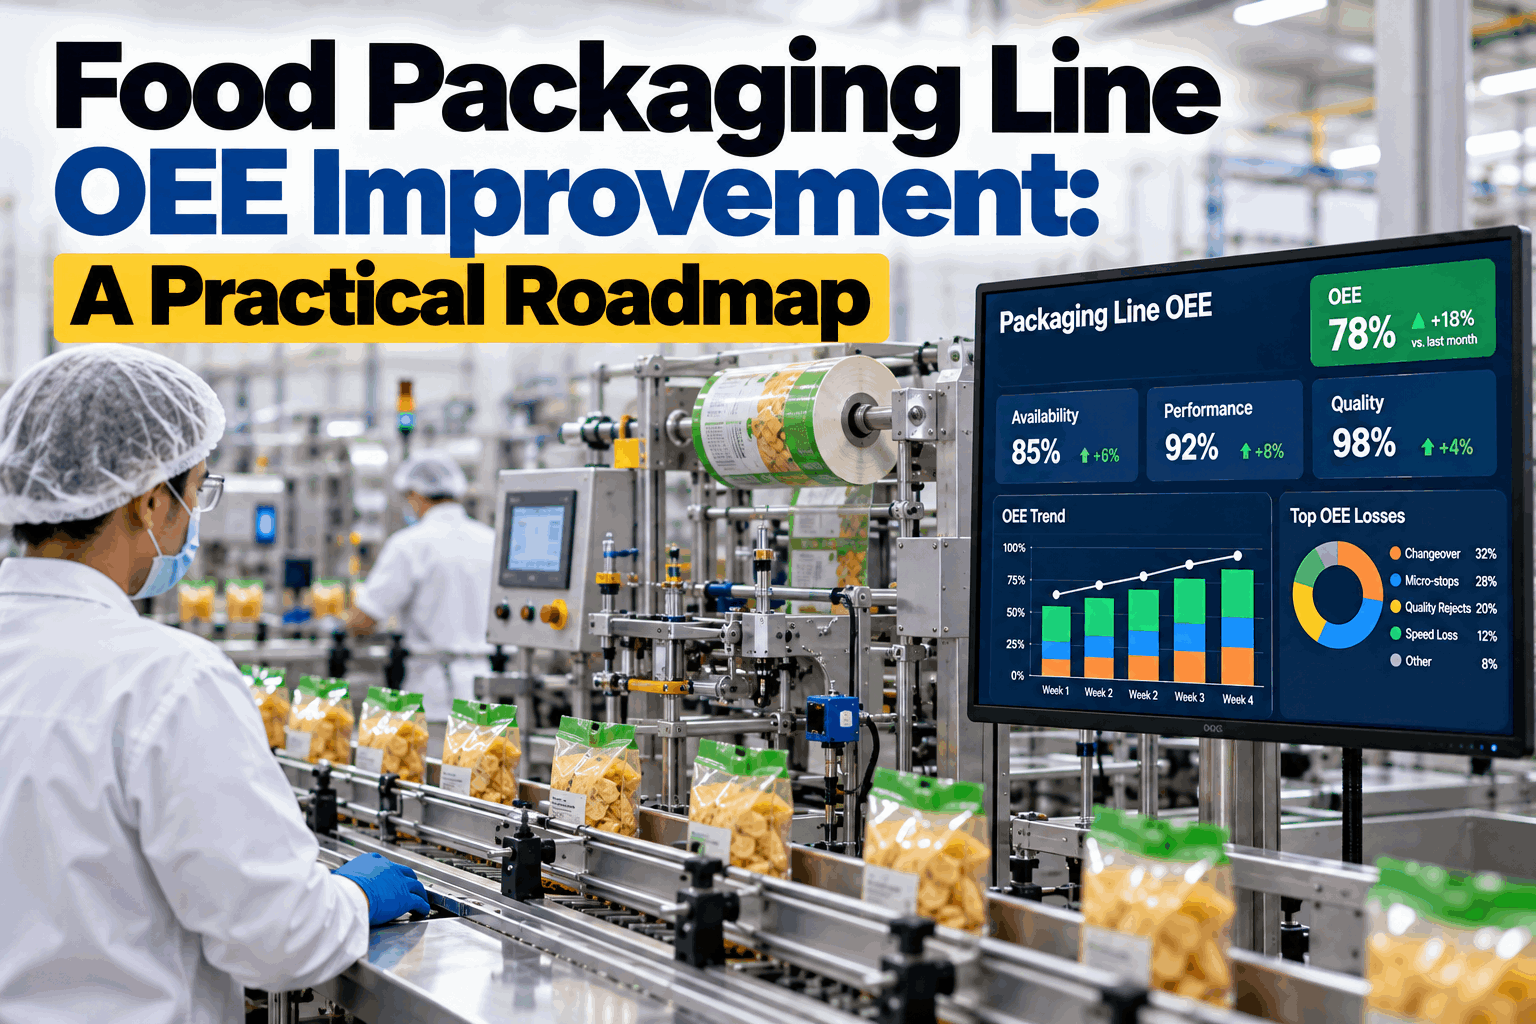
OEE breaks into three pillars — Availability, Performance, Quality — and six loss categories underneath them. In ready-meal plants, two or three categories almost always dominate the total gap. iFactory measures all six directly, so improvement effort goes where the points actually are.
Availability
Equipment Breakdowns
Filler head failures, conveyor jams, sealer breakdowns — often peaking during peak production runs, compounding the cost hit.
Availability
Setup & Allergen Changeover
SKU transitions, allergen flushes, CIP cycles, format adjustments. The single largest recoverable category in high-mix ready-meal.
Performance
Micro-Stops
Sub-3-minute stoppages at checkweighers, sealers, labellers — invisible to paper logs, brutal to throughput when they accumulate.
Performance
Reduced Speed
Line running below rated capacity — allergen-transition ramp-ups, upstream imbalance, mixed-skill crew variance across shifts.
Quality
Startup Rejects
First-flush product after CIP, qualification runs before each SKU, allergen-transition give-away. Small events, meaningful cumulative loss.
Quality
In-Run Defects
Fill weight variance, seal integrity failures, temperature-excursion rejects — recoverable yield that live process monitoring quantifies and stops.
The Allergen Matrix Trap
Most plants think they are managing changeover time. They are actually managing the number of allergen boundary crossings the schedule forces into existence — and the math is not linear. Moving from 40 SKUs across three allergen classes to 60 SKUs across four classes does not add 50% more flush events. It adds 120–180% more. Capacity disappears into the corners of a matrix nobody is looking at.
Allergen-transition matrix (illustrative 5-class plant)
From \ To
Nut-free
Dairy
Gluten
Soy
Tree nut
Nut-free
Dairy
Gluten
Soy
Tree nut
Same allergen — standard changeover
Minor — light flush
Mid — validated CIP
Full allergen flush + swab
The plant's real capacity is set not by SKU count but by how many "full-flush" cells the weekly schedule crosses. iFactory sequences the schedule to minimise those crossings — without breaking a single food-safety rule.
Want your own allergen matrix modelled? Book a demo and we'll show you how much capacity is hiding in your current sequence.
How iFactory Attacks Each Loss
The wrong approach is a blanket "OEE program" that spreads effort across ten initiatives and delivers 1–2 points. The right approach is a category-by-category attack — matching the right tool to the right loss, and letting the compliance evidence fall out as a by-product.
Loss category
iFactory attack
Typical gain
Allergen changeover
SMED on the dominant transitions, parallel-task orchestration, digital changeover checklist tied to swab results.
3-6 pts
Micro-stops
Sub-second event capture on checkweighers, sealers, labellers — Pareto by SKU, shift and cause code.
2-4 pts
Reduced speed
Rated-speed vs. actual live comparison, mixed-skill crew benchmarking, upstream feed-balance monitoring.
2-4 pts
Startup rejects
CIP first-flush volume tracking, transition-quality prediction, SKU-adaptive control limits.
1-3 pts
In-run defects
Fill-weight, seal-integrity and temperature drift with automated cause correlation to SKU and material batch.
1-3 pts
Food Safety and OEE in the Same Layer
Most food plants run efficiency and food safety as parallel programs, on separate systems, staffed by separate teams. iFactory folds them into one continuous evidence layer — because the same digital changeover checklist that speeds up a transition also delivers audit-ready allergen documentation.
HACCP CCP Monitoring
Critical control point readings captured continuously and time-stamped. Deviations trigger structured response and are logged in the same record inspectors will ask to see.
FSMA Preventive Controls
Preventive control evidence assembled as production runs. No end-of-shift paperwork chase, no missing initials, no reconstructed logs the day before an audit.
Allergen Segregation Verification
Digital changeover workflow linked to swab results, sanitation task completion, and QA release. The allergen firewall is enforced by the system, not by memory.
Retailer Audit Prep
Walmart, Target, Tesco and major-retailer audit prep collapses from weeks of assembly to a few clicks — the evidence is already there, continuous, and lot-traceable.
From Baseline to Best-in-Class
The typical improvement curve is not a jump — it is a staircase, one loss category at a time. This is what ready-meal plants report over a 12-month program when the focus is category-first rather than initiative-first.
58-65%
Baseline
Manual reporting, dominant losses invisible
+4-8 pts
Month 1-3
Sensor baseline, Pareto, first SMED on dominant transition
+6-10 pts
Month 4-9
Micro-stop attack, allergen-aware sequencing, SKU-level standard work
75-82%
Month 12
Sustained, cross-line rollout, food safety folded in
What Ready-Meal Plants Report
The outcomes below reflect what multi-SKU, allergen-managed food operators typically see within a 12-month program of category-first OEE improvement using continuous, sensor-based measurement.
+10-17 pts
OEE improvement
from mid-60s baseline to a 75–82% multi-SKU ceiling
40%
Changeover cut
via parallel-task orchestration and pre-staging
35-55%
First-pass reject drop
with SKU-adaptive process limits and drift detection
Weeks → clicks
Retailer audit prep
continuous evidence assembly replaces manual reconstruction
Want your plant's real loss profile mapped? Talk to our food team and we'll instrument one line for a two-week baseline.
Frequently Asked Questions
We already report OEE. Why would sensor-based measurement come out lower?
Every plant sees the same drop. Manual reporting undercounts micro-stops under three minutes, misclassifies changeover time as "planned", and assumes rated speed instead of measured speed. Direct-sensor benchmarks typically come in 8–15 points lower than manual reports. That gap is not a criticism of the team — it is where the recoverable opportunity has been hiding.
Can OEE improvement really happen without weakening allergen controls?
Yes — and that is the whole design point. Allergen flushes, CIP cycles, and swab verifications are non-negotiable. iFactory attacks the recoverable losses (micro-stops, speed, in-run defects, non-flush changeover minutes) while the compliance layer captures allergen sanitation evidence continuously. The same digital changeover checklist that speeds up transitions is the record inspectors need to see.
Does this work on our older equipment, or do we need new machines?
It works on existing equipment. iFactory reads from your PLC, SCADA and MES tags where they exist, and installs food-grade sensors non-invasively where they don't. Sensors survive washdowns and high humidity, and go on in under 30 minutes per machine with no equipment modification. No capital rip-and-replace, no line requalification.
How does iFactory handle the SKU-explosion problem in ready-meal?
SKU-level OEE is native, not a bolt-on. Every stop, every changeover, every reject is tagged with the SKU running at the time, so the Pareto surfaces the specific products and transitions that eat the most capacity. Combined with the allergen matrix view, this identifies which SKU sequences are worth defending and which ones are quietly destroying availability every week.
Where should we start if we've never done a formal OEE program?
Pick your highest-mix, highest-changeover line and instrument it. Two weeks of continuous data gives you the real OEE baseline, the loss Pareto, and the SKU-transition heatmap that decides where to attack first. Most plants recover 4–8 OEE points inside the following 30 days from that single Pareto. Book a demo and we'll show you what your first fortnight of data would look like.
Right target. Right losses. Right first.
See Where Your Ready-Meal Line's 15 Points Are Hiding
In a 30-minute demo we'll walk a live high-mix food dashboard, show the six-loss Pareto and allergen matrix that decide where to attack first, and scope a two-week baseline on your highest-mix line — food-grade sensors, no equipment modification, food safety controls untouched.
Allergen
aware sequencing
HACCP
+ FSMA evidence layer
2 weeks
to first baseline