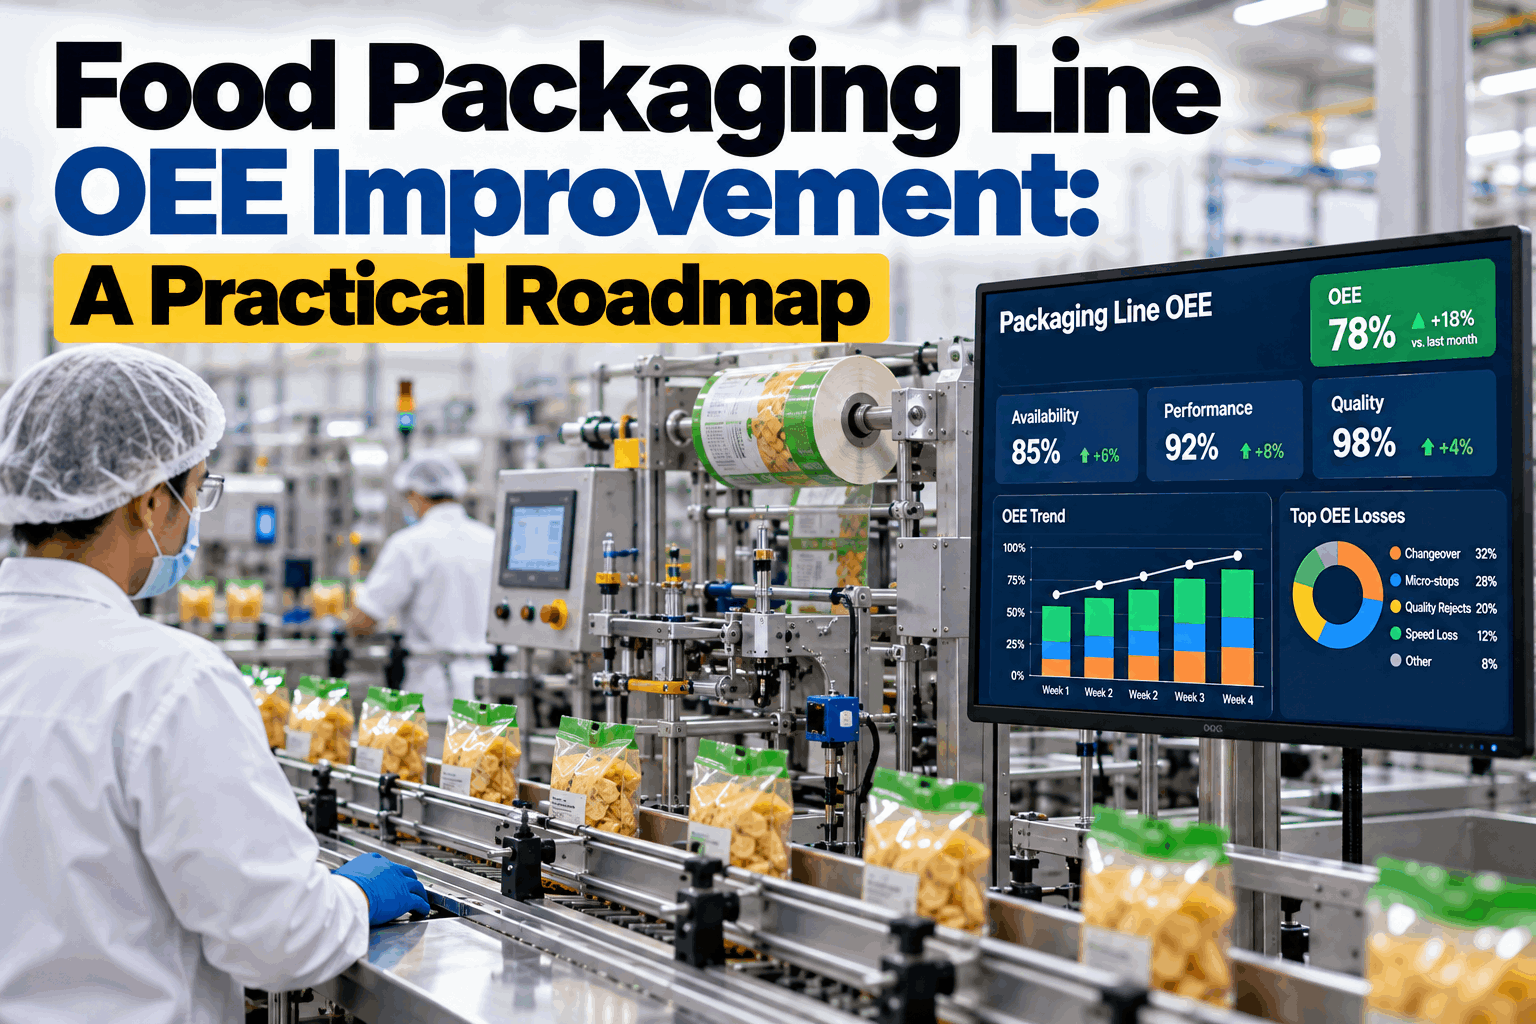
Changeovers, micro-stops and quality rejects quietly erode packaging line OEE. A structured approach that measures the six big losses, prioritizes the highest-impact constraints and closes the loop with clear ownership can lift packaging line OEE by 15 or more points. To map this roadmap to your own lines and data, book an OEE improvement walkthrough.
Food Packaging Line OEE Improvement: A Practical Roadmap
A structured guide for operations and continuous-improvement teams: measure the real losses on packaging lines, prioritize the constraints that cost the most and sustain the gains with clear routines.
- Measure availability, performance and quality on each packaging line
- Prioritize changeover, micro-stops and reject causes by impact
- Close the loop with owners, targets and routine reviews
Why Packaging Line OEE Needs Its Own Focus
Food packaging lines face frequent changeovers, format-specific constraints and quality rules that general plant OEE averages can hide.
A packaging line may run many SKUs, formats and pack sizes in a single week. Each changeover, film or carton change, labeler adjustment and cleaning step affects availability. Micro-stops from jams, sensor faults or infeed gaps reduce performance. Quality rejects from seal integrity, weight, coding or packaging defects reduce the effective output. Treating the line as a single average number without loss structure makes prioritization difficult.
Reduce setup and change time
Standardize sequence, tools, materials and checks so changeovers are repeatable and shorter.
Eliminate short interruptions
Capture and rank the frequent stops that rarely appear in longer downtime reports.
Protect first-pass yield
Link packaging rejects to process parameters, materials and upstream conditions.
Close the gap to ideal rate
Compare actual running speed with the validated ideal rate for each product.
A single percentage does not tell the team where to act. Break OEE into availability, performance and quality, then further into the specific stop, speed and reject categories that consume the most time or output.
Build a Reliable Packaging Line OEE Baseline
Improvement starts with definitions that operations, maintenance and quality all accept.
Agree on the ideal cycle time or rate for each product, the planned production time, and how stops, speed loss and quality loss are coded. Without shared definitions, trends become hard to trust and actions hard to sustain.
Prove the measurement and review process on a limited set of packaging lines before expanding. Consistent data on a few lines is more valuable than incomplete data across many.
Map the Six Big Losses on Packaging Lines
Most packaging OEE loss falls into a small number of recurring categories.
Use a simple loss structure that operations can act on. Rank each category by time or output lost so the team focuses on the largest opportunities first.
Breakdowns and changeovers
Long stops for equipment failure, changeover, cleaning and waiting for materials or people.
Speed loss and micro-stops
Running below ideal rate and frequent short interruptions that accumulate across shifts.
Rejects and rework
Packages that fail seal, weight, code, appearance or other checks and reduce good output.
A Practical Roadmap to Lift Packaging OEE
Move from measurement to sustained improvement in clear stages.
Define
Agree ideal rates, time base and loss codes for focus lines.
Measure
Collect reliable OEE and loss data for a representative period.
Prioritize
Rank losses by time and cost impact; select top constraints.
Act
Run focused improvements on changeover, micro-stops or quality.
Standardize
Lock in standard work, checklists and response rules.
Review
Hold short, frequent reviews that own the next actions.
A 10-minute reduction in average changeover or a clear cut in the top three micro-stop codes often delivers more OEE than a broad equipment upgrade. Match effort to impact and to the team's capacity to sustain the change.
Changeover Reduction on Packaging Lines
Changeovers are often the single largest controllable availability loss on multi-SKU packaging lines.
Separate internal work that requires the line to be stopped from external work that can be prepared while the previous run continues. Standardize tools, materials, settings and sequence. Time each major step and remove waiting, searching and rework.
Record the current method
Video or time the full changeover. Note waits, searches, adjustments and rework.
Move work external
Prepare film, cartons, tools, settings and people before the line stops.
Lock the new sequence
Document roles, sequence, target times and first-piece quality checks.
A faster changeover that produces more startup rejects can leave OEE unchanged or worse. Track changeover duration and the volume or duration of startup scrap together.
Micro-Stops and Performance Loss
Short stops and speed loss often exceed the impact of major breakdowns on packaging lines.
Micro-stops are easy to overlook because each event is brief. Over a shift they accumulate into a large share of lost runtime. Capture them with automatic event logging where possible, or with disciplined operator coding of the most frequent causes.
Quality Loss and First-Pass Yield
Every rejected package reduces OEE and adds material, labor and disposal cost.
Track packaging quality loss by defect type, SKU and shift. Connect rejects to process parameters, material lots and changeover or startup periods so the team can act on causes rather than only counting defects.
Integrity and appearance
Monitor seal temperature, pressure, time and film condition against defect rates.
Weight and volume
Control giveaway and underfill through checkweigher feedback and filler stability.
Print and verification
Reduce coding errors with verified print quality and automated inspection.
Damage and formation
Address carton, pouch or tray defects linked to forming and handling.
Startup and changeover scrap often have different causes from defects that appear during stable running. Track them separately so improvement actions stay focused.
OEE KPIs That Drive Action
Choose measures that show whether the process is improving and where to intervene next.
Make Packaging Line Losses Visible and Owned
When OEE, stop codes and quality data sit in separate systems, teams discover the real constraint only after the shift is over. A shared view of availability, performance and quality losses helps operations prioritize and follow actions through to closure.
From Data to a Reliable Improvement Routine
A short, repeatable review turns OEE numbers into decisions and sustained gains.
Start with one packaging line or a small group of similar lines. Validate the data, agree who owns each major loss category and test the review against recent performance before expanding the approach.
Select
Choose focus lines and the SKUs or formats that matter most.
Baseline
Lock definitions and collect a clean period of OEE and loss data.
Rank
Order losses by impact and select the top improvement themes.
Improve
Run focused actions on changeover, micro-stops or quality.
Standardize
Document the new method and response rules.
Sustain
Review results, exceptions and next actions on a fixed cadence.
Common Packaging OEE Mistakes
Many stalled OEE programs share the same avoidable problems.
Good practice
- Define ideal rate and time base with operations buy-in
- Break OEE into availability, performance and quality losses
- Focus on the largest controllable losses first
- Assign an owner and review cadence for each major theme
- Track both changeover time and startup quality
Common mistakes
- Reporting a single OEE number with no loss structure
- Ignoring micro-stops because each event looks small
- Setting ideal rates that the line cannot sustain
- Running improvement projects without standard work
- Reviewing data long after the shift when context is lost
Artificial gains from reduced cleaning, skipped checks or unrealistic ideal rates do not improve the plant. Sustainable OEE comes from removing real constraints while protecting safety, quality and compliance.
How Operations Analytics Can Help
Bring line events, quality results and production context into one reviewable view.
iFactory can connect operational data sources and provide a shared view of packaging line performance and process signals. A deployment’s usefulness depends on the quality, availability and integration of your source data. Teams should validate OEE definitions, stop codes, user permissions and escalation rules during the project, and retain production, maintenance and quality decisions with the responsible teams. For questions about fit, contact the support team.
Bring line signals together
Review runtime, stops, speed and quality data in one context.
Surface the largest losses
Focus attention on the constraints that cost the most time or output.
Make ownership clear
Track who is investigating a loss, leading a kaizen or updating standard work.
Learn from outcomes
Use OEE trends, recurring losses and missed actions to improve the routine.
Results depend on your source systems, line configuration and data quality. Define measures and validate them with your team using your own packaging lines and operating history.
Frequently Asked Questions
What is a realistic OEE target for a food packaging line?
Targets depend on product mix, changeover frequency, line age and quality requirements. Many plants aim first to stabilize measurement, then lift OEE by 10 to 15 points on focus lines through changeover, micro-stop and quality work before setting a higher long-term goal.
How should we treat changeover time in OEE?
Changeover is usually an availability loss within planned production time. Measure it consistently, separate internal and external work, and track startup quality alongside duration so faster changes do not increase scrap.
Why do micro-stops matter so much on packaging lines?
Each stop may last only seconds, but high frequency across shifts can exceed the impact of occasional long breakdowns. Capturing and ranking micro-stop causes is often one of the highest-return OEE activities.
Should every packaging line use the same ideal rate?
No. Ideal rate should reflect the validated maximum sustainable speed for each product or format under normal plant conditions. Using one rate for all SKUs hides performance loss on slower or more constrained products.
How often should we review packaging line OEE?
Daily short reviews for the focus lines keep context fresh. Deeper weekly or biweekly reviews can address systemic issues, standard-work updates and cross-shift variation.
How do we get started?
Select one or two packaging lines, agree definitions for ideal rate and loss codes, collect a clean baseline, rank the losses and run a focused improvement on the largest controllable constraint with clear ownership.
Review Your Packaging Line OEE Opportunities
Bring a sample of your line data and recent performance to discuss how your team measures losses, prioritizes constraints and sustains packaging OEE gains.
- 1Current OEE or efficiency reports for focus lines
- 2Stop reason or downtime codes and recent Pareto
- 3Changeover times for main formats or SKUs
- 4Quality reject or first-pass yield data
- 5A recent shift or week with notable losses