"Is 62% a good OEE?" is the wrong first question. The right first question is how that 62% was measured. A dairy line that counts CIP as planned time, a snack line that ignores stops under five minutes and a bakery that uses nameplate speed as its ideal rate can all report very different numbers for the same performance. Benchmarks only help when the measurement behind them is honest and consistent. Here are realistic OEE ranges for 2026 by food product category, and how to read them. To compare your own lines, book an OEE benchmark walkthrough.
Best OEE Benchmarks by Food Product Category for 2026
Realistic median, top-quartile and best-in-class OEE ranges for dairy, beverage, snack, bakery and meat lines, with the measurement rules that decide whether your number can be compared at all.
- What a median, top-quartile and best-in-class line looks like per category
- Why reported and measured OEE often disagree
- How to set a target you can actually reach
Why the Same Line Can Score 62% or 71%
Most benchmark gaps are measurement gaps in disguise.
OEE is a single multiplied score of availability, performance and quality, so small choices in how each is counted move the result a long way. Manually logged shift sheets also tend to miss short stops and speed drift, which sensor-based measurement picks up. Before comparing with any benchmark, check that your number is counted the same way the benchmark is. Our OEE team can review your definitions with you.
If your OEE jumps ten points the week you switch from shift sheets to automatic data, nothing improved on the line. The count simply became honest. Re-baseline first, then set targets.
OEE Benchmarks by Food Product Category
Median, top quartile and best-in-class, by category.
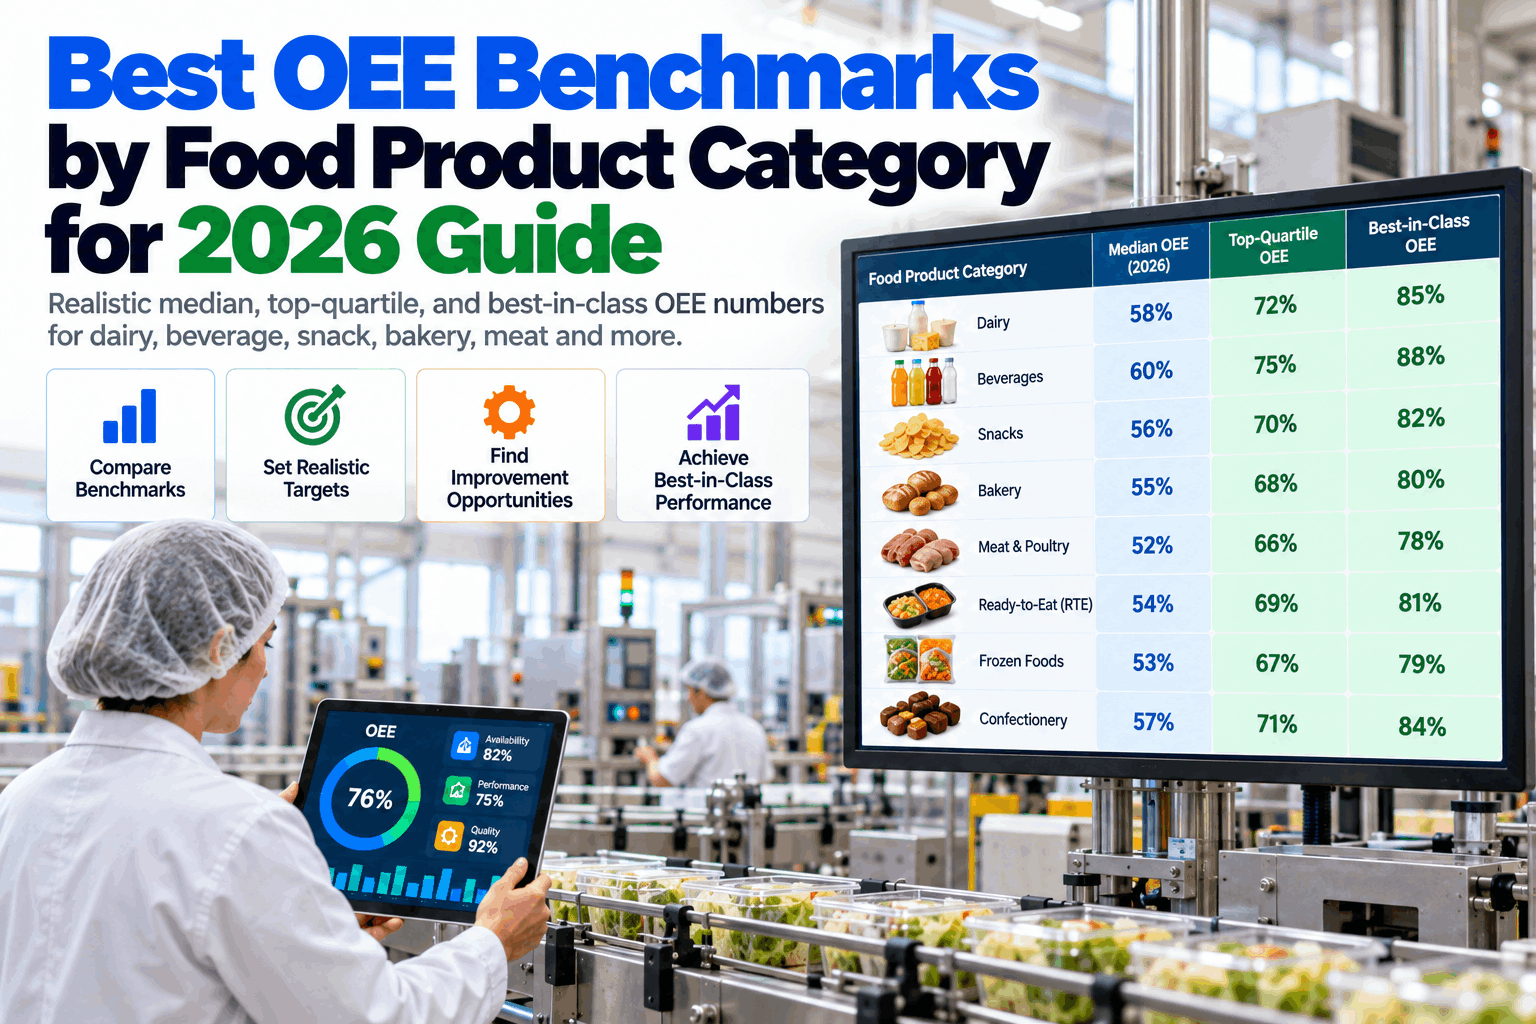
The ranges below are indicative and rounded. They are drawn from published industry ranges and typical plant experience, with automatic measurement and CIP counted as a loss. They are not a census, and plants differ by SKU mix, line speed and sanitation rules. Use them to place a line, not to judge it.
Medians sit in a narrow band, between the high fifties and mid sixties. The real spread is between the median and the best-in-class line in each category.
Meat and poultry, ready-to-eat, frozen and confectionery have less published data than dairy, beverage, snack and bakery, so treat those ranges as directional and check them against your own history. Dedicated high-volume bottling lines can sit above the beverage range, and multi-SKU packaged food lines often sit below it.
What Drives the Gap in Each Category
The biggest loss is different on every kind of line.
Chasing the same fix everywhere wastes effort. A dairy plant gains most by shortening CIP and start-up scrap, while a beverage line gains most by removing minor stops and speed drift. Knowing your category's main loss tells you where the next OEE points are.
Sanitation time
CIP length, valve sequences and start-up scrap after cleaning.
Minor stops
Filler and capper stops, jams and speed set below the ideal rate.
Changeovers
Flavour and format changes, oven transitions and start-up rejects.
Yield and washdown
Product variation, line balance and long washdown windows.
A single-SKU bottling line and a 40-SKU snack line will never share a benchmark. Compare lines with similar SKU counts, changeover patterns and sanitation rules.
What Five OEE Points Are Worth
Benchmarks only matter if the gap has a price. Here is a simple, honest way to see what closing a few points means on one line.
Using Benchmarks Without Fooling Yourself
A benchmark is a map reference, not a score to defend.
The most useful comparison is often your own line against its own history. Category benchmarks add context, but only after definitions and data are sound.
Define
Agree ideal rate, planned time and loss rules.
Measure
Capture time-stamped data from the machine.
Segment
Split by line, product family and shift.
Compare
Place each line in its category range.
Target
Aim for the next quartile, not world-class.
Review
Check losses monthly and re-set the baseline.
Compare against
- Your own line, month on month
- Lines with similar SKU count and format
- The next quartile in your category
Be careful with
- A generic 85% target for every line
- Numbers built from manual shift sheets
- Cross-industry comparisons
How iFactory Measures Food Plant OEE Automatically
Honest numbers first, then benchmarks.
iFactory collects machine states, counts and rejects directly from your PLCs and counters, applies your own definitions consistently and classifies every stop by reason. It shows OEE by line, product family and shift next to category benchmarks, and points to the losses that matter most. It runs on an on-prem server inside your plant network. Questions on fit go to our support desk.
Machine data
States, counts and rejects from PLCs and counters.
Every stop
Reason codes, including CIP and changeovers.
By category
Lines placed against median and top-quartile ranges.
Top losses
Ranked by hours and value, with leads for the team.
Gains depend on your lines, SKU mix and how quickly the top losses are acted on. We measure them on your own data during the pilot, rather than promising a general figure.
Turnkey AI: Delivered, Connected and Live in 6–12 Weeks
You do not build this. It arrives ready.
iFactory ships as a pre-configured NVIDIA AI server with the software pre-loaded. Rack it, plug in power and Ethernet, and the AI is live on your network. Our team handles cabling, network setup, PLC and SCADA integration, operator training and 24×7 remote monitoring. Data stays on your own network. For a scope matched to your plant, request a turnkey quote.
Ship, network and data
Server installed. Machine data connected and definitions agreed for the pilot lines.
Baseline and benchmark
True OEE measured and compared with category ranges. Top losses checked with your team.
Go-live and training
Dashboards and alerts live. Teams trained. 24×7 remote monitoring begins.
Frequently Asked Questions
What is a good OEE for a food plant in 2026?
Most food and beverage lines sit in the high fifties to mid sixties. A top-quartile line is usually in the low to mid seventies, and best-in-class lines reach the eighties, depending on the category.
Is 85% OEE a realistic target for a food line?
Rarely. The 85% figure comes from general manufacturing. Food lines lose time to CIP, allergen changeovers and sanitation, so a target in the next quartile of your own category is more realistic.
Should CIP time count as an OEE loss?
Either can be valid, but you must choose one rule and keep it. We suggest counting it as a loss and tracking it separately, so the cost of sanitation stays visible.
Why does our reported OEE not match measured OEE?
Manual logs miss short stops, speed loss and rounding, so they usually read higher. Time-stamped machine data counts these losses and often gives a lower, more useful number.
How often should we re-baseline?
Whenever the measurement method, ideal rates or product mix change in a big way, and at least once a year. Track the old and new method side by side for a few weeks.
How do we start?
With one or two lines that matter most and a clear definition of OEE. A 6-week pilot connects the data, measures true OEE and places each line against its category. To plan it, contact our team.
Know Where Your Lines Really Stand
In thirty minutes we look at how you measure OEE today, how your lines compare with their category and where the next points are. You keep the notes whether or not you go further with iFactory.
- 1Your current OEE definition and ideal rates
- 2A few months of reported OEE by line
- 3CIP and changeover schedules
- 4Product families and SKU counts per line
- 5The lines where you doubt the numbers