Your plant runs at 72% OEE. Is that good, average, or a red flag on the next OEM scorecard? The honest answer depends entirely on which shop you're measuring — because the universal "85% is world-class" benchmark was built for a 1960s Toyota assembly line and applied blindly to every shop in the plant. A paint shop at 72% is world-class. A stamping line at 72% is median. An assembly line at 72% is bottom quartile. The industry uses one number to judge five very different processes, and that's exactly why improvement targets keep missing. iFactory shop-level OEE tracking gives you the right benchmark for stamping, BIW, paint, and assembly — live, on-prem, and calibrated to your plant type in 6 to 12 weeks.
iFactory Automotive Analytics
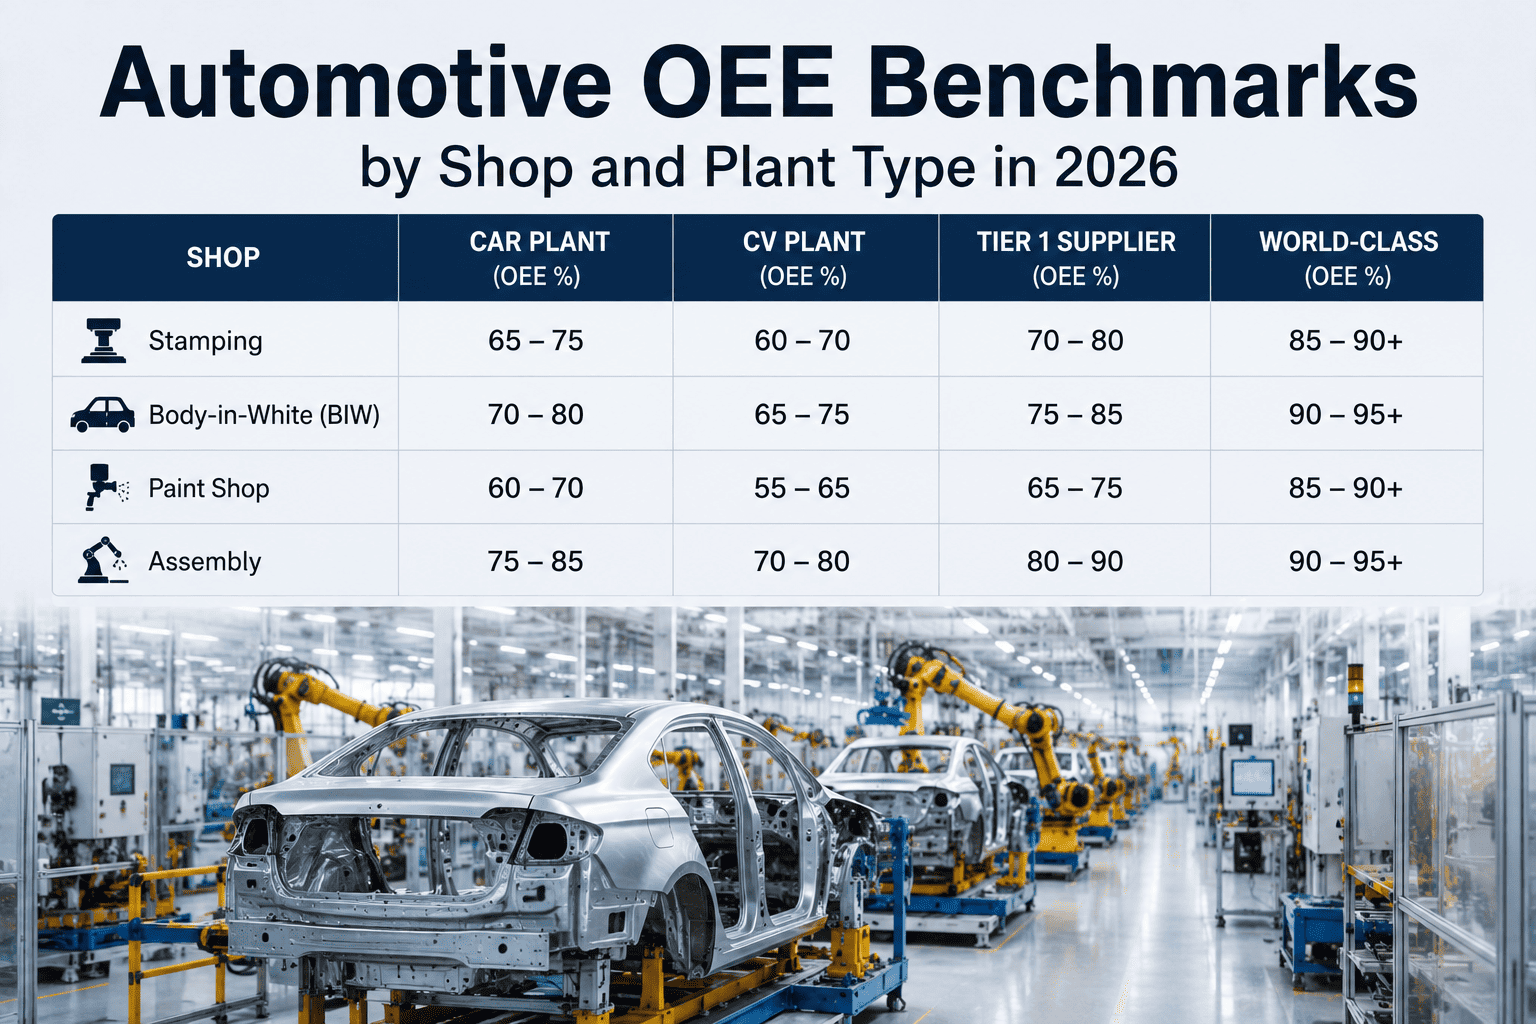
Automotive OEE Benchmarks by Shop and Plant Type in 2026
Stamping, BIW, paint, assembly — each shop has a different ceiling. See realistic benchmarks for OEM car plants, commercial vehicle plants, and Tier 1 suppliers, and where your line actually sits.
88-90%
assembly world-class
5-15pt
micro-stops hidden
6-12wk
to go-live, on-prem
The Universal 85% Benchmark Is Lying to You
The "85% world-class" number comes from Seiichi Nakajima's TPM work in 1984 — designed for high-volume Japanese automotive assembly running one product continuously with minimal changeover. Applied to a paint shop with mandatory cure cycles, it's the wrong target. Applied to a stamping press with die changes, it's the wrong target. Applied to a BIW cell with 200 robots micro-stopping, it's the wrong target. Every shop in an automotive plant has a different structural ceiling — and benchmarking against the wrong one is why 8 to 15 points of recoverable margin stays invisible.
One number
The Myth
85% OEE is world-class. Applied to every shop, every plant, every process — regardless of changeover profile, automation level, or cycle constraints.
Five ceilings
The Reality
Stamping tops out around 82%. Paint shops peak at 75%. BIW hits 80%. Final assembly reaches 90%. Each shop is capped by a different physics of production.
Right target
The Discipline
Benchmark per shop, per plant type, per your own history. A paint shop at 72% is world-class; a stamping line at 72% is median. The right target is what unlocks the right investment.
Shop-by-Shop OEE Benchmarks 2026
Aggregated ranges from ISO 22400-2 benchmark studies across US, UK, and European automotive plants. Read as directional — the right target for your line depends on volume, product mix, and equipment age, but the shape of the ceiling is structural. Higher automation and lower variant count push each ceiling up; more changeovers and more manual content pull it down.
Stamping
Die change is a structural OEE drag; tooling lifecycle drives the ceiling
40%60%80%100%
Typical 60-75%
World-class 78-82%
BIW / Welding
200+ robotic weld cells; micro-stops under 5 min are the hidden killer
40%60%80%100%
Typical 65-78%
World-class 80-85%
Paint Shop
Cure cycles, colour changes, booth cleaning cap what's structurally possible
40%60%80%100%
Typical 55-70%
World-class 65-75%
Final Assembly
Highest ceiling in the plant — sixty years of optimisation, dedicated lines
40%60%80%100%
Typical 65-78%
World-class 80-90%
Injection Molding
Bumper, dashboard, trim; changeover and tooling drive the spread
40%60%80%100%
Typical 65-78%
World-class 80-85%
Why Each Shop Has a Different Ceiling
OEE ceilings are structural, not aspirational. Every shop is capped by a different physics of production — the loss profile you inherit the day you build the line. Understanding what caps each shop is the difference between chasing a fantasy target and closing a real gap.
Stamping
Die Change Is the Ceiling
Every die swap consumes availability. SMED reduces it, but never zero. Tier 1 stampers routinely lose 8-15% of shift time to changeover, and the best programs cut that in half — not to zero.
BIW / Welding
Micro-Stops Kill the Number
A body shop has hundreds of robotic cells firing in sync. A single 90-second stop on any cell propagates through the sequence. Manual reporting misses 10-20% of this downtime completely.
Paint
Chemistry and Time
E-coat dip time, base and clear cure ovens, colour change purges — every physics-driven step is a non-negotiable availability cost. This is why paint shops structurally cap 10-15 points below assembly.
Assembly
Takt and Manual Content
The most-optimised shop in manufacturing. Ceiling is set by manual station variance and model-mix balancing — automation ceiling 88-90%, manual-heavy lines plateau at 60-70%.
Want to know which shop is dragging your plant's OEE down right now? Book a demo and we'll benchmark your line against the right ceiling.
Where Your Plant Actually Sits
Individual shop numbers matter, but the OEM scorecard looks at plant-level OEE — and the quartile ladder is where suppliers get sorted. A 5-point OEE gap to industry median translates to a 5-7% cost disadvantage on OEM sourcing decisions. The ladder below is where US and European automotive plants clustered across 2024-2026 benchmark studies.
Top Quartile
80-85%
Real-time OEE at station level. Operators categorise losses at point of occurrence. SMED cut changeover 60-80% from baseline. These are the plants OEMs move sourcing volume toward.
Top Half
70-80%
MES in place, shift-level dashboards, structured TPM. Micro-stops still under-reported by 10-15%. The recoverable gap to top quartile is almost entirely condition-based maintenance and loss categorisation discipline.
Bottom Quartile
45-55%
No real-time measurement, legacy equipment, weak data infrastructure. Plants starting here often see 20-30 point gains in 12-18 months because the starting number reflects measurement gaps, not just performance.
Benchmarks by Plant Type
Not all automotive plants are built the same. OEM car plants, commercial vehicle plants, and Tier suppliers operate under different customer pressure, volume profiles, and scorecard regimes. Benchmark ranges below reflect what plants of each type actually deliver — not the theoretical maximum.
OEM Car Plant
Passenger vehicle
70-82%
plant-level OEE
High-volume dedicated assembly lines, minimal SKU variation per shift, mature TPM. World-class OEMs hit 85-90% on final assembly. Legacy plants with mixed model runs cluster 6-10 points lower.
OEM CV Plant
Commercial vehicle
65-78%
plant-level OEE
Lower volumes, higher variant count, more manual content per unit. Structural ceiling sits 4-8 points below equivalent passenger car plants. World-class CV assembly reaches 80-83%.
Tier 1 Supplier
Direct to OEM
65-78%
plant-level OEE
IATF 16949 mandatory, JIT delivery, quarterly scorecard pressure. Top quartile hits 82%+ and wins sourcing volume. The typical Tier 1 stamping supplier runs 60-75%; injection 65-78%; assembly 65-78%.
Tier 2 / Tier 3
Sub-supplier
55-72%
plant-level OEE
Smaller scale, less data infrastructure investment, mixed equipment ages. The gap to Tier 1 reflects capability investment and scorecard pressure — not fundamental capacity. Plants moving to real-time measurement close half the gap inside 12 months.
Where Real OEE Losses Hide
Every shop leaks OEE differently, and every loss maps to Availability, Performance, or Quality. The Pareto shifts shop by shop — and knowing where to look first is the difference between six months of guessing and six weeks of recovery. These are the dominant loss patterns automotive plants report after moving from spreadsheet OEE to sensor-level tracking.
Stamping
Availability
Die changes, tooling failures, feed jams. Changeover reduction is the dominant lever — SMED programs commonly cut die-change time 40-60%.
BIW
Performance
Micro-stops on robotic cells, weld tip dressing, sequence propagation. Automated capture typically surfaces 10-20% more downtime than manual reporting.
Paint
Availability
Colour change purges, booth cleaning, oven ramp-ups, planned line clearance. Reducing colour changes per shift is often the single biggest OEE lever.
Assembly
Performance
Manual station variance, model-mix balancing, torque tool cycle time, part-supply micro-stops. Operator-level FPY data uncovers the largest hidden losses.
What Live Shop-Level OEE Tracking Shows
iFactory captures Availability, Performance, and Quality data automatically at every station — stamping press, weld cell, paint booth, assembly torque tool. Results roll up by shop, by shift, by plant, and by OEM scorecard line item, so the number you defend in your Tuesday review is the same number the OEM auditor sees on Wednesday.
OEE by Shop, Live
Stamping, BIW, paint, and assembly each on their own dashboard tile with the right benchmark next to the current number — not one universal target.
Micro-Stops Captured
Every stop under 5 minutes automatically logged and categorised. This is the 10-20% of downtime manual reporting has always missed.
OEM Scorecard-Ready
Real-time OEE with audit-grade event logging, shift reports, and operator declarations — the format IATF 16949 auditors and OEM scorecards demand.
Benchmark Against Your Own
Track shift, product, operator, and lot performance against your rolling baseline — closing the gap between your typical shift and your best shift is the fastest recoverable margin.
Curious where your stamping, BIW, or paint shop actually sits against the 2026 benchmarks? Talk to our automotive team and calibrate your line against real ranges.
On-Prem AI, Live in 6 to 12 Weeks
OEE data, downtime codes, and shift-level performance are competitive IP — and IATF 16949 audit records must stay in your control. The iFactory AI runs on a pre-configured edge server on-premise, with all processing inside your firewall and no external egress required to operate. It ships racked and ready with the software pre-loaded, and a structured deployment puts it live on your shop floor in a single quarter.
1
Rack the edge server
A pre-configured edge AI server slots into your plant, shipped pre-validated with the OEE and benchmark software pre-loaded.
2
Connect station data
Read-only links to presses, weld cells, paint PLCs, and torque tools let the AI learn each shop's true baseline OEE.
3
Shop dashboards go live
Shop-level OEE, benchmark comparisons, and micro-stop capture run on-prem inside your firewall — your production data never leaves the plant.
What Live Shop OEE Delivers
Moving from spreadsheet OEE to sensor-level tracking converts directly into recovered capacity, better OEM scorecards, and margin recovered from the losses that were previously invisible. These reflect outcomes automotive plants report in the first two quarters after go-live.
5-15pt
OEE recovered
margin from micro-stops and losses that manual reporting missed
10-20%
More downtime seen
automated capture surfaces micro-stops that never made the log
15-25%
Higher scorecard
operations dimension gains on OEM scorecards for plants with strong OEE programs
Audit
Ready by default
IATF 16949 compatible event logs, operator declarations, shift reports
Frequently Asked Questions
What's a realistic OEE benchmark for an automotive paint shop in 2026?
Automotive paint shops typically run 55-70% OEE, with world-class plants reaching 65-75%. The ceiling is structural — cure cycles, colour change purges, and booth cleaning consume availability by design. Benchmarking a paint shop against the 85% "world-class" number is the fastest way to demoralise a team that's already running at the top of what's physically possible. The right comparison is against paint shops of similar volume and colour mix.
Why is stamping OEE lower than final assembly OEE?
Die changeover. Every stamping press runs multiple parts across a shift, and each die swap consumes 20-90 minutes of availability. Even with mature SMED programs cutting changeover 40-60%, stamping structurally caps around 82% — 6 to 8 points below what a dedicated assembly line can hit. Comparing the two directly punishes the wrong shop.
How do BIW OEE benchmarks compare between OEM and Tier 1 body shops?
OEM body shops typically run 70-80% OEE on high-volume dedicated lines; Tier 1 BIW sub-assembly cells run 65-78% due to smaller runs and higher variant count. World-class in both cases sits at 80-85%. The single biggest gap in BIW OEE is micro-stop capture — plants running paper-based reporting typically under-count downtime by 10-20% because sub-5-minute stops rarely get logged manually.
What OEE should a Tier 1 automotive supplier target on an OEM scorecard?
Top quartile on OEM scorecards sits at 80-85% plant-level OEE; median sits at 60-65%; bottom quartile at 45-55%. A 5-point gap to industry median translates to a 5-7% cost disadvantage on sourcing decisions. What separates top-quartile Tier 1s is not the target — it's real-time station-level measurement, point-of-occurrence loss categorisation by operators, and SMED programs that cut changeover 60-80% from baseline.
Does our OEE data leave the plant, and how long to deploy?
No data leaves. The AI runs on a pre-configured edge server on-premise, with all processing inside your firewall and no external egress, and the integration is read-only. The server ships racked with software pre-loaded, and a structured deployment puts shop-level OEE dashboards live in 6 to 12 weeks. The fastest way to see fit is a demo on your own shop mix — book one and bring your current OEE report by shop.
Benchmark the Right Shop Against the Right Number.
See Your Real OEE by Shop, Shift, and Line
Bring your current OEE report by shop. We'll show live OEE at every station, the right benchmark for each shop, and the exact losses dragging your plant score down — all on an on-prem server, live in 6 to 12 weeks.
Live
micro-stops captured