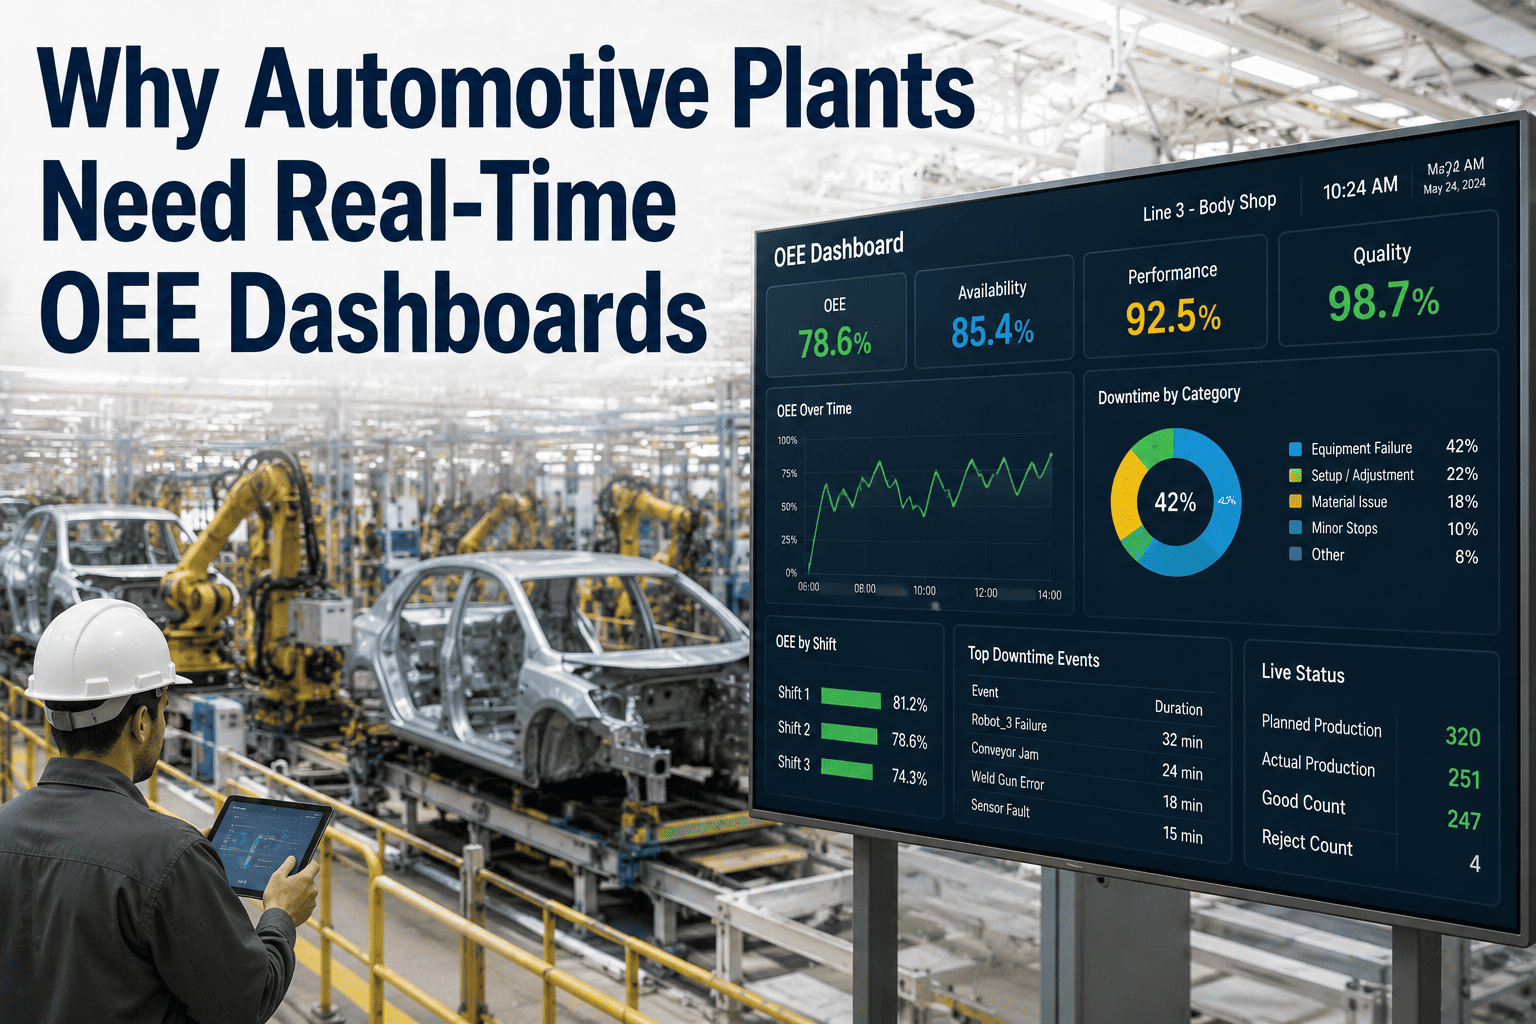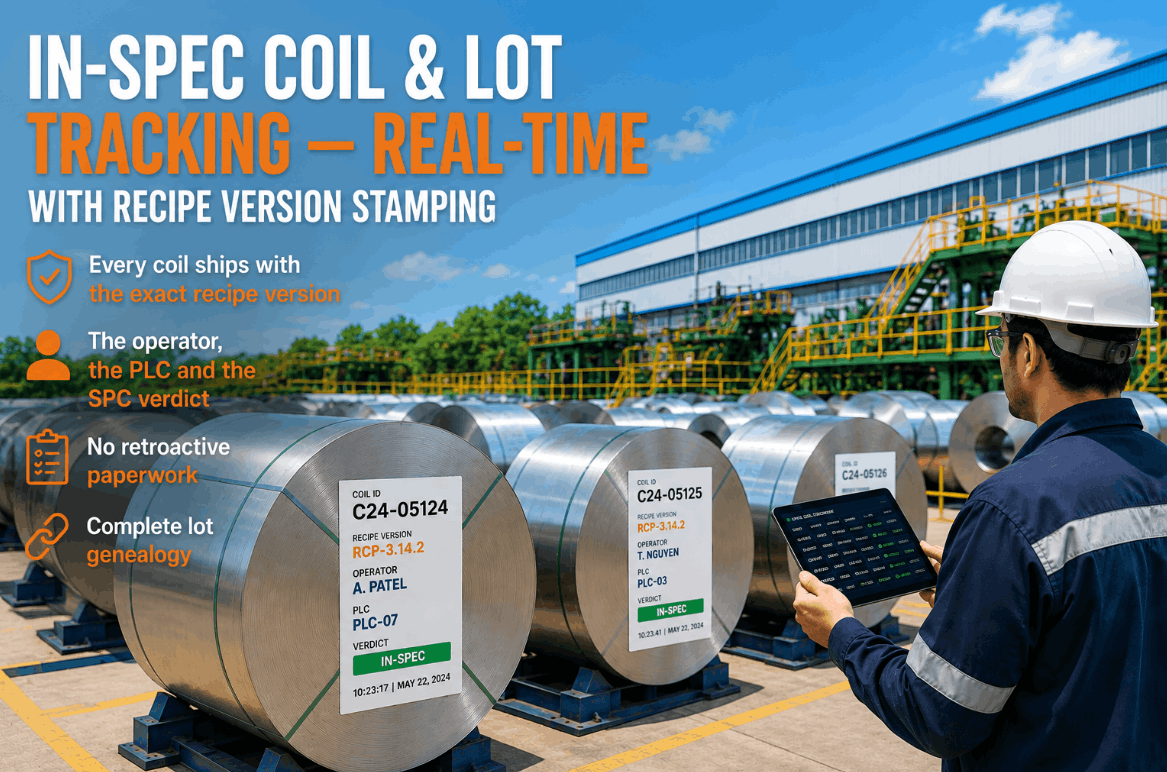
Ask a stamping plant for its OEE and you will usually get one number for the whole press shop, calculated at the end of the week from spreadsheets. That number hides almost everything that matters. One press loses an hour to a die change overrun, another runs slow, a third makes splits. Real-time OEE tracking shows availability, performance and quality for every press, every shift and every part as it happens, so supervisors fix losses during the shift instead of reading about them on Monday. See it in a press shop demo.
Stamping Press Shop OEE Tracking with Real-Time AI
Live OEE per press, per shift and per part, broken down into availability, performance and quality. AI names the biggest loss on each press and shop floor displays show it to the people who can fix it.
- How OEE works for presses, with a worked example
- The stamping losses hiding inside each factor
- Per-press, per-shift and per-part views on the floor
Why Weekly Press Shop OEE Changes Nothing
A single number, calculated late, cannot point to a fix.
OEE multiplies three factors: availability, performance and quality. Averaged across a press shop and a week, those factors blur together. Supervisors cannot tell whether the shop lost time to die changes, slow running or scrap, or which press caused it. And by the time the report arrives, the shift that could have acted is long gone. Our press shop specialists can review how you measure OEE today.
Shop averages
Good presses hide the poor ones.
Manual entry
Stops and counts written by hand at shift end.
Wrong ideal rate
One speed used for every die and part.
Too late to act
Losses seen days after they happened.
OEE for Presses: A Worked Example
Three factors, multiplied together.
Take one press on an eight-hour shift with 450 minutes of planned production time. The die runs a single part per stroke with an ideal rate of 15 strokes per minute. The press stops for 48 minutes in total, makes 5,610 strokes and 56 parts are scrapped or sent for rework. All figures are illustrative. Run the numbers for your presses in a working session.
A press may be rated for a high stroke rate, but a deep-draw die or a heavy gauge part may only run safely at a much lower speed. Using the press rating as the ideal rate makes performance look poor on difficult parts and hides real speed losses on easy ones. Hold an ideal rate for each die and part number.
The Stamping Losses Inside Each Factor
OEE only helps when each loss has a name.
Every factor breaks down into specific losses that press shop teams already know well. Tracking them separately turns a percentage into a list of things to fix. Map your loss codes with our implementation team.
Planned die changes are part of the schedule. The loss worth chasing is the time beyond the standard. Recording both shows whether die change improvement work is paying off, press by press.
Data From the Press, Not the Clipboard
Most of what OEE needs is already in the press controls.
Presses already know when they are running, how many strokes they make and often which die is loaded. Real-time OEE reads this directly, so the numbers are not rebuilt from memory at shift end. Operators only add what the machine cannot know, such as the reason for a stop. Short stops under a set length can be grouped automatically, so operators are not asked to explain every thirty-second pause. Check your press data with our integration team.
Run and stop
Press running, stopped or in die change, from the PLC.
Stroke counter
Every stroke counted at the crank.
Die and part ID
From die identification or the schedule.
Stop reasons
Picked on a press-side screen or spoken.
See Every Press's OEE While the Shift Is Running
Availability, performance and quality for every press, shift and part, with the biggest loss named and shown on the floor.
Die Change Time and Quick Changeover
In most press shops, die changes are the biggest single block of lost time.
Quick die change methods, often called SMED, move work outside the stop: dies staged in advance, bolsters ready, tools and cranes waiting. Live OEE makes the effect visible. Each die change is timed from last good part to first good part, split into internal steps where possible, and compared with its standard. Supervisors see which changes overrun and why. Plan changeover tracking with our lean team.
Last good part
Clock starts on the outgoing die.
Die out
Unclamp, remove, move away.
Die in
Set, clamp, connect.
Try-out
First hits and adjustments.
First good part
Clock stops, time against standard.
Minor Stops, Misfeeds and Die Protection
Short stops add up to long losses.
A press that stops for thirty seconds forty times a shift has lost twenty minutes, often without anyone recording a single stop. Misfeeds, double blank detection, die protection sensor trips and part-out-of-position faults all cause these short stops. Counting them automatically, by cause where the press signals one, shows which dies and coils trigger them most. Review stop signals with our controls team.
Misfeeds
Strip or blank not in position.
Double blanks
Two blanks detected before the hit.
Die protection trips
Sensors stopping the press to protect the die.
Transfer faults
Fingers or grippers losing a part.
Per Press, Per Shift, Per Part
The same data, cut three ways, answers three different questions.
Each view serves a different person, and all three come from the same press data, so nobody argues about whose numbers are right. The press view tells the maintenance and press team where the machine is losing. The shift view helps supervisors compare crews and routines. The part view shows which dies and parts drag OEE down wherever they run. Plan your views with our operations team.
Where is the machine losing?
Breakdowns, speed losses and die change overruns by press.
Where are routines different?
Setups, start-up scrap and minor stops by crew.
Which dies need work?
Parts with low speed or high scrap on any press.
AI That Names the Biggest Loss
Not just a number, but what to do about it.
The AI watches each press's losses through the shift and highlights the one costing the most OEE right now. It compares with the same die on other shifts and presses, and can point to likely causes, such as a coil supplier, a die that needs maintenance or a speed setting left low after a change. Ask our AI team how it works on your data.
Shop Floor Displays That Drive Action
Put the numbers where the people who can change them will see them.
Large displays beside each press line show live OEE, the current top loss and progress against the shift target. Displays run from the on-prem server, so they keep working even if the plant's link to the outside world is down. Operators see the effect of a quick die change or a speed increase straight away, and supervisors can walk the shop and see every press at a glance. Plan displays with our implementation team.
What the press display shows
- Live OEE and its three factors
- Parts made against the shift plan
- Current stop and how long it has lasted
- Top loss for this shift
What the shop display shows
- Every press, ranked by OEE
- Presses stopped right now
- Die changes in progress against standard
- Shop OEE against target
Press Shop OEE Mistakes to Avoid
OEE is easy to calculate and easy to get wrong.
These are common problems when press shops start tracking OEE. A short readiness review can avoid them.
What works
- Ideal rate per die and part
- Stops and strokes read from the press
- Named losses inside each factor
- Live displays at the press
What fails
- One shop number, once a week
- Press rating used as the ideal rate
- Planned die changes counted as losses
- Comparing OEE between very different presses
How iFactory Runs Real-Time Press Shop OEE
Press shop OEE, on your own network.
iFactory reads press states, strokes and die IDs, calculates OEE with its availability, performance and quality breakdown for every press, shift and part, names the top loss and shows it on shop floor displays. It runs on an on-prem AI server inside your plant. Fit questions go to our solutions team.
Live OEE
Per press, shift and part.
A × P × Q breakdown
Each factor with named losses.
Die-based ideal rates
Performance judged fairly per part.
Top loss alerts
The biggest loss named each shift.
Floor displays
Press and shop views where work happens.
On-prem
Production data stays in the plant.
The OEE figures on this page are worked examples. Your own OEE depends on your presses, dies, parts and practices, and we measure it on your data during the pilot.
Turnkey AI: Delivered, Connected and Live in 6–12 Weeks
You do not build this. It arrives ready.
iFactory ships as a pre-configured NVIDIA AI server with the software pre-loaded, racked and ready. Rack it, plug in power and Ethernet, and the AI is live on your network. Our team handles cabling, network setup, PLC, SCADA, DCS and CMMS integration, press PLC links, operator training and 24×7 remote monitoring. Data stays on your network. For a scope matched to your plant, request a turnkey quote.
Ship, network and data
Server installed. Press states, stroke counters and die IDs connected.
Model training and pilot
Ideal rates and loss codes set up. Live OEE runs on a few presses.
Go-live and training
OEE live for the whole press shop with floor displays. Teams trained. 24×7 monitoring begins.
Frequently Asked Questions
How is OEE calculated for a stamping press?
OEE equals availability times performance times quality. Availability is run time over planned time, performance is actual strokes or parts over the ideal for the die, and quality is good parts over total parts.
What ideal rate should we use?
The ideal rate for each die and part, not the press's maximum rating. Difficult parts often run slower by design.
Should planned die changes count against OEE?
Many plants treat planned die changes as planned time and track overruns as availability losses. Agree the rule once and keep it the same everywhere.
How does it handle multi-out dies?
By counting parts per stroke for each die, so performance and quality are calculated in parts, not just strokes.
Where does the data come from?
From the press PLC for run state and strokes, from die identification or the schedule for the part, and from operators for stop reasons.
Are minor stops included?
Yes. Short stops are counted automatically from the press state, and their cause is recorded where the press signals it, such as misfeeds or die protection trips.
Can it work on older presses?
Yes. Where controls are limited, simple sensors for stroke and run state can be added.
Where is the data stored?
On the on-prem server inside your plant, shown on shop floor displays and dashboards.
How do we start?
Start with a few presses. A 6-week pilot connects press data, sets ideal rates and runs live OEE with floor displays. To plan it, contact our team.
Find Your Press Shop's Biggest Losses This Week
In thirty minutes we look at your current OEE method and press data, and show what live per-press OEE would reveal. You keep the notes either way.
- 1Your press list and types
- 2Current OEE report
- 3Ideal rates by die if you have them
- 4Die change standards
- 5The press that always seems behind