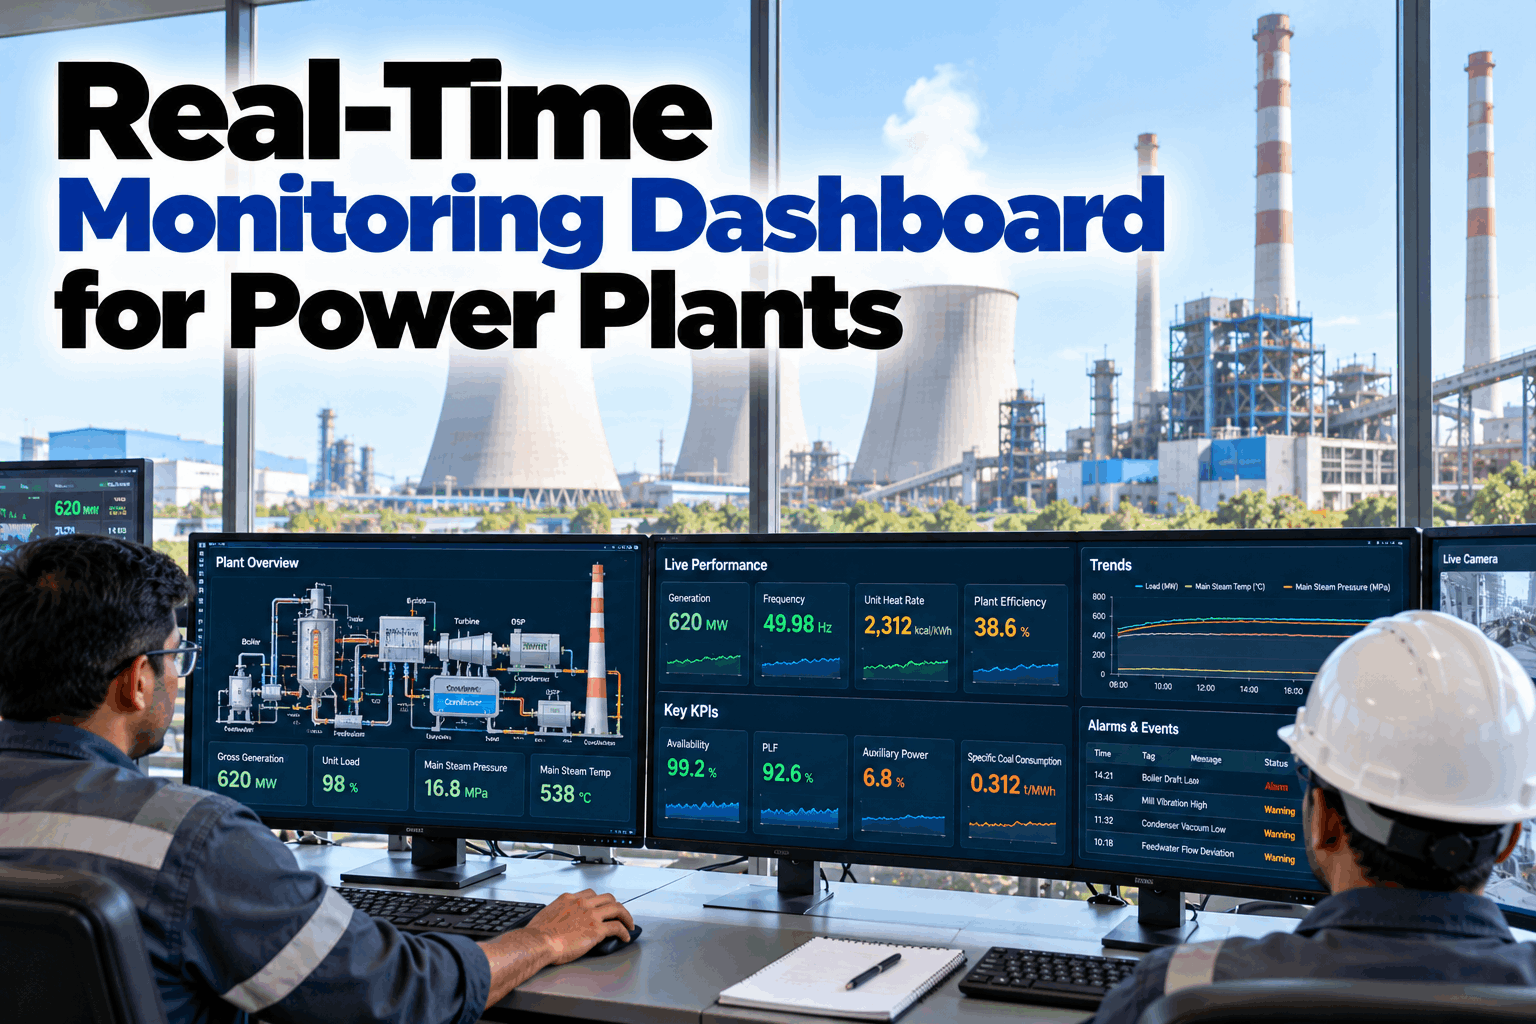
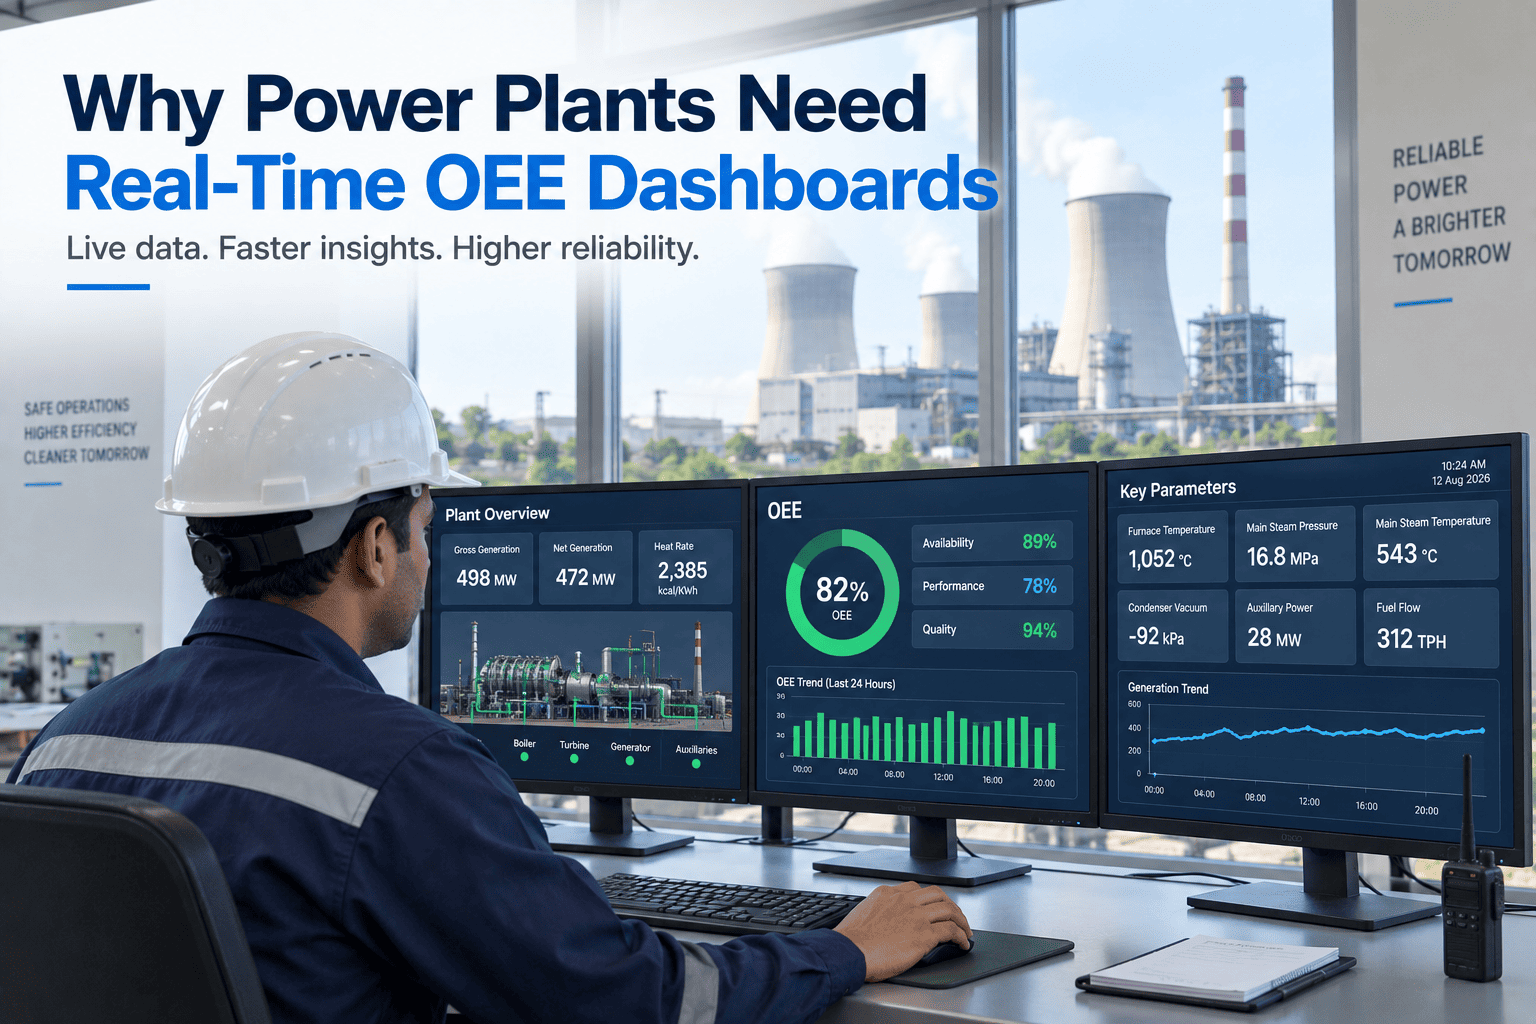
A power plant control room is not short of data. The DCS shows thousands of points, SCADA covers the switchyard and balance of plant, and the historian stores years of trends. What the operator does not have is a single live view that says how much generation, efficiency or auxiliary power is being lost right now, and why. Losses such as a drifting heat rate, a steam temperature running low or a condenser slowly losing vacuum are found the next morning in a report, when the hour that caused them is gone. Live monitoring changes that by exposing the loss while there is still time to act. iFactory Real-Time Monitoring Dashboard sits on top of your existing DCS, SCADA and historian and turns their data into an operator view of what is being lost, in plain units, during the shift.
iFactory Real-Time Monitoring - Power Plant Production Execution
Real-Time Monitoring Dashboard for Power Plants
A live operator dashboard layered on your existing DCS, SCADA and historian. Output, heat rate, steam conditions and auxiliary power are shown against target, with the loss named while the shift can still correct it.
Live
losses shown during the shift, not in tomorrow's report
No replacement
built on top of the DCS, SCADA and historian you already run
Against target
every KPI compared with its target, with the gap in clear units
Operator-first
designed for the control room desk, not only for management
Why Existing Control Systems Do Not Expose Losses
The control systems in a power plant are built to run the process safely. They are not built to answer the question an operator or shift manager asks every hour: where is the plant losing output or efficiency right now. These are the six gaps.
01
Data is there but not organised
Thousands of tags are available, but nothing ranks the few that matter for the loss the operator can actually influence.
02
Alarms show limits, not losses
An alarm fires when a value crosses a limit. A heat rate that is 1.5% worse than target for six hours never triggers one.
03
Losses found in next-day reports
Efficiency and output reviews happen after the shift. By then, the conditions that caused the loss have changed and the opportunity to correct them has gone.
04
Historian trends need an engineer
Building a trend, aligning tags and comparing periods takes time and skill, so the data is used mainly for investigations and not for daily decisions.
05
Handover depends on memory
The outgoing shift tells the incoming shift what they remember. Open issues and drifting parameters can be lost in a busy handover.
06
Several screens, no single view
Output is on one system, steam conditions on another and auxiliary power on a third. No screen adds them into a picture of total loss.
The Live Unit View - Parameters Against Target
The unit view compares each key parameter with its target in real time and shows the gap, so operators can see which parameters are costing the most. The figures below are an illustrative example for a 500 MW unit.
Parameter
Live
Target
Gap
Status
Likely cause
Net output
478 MW
480 MW
-2
On target
Within normal band
Net heat rate
2,415 kcal/kWh
2,380 kcal/kWh
+35
Act
Combined effect of steam temperature and back pressure
Main steam temperature
531 deg C
540 deg C
-9
Watch
Spray valve opening above normal
Condenser back pressure
10.8 kPa
9.5 kPa
+1.3
Watch
Cooling water temperature rising
Auxiliary power
6.0%
6.0%
0
On target
No action needed
Unit summary
5 parameters
-
-
3 off target
Output looks fine while efficiency is quietly slipping
Layered on Your DCS, SCADA and Historian
The dashboard does not replace any control system. It reads from the sources you already trust, applies the calculations and targets, and shows the result to the people who can act on it.
DCS
What is read
Boiler, turbine and generator process values used for live KPI calculation
How
Read-only connection through an approved interface, agreed with your OT team
What operators get
Efficiency and loss calculated live from the same values they already trust
SCADA
What is read
Switchyard, balance of plant and auxiliary system data
How
Existing SCADA data points mapped to the dashboard without changing control logic
What operators get
Auxiliary power and export figures on the same screen as unit performance
Historian
What is read
Past values for targets, comparisons and trends
How
Historian queried for history, so targets reflect your own best operating periods
What operators get
Current shift compared with the last shift and with best demonstrated performance
What an Operator Dashboard Should Show
A dashboard that repeats the DCS screens adds nothing. These are the five elements that make a live view useful at the control desk.
1
Live KPIs against target
Output, heat rate, steam conditions, back pressure and auxiliary power, each with its target and gap, updated continuously.
Example: Heat rate +35 kcal/kWh against target
2
Loss in units the shift understands
Each deviation converted into MW, fuel or cost per hour, so the operator sees what the gap is worth.
Example: Steam temperature deviation costing 1.8 MW
3
Trend against the last shift and best run
A comparison with the previous shift and with the best demonstrated performance, so a drift is visible before it becomes a limit alarm.
Example: Back pressure rising for the last 3 hours
4
Alerts that name the loss
Notifications describe the loss and its likely driver, not just a tag crossing a threshold.
Example: Efficiency loss - spray flow above normal
5
Shift handover summary
An automatic record of the shift's performance, open deviations and actions, ready for the incoming team.
Example: 3 open deviations, 1 action pending
Want to see your unit on a live dashboard? Book a demo - tell us your DCS, SCADA and historian and we will show how the data maps to the operator view.
How iFactory Builds the Live View - Five Stages
The path from control system data to an operator dashboard is five steps, none of which touches your control logic.
01
Connect
Read-only links to the DCS, SCADA and historian.
02
Clean
Tags mapped, units aligned and bad data flagged.
03
Calculate
Efficiency, heat rate and loss derived from live values.
04
Display
Operator screens built around loss and target, not tag lists.
05
Act
Alerts and handover records push findings to the right person.
What Live Monitoring Delivers
The return comes from acting on losses in the hour they occur, instead of reading about them in the next day's report.
Same shift
Losses seen in time
drift visible while the operator can still correct it
One view
DCS, SCADA, historian
data from every system on a single screen
In MW and cost
Gaps made clear
every deviation shown in terms the shift understands
Clean handover
Nothing lost
open issues carried to the next shift automatically
Frequently Asked Questions
Do we need to replace or modify our DCS or SCADA?
No. The dashboard reads data from your existing systems and does not change their configuration or control logic. The connection method is agreed with your OT and cybersecurity teams at scoping, and the dashboard is intended as a monitoring layer, not a control layer.
Is this for operators or for management?
Both can use it, but the design starts with the control room operator. Screens show what the operator can influence in the shift, and the same data is available in summary form for shift managers and plant heads. A dashboard that operators do not use will not find losses.
Where do the targets come from?
Targets are agreed with your team. They can come from design data, from guarantee tests, or from your own best demonstrated operating periods in the historian. They are reviewed with the plant, so operators work to numbers they consider fair and achievable.
Can we start with one unit?
Yes. A single unit is a sensible starting point. We connect the data sources, build the live view and agree the targets, and your operators use it for a few weeks before you decide on wider rollout. Book a demo and we will help you choose the first unit.
Stop finding losses in tomorrow's report.
See a Live Monitoring Dashboard on Your Own Power Plant Data
Tell us which DCS, SCADA and historian you run. We will show how your data becomes a live operator view with targets, losses and shift handover.