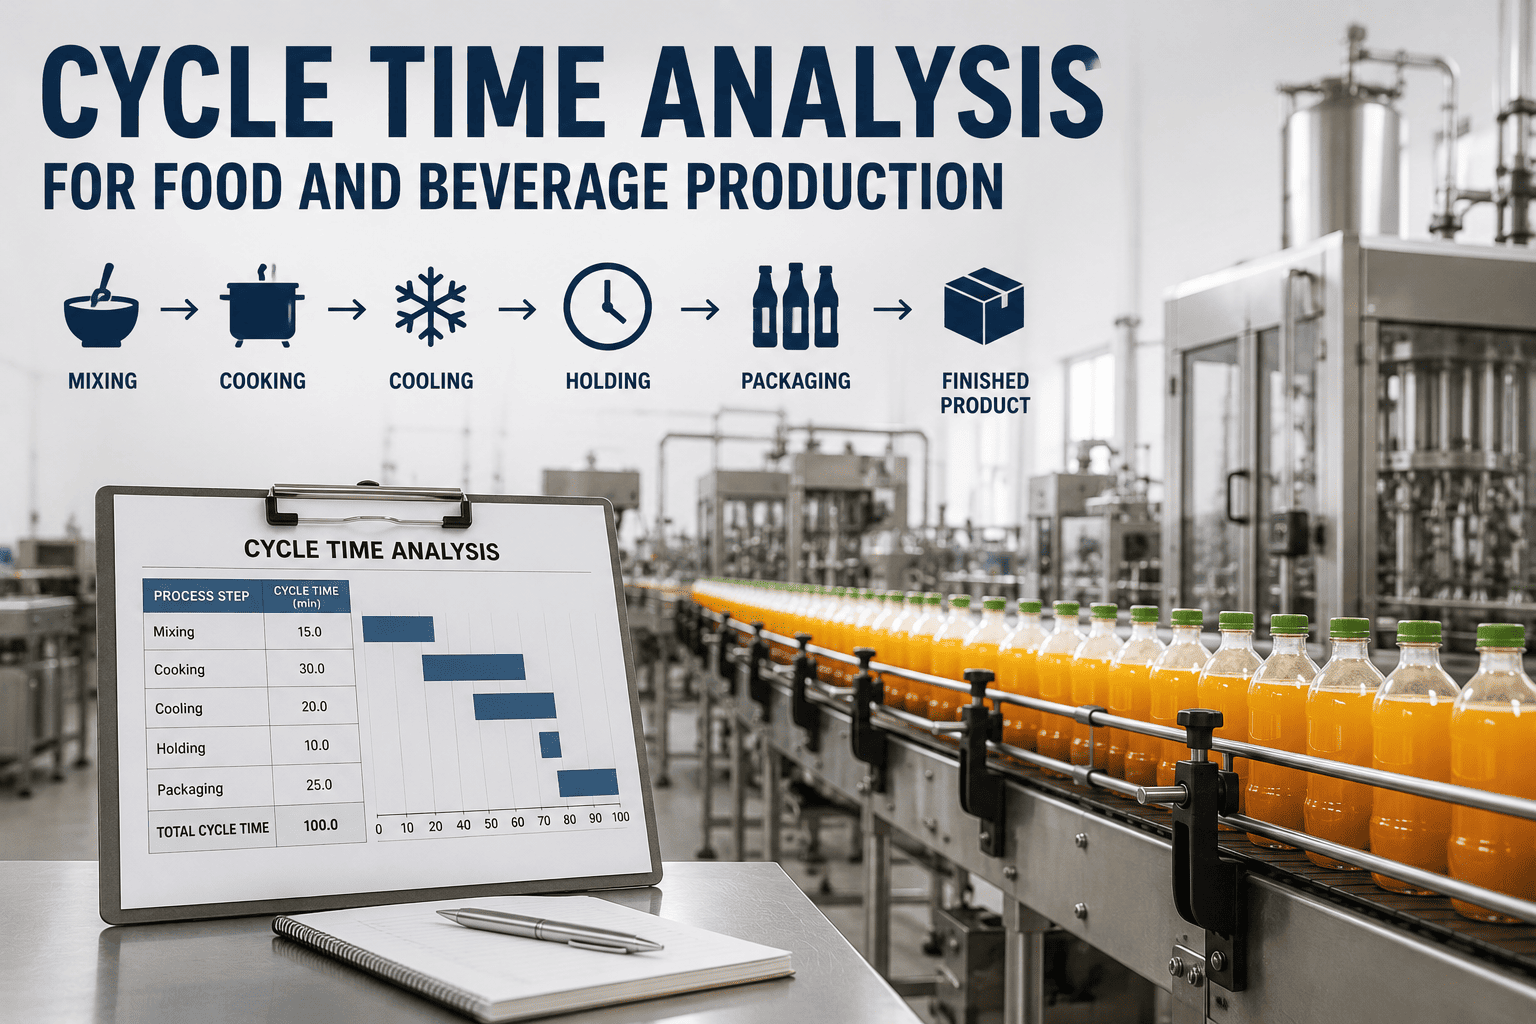
Food and beverage cycle time is rarely one number — it is a chain of them. Mixing takes 25 minutes but the schedule allows 40. Cooking is 45 minutes but the vessel sits idle for 15 waiting for the next available cooler. Cooling is 30 but holding stretches to 25 while the filler finishes a run of the previous SKU. Filling runs at design speed on paper but averages 78% of that after minor stops. Labeling adds a 6-minute changeover that nobody counted. Packaging finishes the SKU 3 hours after mixing started — and the shift report shows a "normal" batch. Nothing broke. Nothing tripped. And somehow the line ran 62% OEE, right at the F&B industry average, well below the 82-85% world-class benchmark. The gap between the ideal cycle time and the observed cycle time is where the money hides. In the Nutriset packaging-line case, TeepTrak documented an 18-point OEE gain in just 4 weeks — mostly by making the changeover and CIP losses visible for the first time. That is the shape of the opportunity. iFactory cycle time analytics maps every stage from receiving to palletizing, quantifies where the minutes actually go, and closes the gap between design cycle and observed cycle — SKU by SKU, line by line.
iFactory Cycle Time Analytics for F&B
Map, Trend, and Shrink Cycle Time — Mixing to Palletizer
See every stage of your food line's cycle in one view. Attribute lost minutes to changeover, CIP, minor stops, or holding — then close the gap between the ideal cycle and the one you're actually running.
+18 pts
documented in 4 weeks
40%
changeover cut via SMED
Where the Minutes Actually Go
On a typical multi-SKU food line, roughly 40% of the cycle time is value-adding work — mixing, cooking, filling, sealing. The other 60% is waiting, changing over, cleaning, restarting, and re-priming. Cycle time analysis makes that split visible. This is what a real batch looks like from the moment ingredients enter the mixer to the moment the pallet leaves the line.
01
Mixing / Blending
25 min
Recipe wait, weigh-out delay, dosing accuracy checks
02
Cooking / Processing
45 min
Temperature ramp variability, hold-time overrun for safety margin
03
Cooling / Chilling
30 min
Cooler capacity waiting, cold-chain hand-off delay
04
Holding
25 min
Filler still on previous SKU — hidden wait, biggest recoverable gap
05
Filling
32 min
Minor stops, speed drift, fill-weight drift, seal integrity kicks
06
Labeling / Coding
6 min changeover
Ribbon change, label-web thread, coder cleaning — uncounted in most reports
07
Packing / Palletizer
18 min
Carton feed jams, palletizer wait, wrap-machine timing
Total observed cycle
181 min
Ideal cycle: 112 min • Gap: 69 min per batch
The Five Cycle-Time Killers in F&B
Every food line loses cycle time in slightly different places, but almost all the losses fall into five categories. Naming them separately is the first step to attacking each one on its own terms.
01
Changeover overrun
40% avg gap
A 90-minute planned changeover routinely runs 130. That's a direct availability loss on every SKU switch — and in high-mix operations, a decisive one.
02
CIP overrun
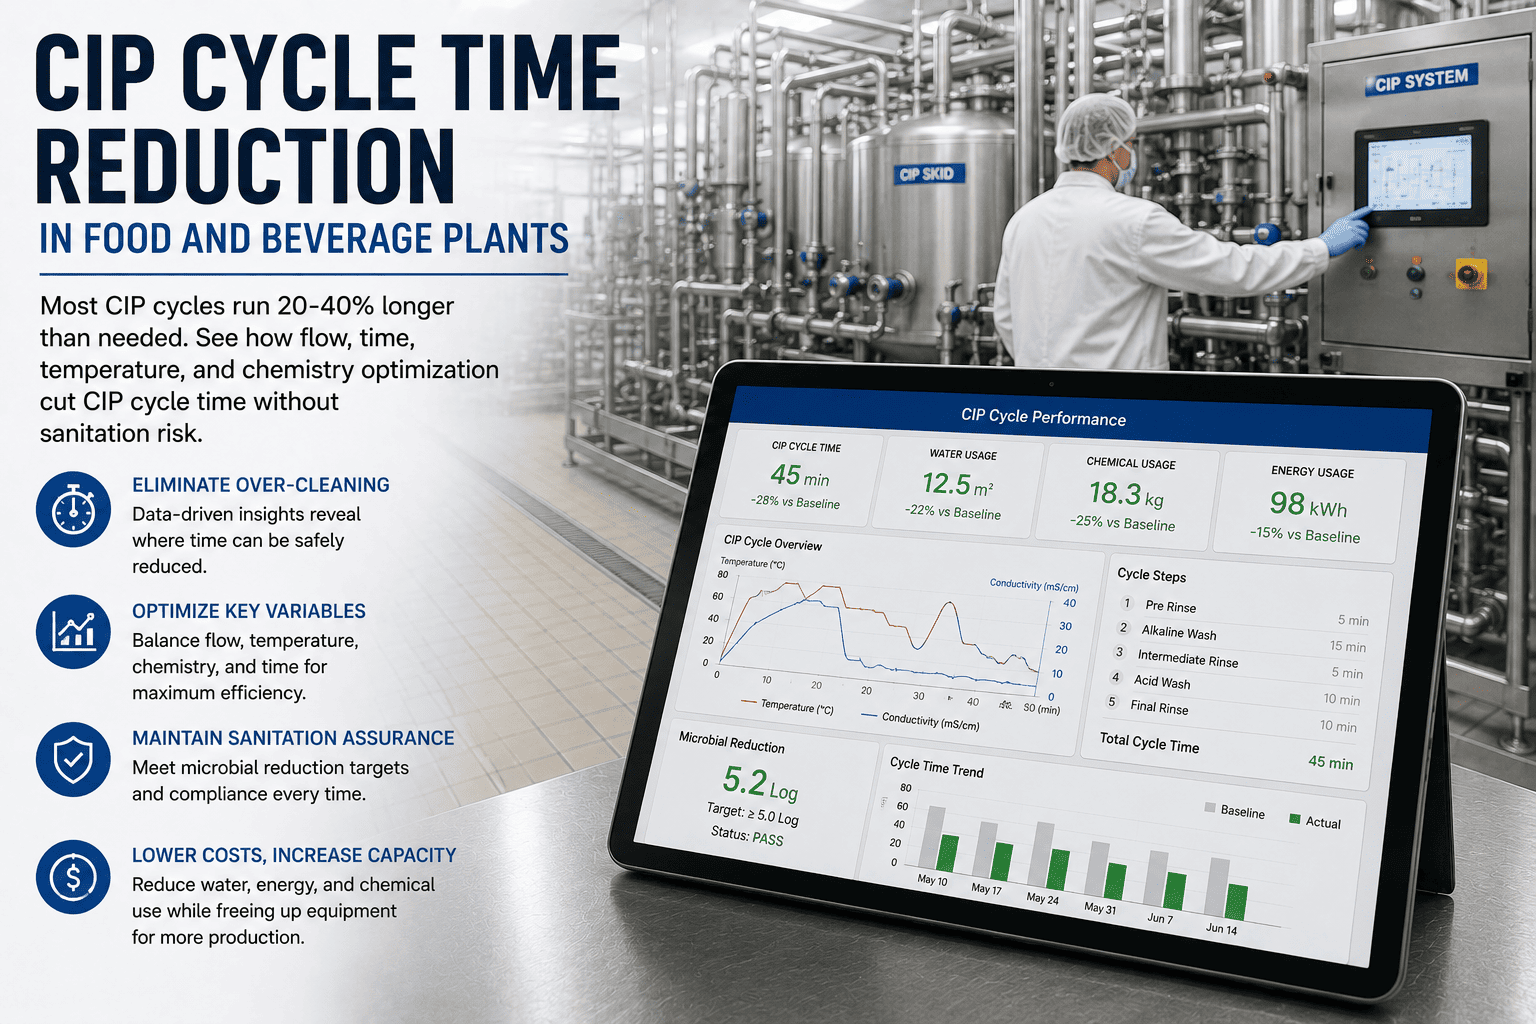
45 min lost typical
Clean-in-place cycles are structural — you can't skip them. But CIP that runs 45 minutes on a 30-minute recipe is a recoverable loss most plants have accepted as normal.
03
Minor stops
2+ hrs / shift
40 micro-stops of 3 minutes each add up to 2 hours per shift — and none of them show up on the downtime report. They just drop performance quietly.
04
Speed drift
15-20% drop
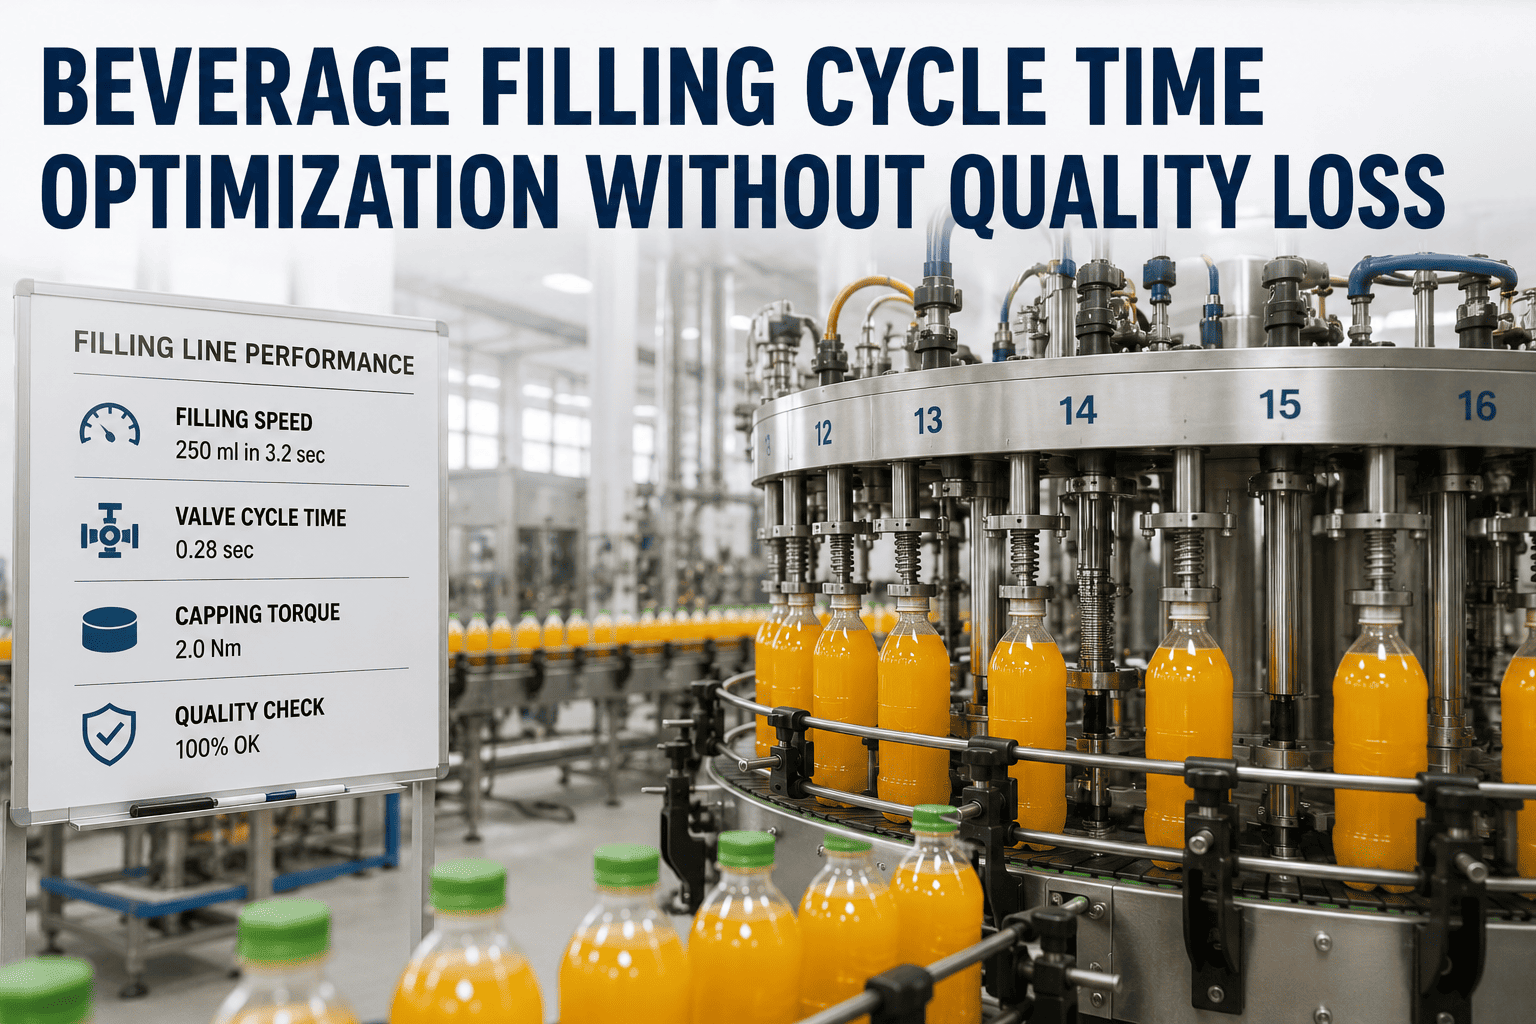
A line running at 78% of rated speed "feels safe" but drains Performance from 95% to 80% across the shift. Rarely investigated because it never triggers an alarm.
05
Holding / hand-off
15-25 min hidden
The bake-line ready but the packer isn't. The cooler done but the filler still on the previous SKU. Hidden waits show up as "in progress" on the MES but they're pure cycle-time loss.
Want to see this decomposition on your own line? Book a demo and bring 30 days of run history from one production line.
Cycle Time by F&B Segment
The dominant loss category isn't the same across food segments. Bakery lives on ovens and proofing; dairy lives on CIP and cold-chain; beverage lives on filler speed and changeover. Knowing where your segment's cycle time actually leaks tells you where to point the analytics first.
Bakery
Mixing › Proofing › Baking › Cooling › Packaging
Biggest loss: Proofing wait, cooling tunnel throughput, packaging changeover
Dairy
Reception › Pasteurization › Fermentation › Cooling › Filling
Biggest loss: CIP cycles, tank changeover, filler minor stops
Beverage
Syrup room › Mixing › Filling › Labeling › Packaging
Biggest loss: SKU changeover, filler speed drift, label web breaks
Ready meals / snack
Prep › Cooking › Assembly › Sealing › Freezing / packing
Biggest loss: Assembly balance, sealer minor stops, freezing tunnel bottleneck
Frozen & IQF
Reception › Prep › IQF tunnel › Weighing › Packaging
Biggest loss: IQF tunnel constraint, packaging speed, cold-chain compliance holds
Meat / protein
Reception › Cutting › Weighing › Packaging › Cold chain
Biggest loss: Cutting-line balance, weighing throughput, packaging integrity kicks
How iFactory Runs the Cycle-Time Loop
Cycle time analytics only pay back when the losses reach a work order or a SMED workshop. iFactory ties every measured minute of gap to a specific improvement action.
01
Ingest PLC & SCADA
Stage-level cycle timestamps from filling, capping, labeling, and packaging assets pulled from existing PLCs.
02
Map Every Stage
Cycle broken down mixing › cooking › cooling › filling › labeling › packing, with wait, CIP, and changeover called out separately.
03
Attribute the Loss
Each lost minute mapped to its category — changeover, CIP, minor stops, speed drift, holding — per SKU, per line, per shift.
04
Route the Action
Changeover overrun triggers SMED review. Chronic minor stop triggers work order. Speed drift triggers root cause.
05
Verify Cycle Recovery
Post-action cycle chart confirms the stage cycle time dropped and held — action closes with quantified minutes recovered.
What Cycle Time Compression Delivers
Cycle time is one of the few metrics where every minute saved converts directly to throughput. These are the outcomes food and beverage plants typically see after moving from monthly OEE reports to live stage-by-stage cycle analytics.
+15 pts
OEE gain
typical 12-month improvement roadmap
40%
Changeover cut
achievable with visibility-driven SMED
Hours
Micro-stop recovery
per shift, from surfacing chronic patterns
HACCP
Audit ready
timestamps and holds captured continuously
Curious what a +15 OEE gain would mean in cases and dollars on your line? Talk to our F&B team — we'll size it against your SKU mix and run schedule.
Frequently Asked Questions
How is cycle time different from OEE?
OEE tells you how effective the equipment is; cycle time tells you where the minutes went to produce that OEE score. A line at 62% OEE has 38 percentage points of loss spread across availability, performance, and quality — cycle time analysis reveals which specific stage of the process (mixing, cooling, filling, packaging) is generating that loss and why. Both metrics matter, but only cycle time analysis points to the fix.
Our lines already have PLC and SCADA — why do we need another layer?
Because PLCs know the machine state but don't compute cycle attribution. They can tell you the filler was running at 78% of design speed for the shift, but they don't tell you 22 of those 40 lost minutes were changeover overrun, 12 were micro-stops under 3 minutes, and 6 were speed drift from wear. iFactory sits on top of your existing PLCs and SCADA and does that attribution automatically — no new hardware in most cases.
Does this work for our SKU mix?
Yes — and high-mix is exactly where cycle time analysis pays back most. Every SKU has a different ideal cycle, different changeover profile, different CIP requirement. Analyzing all of them together in one report averages the signal away; iFactory breaks the cycle down per SKU, per line, per shift, so you can see which product family is dragging OEE and where.
How fast do improvements actually show up?
Faster than most plants expect. The Nutriset case documented an 18-point OEE gain in 4 weeks — mostly from making changeover time visible enough to attack with SMED. Realistic longer-term expectation is +10 to +15 points over 12 months. The value comes from the visibility, not from the software running the arithmetic — once the losses are named, teams can attack them the same week.
Does this support HACCP and FSMA compliance?
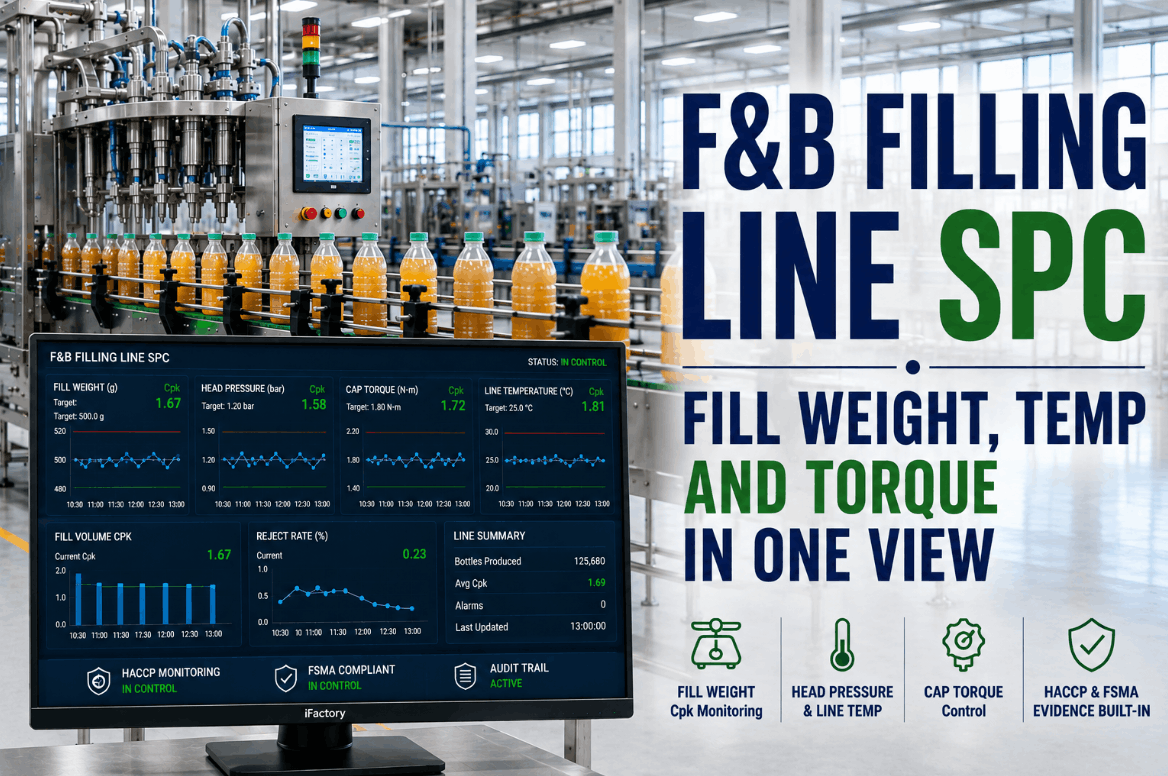
Yes — every stage timestamp, hold event, and CIP cycle is captured continuously and forms the audit trail regulators expect. HACCP records, preventive-control evidence, and allergen verification are assembled as production runs, so compliance reporting stops being a separate exercise. Bring one line and one week — we'll show what the audit trail looks like on your actual data. Book a demo and we'll walk it live.
Stop paying for cycle time nobody measures.
See Where Your Line's Minutes Actually Go
Bring one line and 30 days of PLC and SCADA history. We'll map the cycle stage by stage, attribute every lost minute to changeover, CIP, minor stops, speed drift, or holding — and show the specific gaps a SMED workshop or work order can close this month.
HACCP
audit trail included