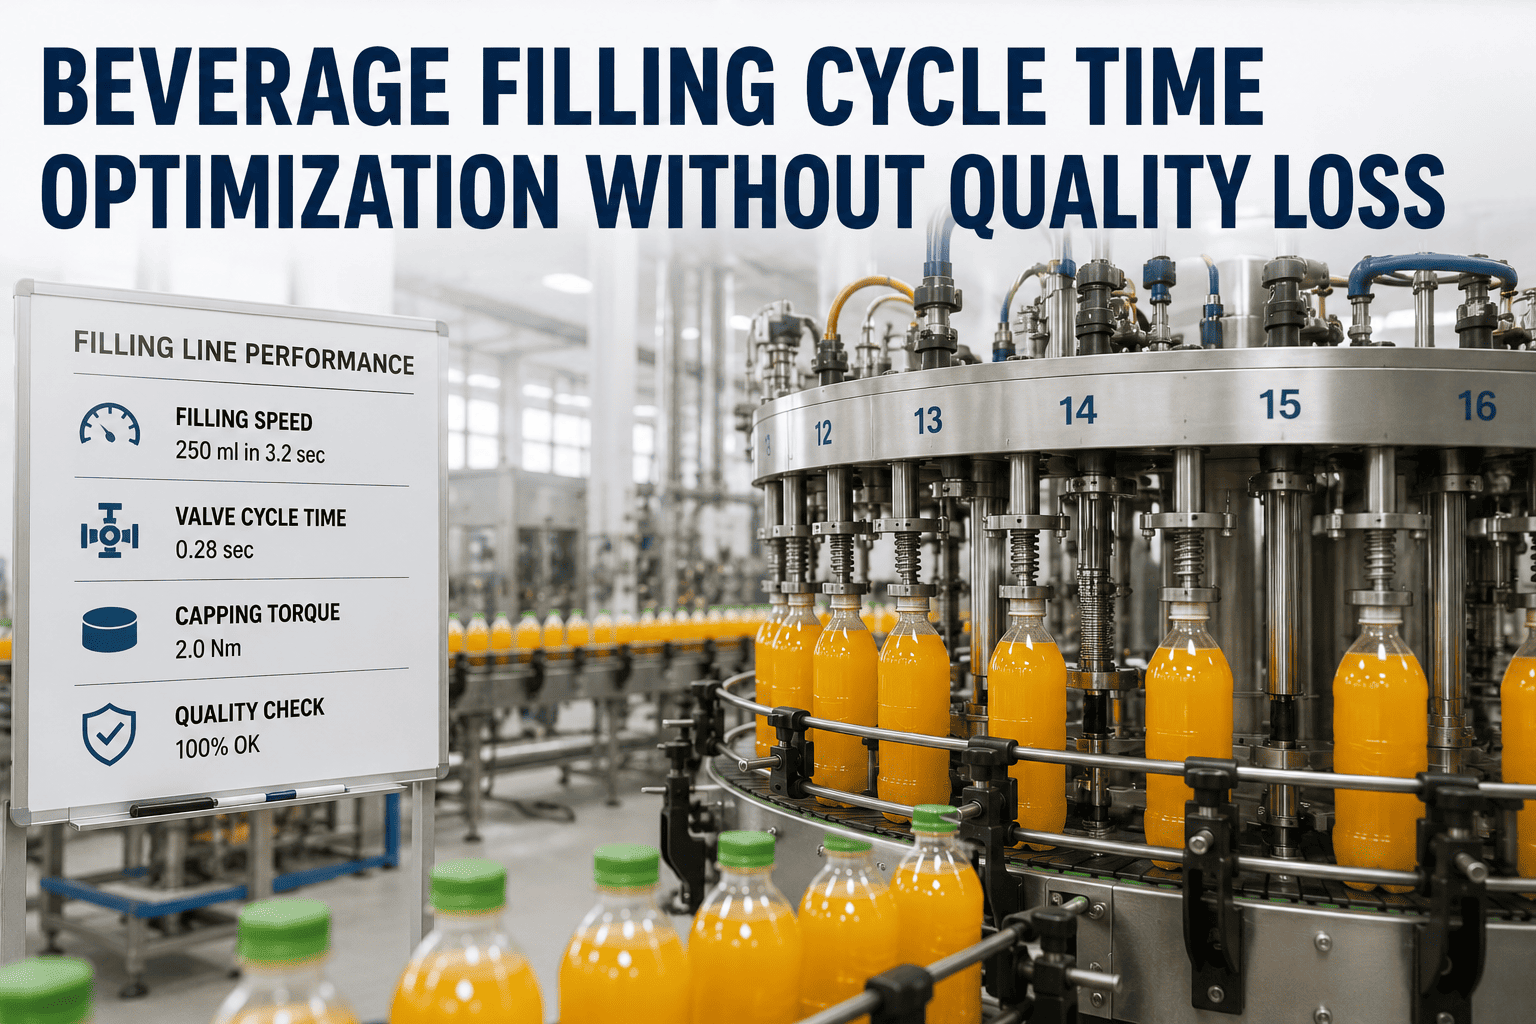
Beverage filler speed is almost never limited by the pump. It is limited by 12 seconds of cycle — 3 seconds of indexing, 6 seconds of fill, 3 seconds of exit — repeated across 40 heads on a rotary carousel until the machine is running 1,200 bottles a minute or, more likely, running 830. The math is unforgiving: shave one second off the cycle and you gain 8 percent throughput. Add one second and you lose it. And the seconds hide inside the machine — in valve wear that lengthens fill time by 0.3 seconds per position, in capper spring fatigue that pushes torque out of the ±8% band and triggers reject kicks, in bottle-to-bottle carry-over that adds an unplanned hold delay. On paper the filler is rated at 1,200 BPM. On the shop floor it makes 830. That gap is not a specification problem — it is a cycle-time problem, and it is measurable at the level of the individual valve, individual capping head, individual second of the cycle. The plants that push filler cycle without wrecking fill weight or torque don't push the pump harder. They surface where the seconds are actually going and give them back one at a time. iFactory filler cycle analytics is built to do exactly that — per valve, per head, per second, without new hardware in most cases.
iFactory Filler Cycle Analytics
Push BPM Without Wrecking Fill Weight or Cap Torque
Per-valve, per-head cycle intelligence: shave seconds off filling, detect torque drift head by head, and catch valve wear before it costs you a shift.
1,200
BPM on rated PET line
0.5-2%
fill drift blind spot
15 min
targeted valve swap vs 4 hr
Anatomy of a 12-Second Fill Cycle
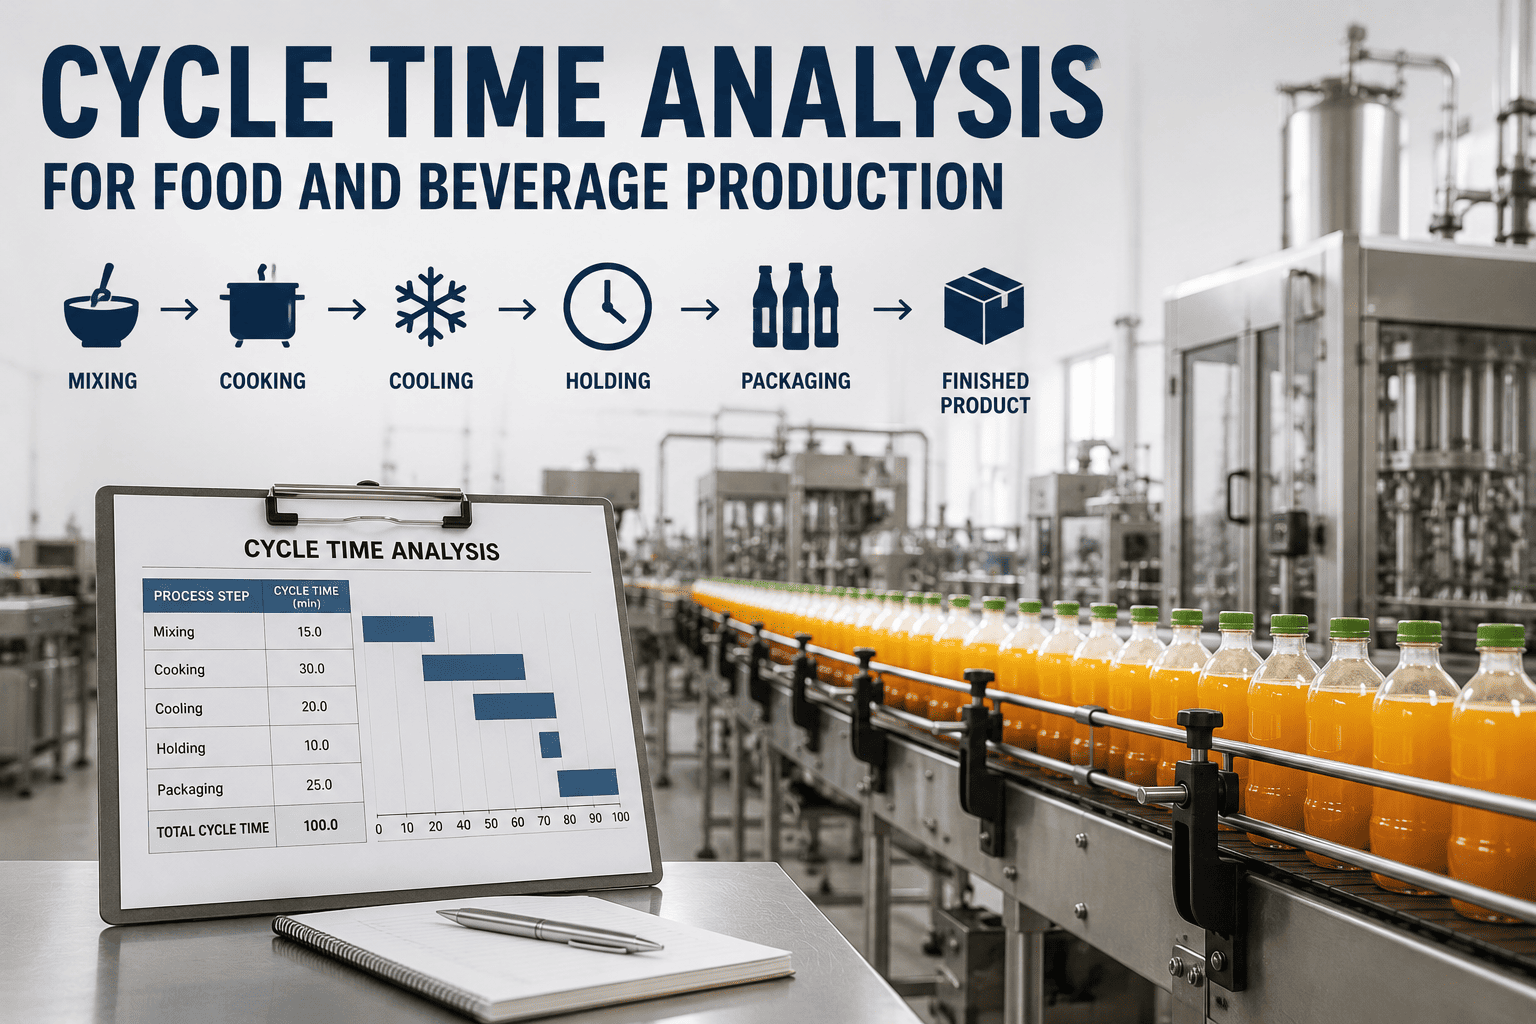
The cycle time on a filling machine is not just "how long does it take to fill a bottle" — it is a sequence of six discrete phases, each measured in seconds, each capable of gaining or losing time independently. This is what one fill cycle actually looks like on a typical rotary filler.
One cycle on a rotary filler — 12.0 seconds total
5 cycles/min × 40 heads = 1,200 BPM target
Non-value time (33% of cycle) — indexing and exit
Value time (50% of cycle) — actual filling
Buffer time (17% of cycle) — dive delay and hold
-1 sec
on cycle time
+9% BPM
+1 sec
valve wear delay
-8% BPM
Per head
independent timing
Targeted fix
Where the Cycle Actually Leaks
The theoretical cycle is 12 seconds. The observed cycle is almost always longer. These are the five places filler seconds hide — and every one of them can be measured at the level of the individual valve or head.
Valve wear
Seal degradation on a subset of valves extends fill time on those positions by 0.3-0.8 seconds. On a rotary, the whole carousel waits for the slowest valve — one worn seal drags the entire BPM number down.
Signal: fill time trending up per-valve, weight variance climbing on specific carousel positions
Capper torque drift
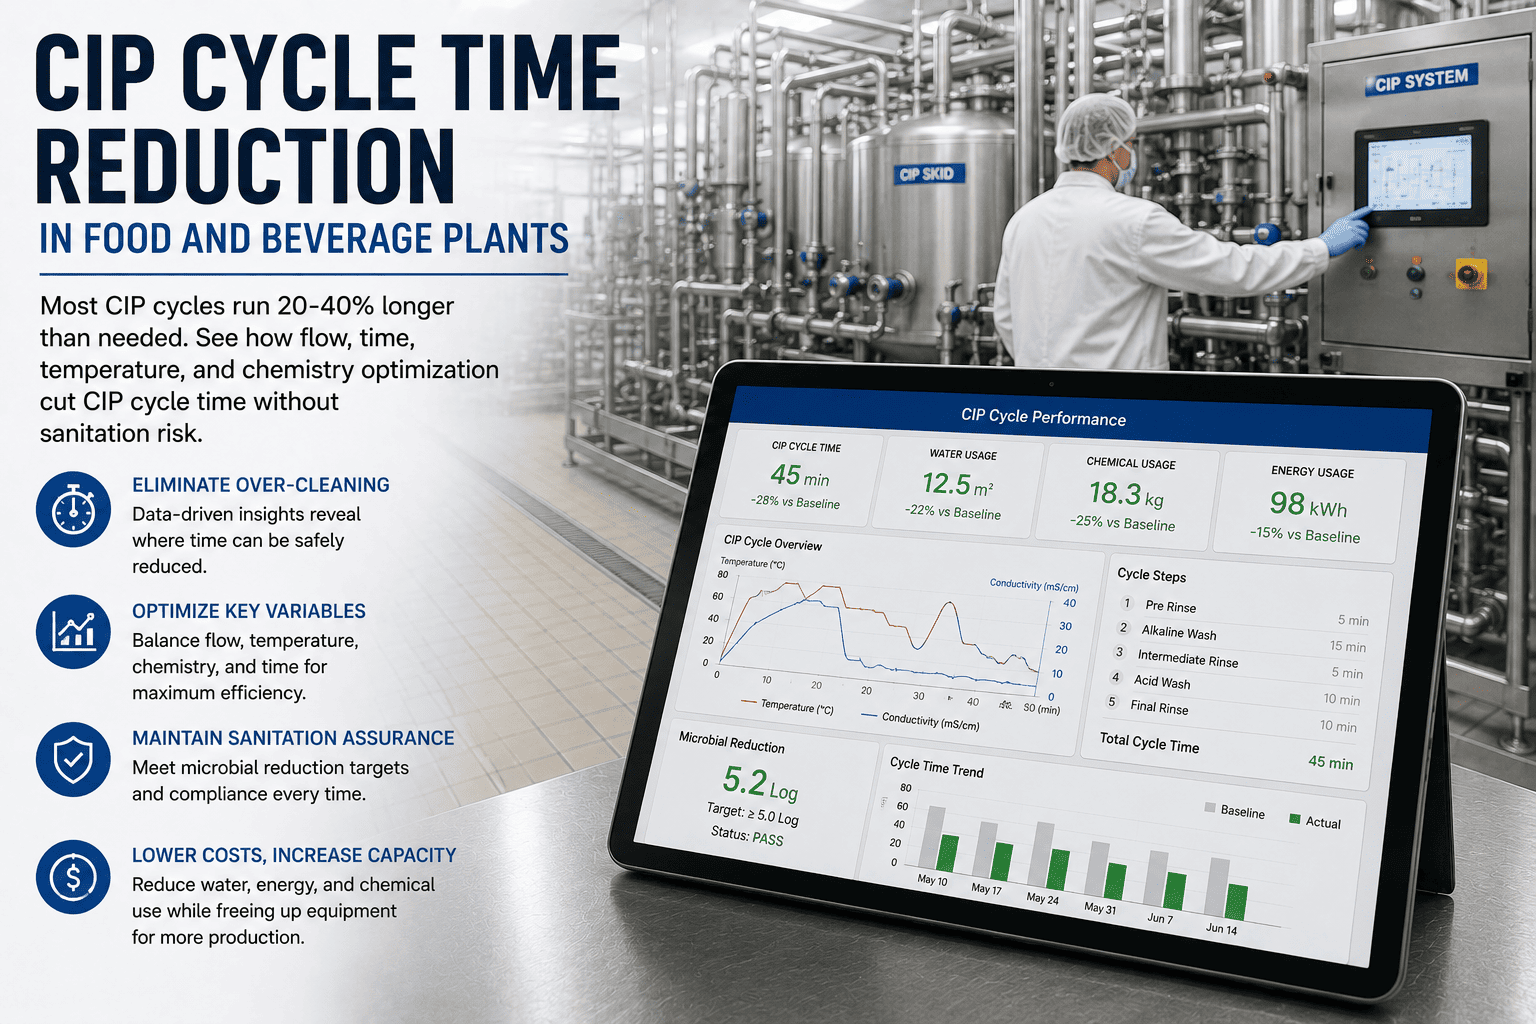
Capping-head spring fatigue pushes torque out of the ±8% band. Result: reject kicks that stop the line, or worse, leakers that reach the customer. Every torque-drift kick is 12-30 seconds of cycle lost.
Signal: torque trending upward per head, seal-integrity kicks clustered on specific positions
Indexing overrun
Entry and exit gates that don't clear cleanly. Bottle carry-over, mis-align, or missed sensor triggers add unplanned hold time to every cycle. On a 1,200 BPM line, 200 ms of indexing overrun costs 40 BPM.
Signal: indexing time creeping up in the cycle log, sensor false-positives climbing
Foam / CO₂ hold
Carbonated products need extra hold time to let CO₂ settle before capping. If carbonation levels drift or product temperature rises, the hold delay extends automatically — quietly capping BPM.
Signal: hold-phase duration correlating with CO₂ pressure or product temperature
Downstream starvation
Filler capable of 1,200 BPM but capper only cleared for 950. Labeler runs 900. The whole line runs at the slowest bottleneck, and the filler idles waiting — but the report says the filler is "running."
Signal: filler wait-state vs. downstream feedback, blocked-idle time by station
Want per-valve and per-head cycle data on your own filler? Book a demo and we'll pull one shift of cycle logs from your Krones, Sidel, KHS, or GEA PLC.
Cycle Time vs. Product Quality — The Real Trade-Off
Every cycle-time push runs into the same wall: at some point, faster means worse fills, sloppy torque, and rejects. The trick is knowing exactly where that wall sits per SKU — and pushing the cycle right up to it, not past it.
Blind BPM push
Speed First, Rejects Follow
Fill time cut across the board, ignoring valve variability
Torque holds set once, never trended head-by-head
Fill weight variance rises, reject rate follows
Line runs faster, but Quality drops the OEE gain
Compliance risk: under-fills, leakers, torque failures
iFactory calibrated push
BPM Up, Quality Held
Fill time trimmed per-valve to actual seal condition
Torque trended per head against ±8% band live
Weight variance stays inside spec, rejects flat
OEE = A × P × Q — all three protected together
Audit trail per bottle, per head, per shift
Per-Valve, Per-Head Intelligence — What Changes
The single biggest shift in filler analytics is treating each valve and each capping head as an individual asset with its own baseline, its own drift, and its own targeted maintenance need. Not the carousel as a whole — the valve at position 21.
01
Fill time per valve
Every valve trended against its own baseline. Valves drifting toward longer fill times get flagged individually — before they become the constraint on the whole carousel.
02
Fill weight per valve
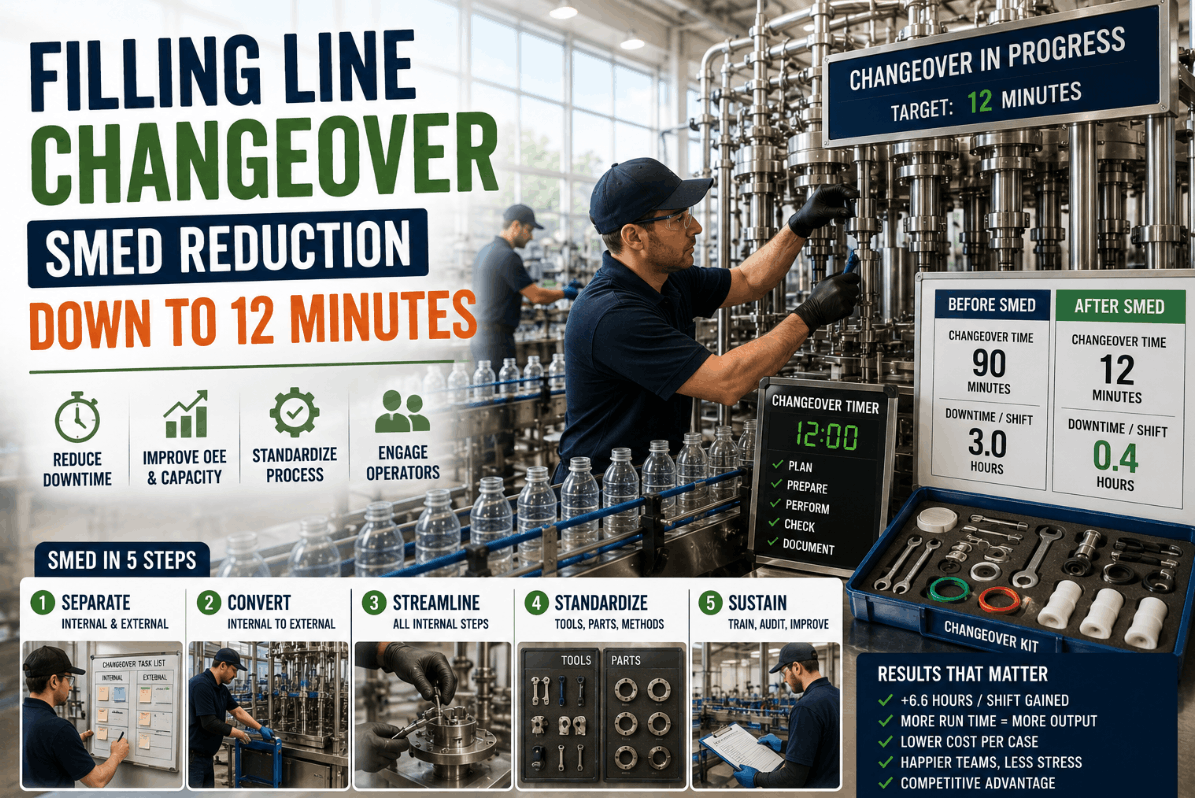
Weight drift on positions 18-22 stops being a fleet-wide problem. It becomes a targeted replacement of five specific seals — 15 minutes instead of a 4-hour carousel service.
03
Torque per head
Capping heads trended against ±8% (twist-off) or ±5% (sport cap) tolerance. Spring fatigue caught head-by-head weeks before the reject kick shows up.
04
Reject rate per station
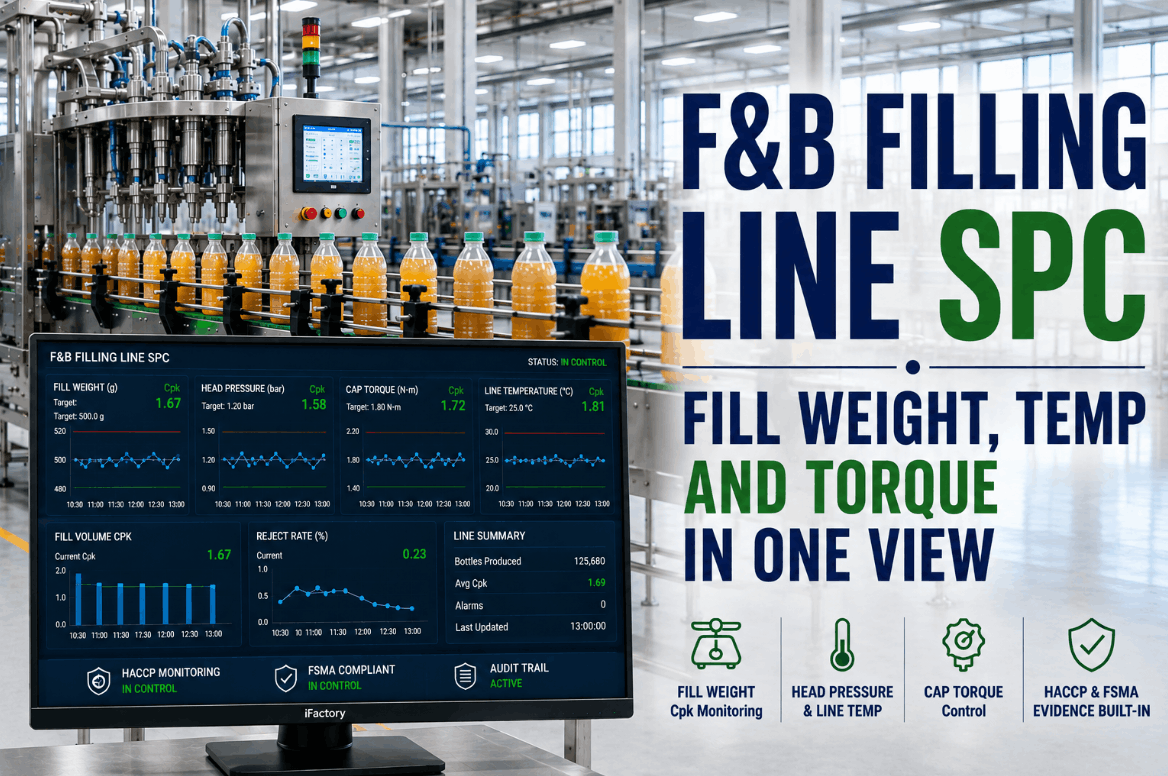
Rejects attributed to the valve, head, or sensor that generated them — not to "the filler" as a black box. The pattern points at the fix.
05
Cycle phase timing
Indexing, dive, fill, hold, exit — logged individually so you can see which phase is stretching, not just that the total cycle went up.
06
Downstream sync
Filler wait states correlated with capper and labeler status — so you know when the filler is idle because of downstream starvation vs. its own issue.
How iFactory Closes the Filler Cycle Loop
Cycle-time insight only pays back when it drives targeted maintenance and calibrated speed pushes. iFactory routes every finding into a specific action — not a report.
01
Read PLC Streams
Fill time, valve position, torque, and reject data from Krones, Sidel, KHS, GEA PLCs via Modbus TCP or Ethernet/IP.
02
Baseline Every Valve & Head
Individual baseline for each of 40 valves and each of 20 capping heads — per SKU, per operating condition.
03
Detect Drift Live
Fill time creep, torque drift, weight variance — flagged per position before the aggregate metric moves.
04
Route Targeted Action
Valve seal replacement on position 21. Spring change on head 8. Not a 4-hour carousel service — a 15-minute targeted fix.
05
Verify Cycle Recovery
Post-action cycle log confirms the position returned to baseline — action closes with the seconds and BPM recovered logged.
What Calibrated Cycle Optimization Delivers
Pushing filler cycle without wrecking quality is where real OEE gains hide on beverage lines. These are the outcomes plants typically see after moving from carousel-level averages to per-valve, per-head cycle intelligence.
+8-10%
BPM recovered
without new machine or capital
15 min
Targeted swap
vs 4-hr full carousel service
Flat
Reject rate
as speed rises, quality held
Weeks
Torque warning
before spring fatigue reaches reject
Curious what a +8% BPM gain would be worth on your SKU mix? Talk to our beverage team — we'll size it against your line rate and shift schedule.
Frequently Asked Questions
How much BPM can we actually gain without buying a new filler?
Realistically, 8-10% is achievable on most mid-life rotary fillers just by trimming cycle where the seconds are actually hiding — indexing overrun, per-valve fill time drift, capper torque waste. Some plants find more when downstream starvation turns out to be the real cap and the filler was never the constraint. The gain comes from surfacing per-position data, not from pushing the pump harder.
Won't pushing cycle time cause fill weight and torque problems?
It will — if you push blindly. The reason per-valve and per-head analytics matter is that you're only trimming cycle where each individual valve and head can safely take it. Valves in good condition give up 0.3 seconds; worn valves keep their current fill time until they're replaced. Torque is trended head-by-head against the ±8% band, so a head that's drifting doesn't get pushed past its safe zone. The whole point is protecting Quality while raising Performance.
Do we need new sensors on the filler?
In most cases, no. Modern Krones, Sidel, KHS, and GEA fillers already expose valve-level fill time, capper torque, and reject data via Modbus TCP or Ethernet/IP. iFactory reads what's already there. Only in specific washdown environments or on older machines might supplemental sensors be needed — and those are NEMA 4X rated with typical 2+ year service life in beverage conditions.
How does per-valve maintenance actually save time vs. our current PM?
Because you replace five worn seals in 15 minutes instead of servicing all 40 valves in a 4-hour carousel PM. Under conventional maintenance, fill weight variance develops across individual positions over weeks; by the time aggregate weight hits the reject threshold, several valves are already producing off-spec fills. Per-valve monitoring detects drift on each valve independently and points maintenance at the specific positions that need attention.
Can we see this running on our line before committing?
Yes. Bring one filler, one shift of PLC cycle logs, and torque history. We'll baseline every valve and every head individually, apply the drift rules, and show exactly which positions are dragging BPM, which heads are trending out of torque tolerance, and what a 15-minute targeted service would recover. Book a demo and we'll walk it live.
Stop losing BPM one valve at a time.
See Per-Valve, Per-Head Cycle on Your Own Filler
Bring one filler and one shift of PLC cycle logs. We'll baseline every valve and head, apply drift rules per position, and show exactly which valves are dragging fill time, which heads are trending torque, and how much BPM a 15-minute targeted service would give back.
Per-valve
fill time trending
Per-head
torque monitoring