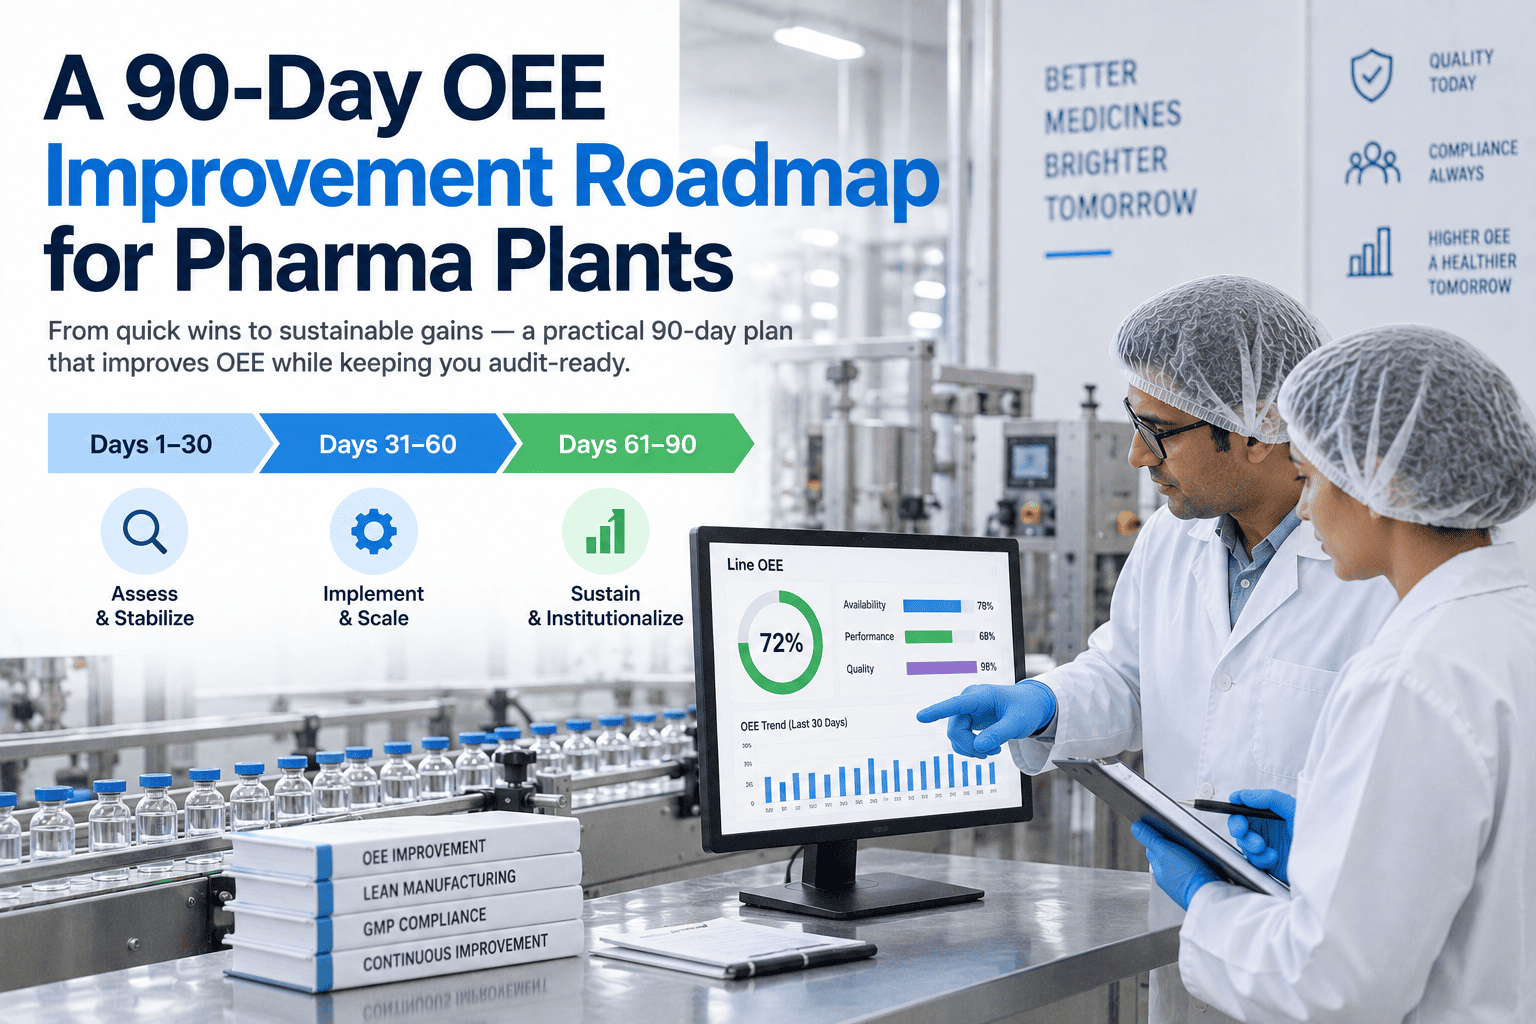
Most pharma OEE programs don't fail from lack of effort — they fail from lack of sequence. A plant launches on all fronts at once: a changeover project, a micro-stop project, operator training, a maintenance push, vision-system tuning, all in the same month. None gets sustained attention long enough to land, the numbers barely move, and around day 60 leadership looks at the root KPI, sees no change, and quietly concludes the program isn't working. It usually was — the evidence was just in the leading indicators nobody was watching. This roadmap fixes the order, running in three 30-day phases — measure, quick-win, sustain — that deliver a real OEE gain in 90 days while staying audit-ready throughout. You can book a demo to see it on one of your lines.
Most Pharma OEE Programs Stall at Day 60. This One Is Sequenced So It Doesn't.
A proven three-phase, 90-day roadmap — measure and ground the Pareto, land high-leverage quick wins, then make the change stick — that delivers measurable OEE gains without ever touching your validated state.
The Program Was Working. Leadership Just Measured the Wrong Thing.
The classic failure isn't dramatic — it's a quiet loss of confidence around the two-month mark. The root KPI, the number the steering committee actually cares about, hasn't moved much yet, because real OEE change compounds over quarters, not weeks. So the review concludes the effort isn't paying off, attention drifts, and the initiative dies just before it would have delivered. Understanding the three specific ways this happens is how you build a roadmap that survives day 60.
If governance judges the program on the top-line number in the first 60 days, it sees little movement. The real evidence is in the leading indicators — OEE at the constraint rising, open improvement actions declining — and those must be the scoreboard early on.
Simultaneous initiatives on changeover, micro-stops, training, maintenance, and vision tuning split attention so thin that none is sustained long enough to work. The failure is the parallelism itself, not any one project.
If logging a stop takes more than a few seconds, operators under pressure find shortcuts, and inconsistent reason codes mean each shift's data means something different. The numbers keep coming, but they stop being comparable.
A program that leaves the plant dependent on outside support hasn't delivered sustainable improvement. Without training that transfers the capability to the team, the gains last exactly as long as the external push does.
Measure First, and Resist the Urge to Fix Anything Yet
The single biggest pitfall in the whole roadmap is skipping this phase. Plants that launch improvement in week one, working off the OEE number they already report, almost always attack the wrong Pareto — because the reported number and the real one are rarely the same. The first 30 days exist to produce an honest, measured baseline and a true loss Pareto, and nothing else.
Pick one line — ideally one with both compliance-relevant operations and known performance gaps — and set up direct-sensor OEE capture, with operators ready to log stop reasons on a tablet. Registration has to be a few seconds or it won't hold.
Operate the line as usual while the system records every stop, micro-stop, and speed loss against consistent reason codes. No interventions yet — the point is to see the line as it actually runs, not as anyone remembers it running.
Generate the first measured OEE number and the first genuine loss Pareto. The gap from what the plant assumed is usually large — the top stop categories often differ in rank and size from the accepted narrative. That gap is the whole point.
Expect this phase to be uncomfortable for leadership. The real number comes in below expectation, the Pareto challenges long-held beliefs about which stops matter, and operators confirm patterns that were invisible on paper. That discomfort is exactly what enables the improvement that follows — a plant that never confronts the real Pareto keeps optimizing against the wrong problem forever. Teams that push through with honesty instead of defensiveness are the ones that succeed.
Get an Honest Baseline in the First 30 Days
iFactory captures direct-sensor OEE on your pilot line and produces the real loss Pareto in the first month — so improvement effort targets the actual biggest loss, not the one everyone assumed.
Attack the Top of the Real Pareto — Where the Fastest Capacity Lives
With a true Pareto in hand, phase two goes after the one or two losses at the top of it, not all of them. In pharma packaging, that top loss is almost always changeover and cleaning, because so much of the day is spent there — which is exactly why it's the largest, fastest capacity gain available, and why it converts directly to available time without touching the validated process itself.
Split internal from external steps, pre-stage format parts, and parallelize the documentation. On a regulated line, a shorter changeover converts straight into capacity — one documented case cut changeover 40 percent and lifted packaging OEE 18 points in four weeks.
Put a live micro-stop Pareto in front of operators and work the single biggest recurring sub-minute stop. These are invisible on paper and often the second-largest recoverable loss on a packaging line.
Break out line clearance, cleaning, and changeover as distinct losses per the ISO 22400 approach, so the SMED effort has a precise target instead of one blurred "downtime" bucket.
Report OEE at the constraint and the count of closed improvement actions to governance every week. These move well before the root KPI does, and they're what keeps leadership confident through the day-60 wall.
Make the Gain Permanent Before You Scale It
Phase three is where most roadmaps quietly skip a step and pay for it later. The temptation at day 60, with quick wins on the board, is to roll out to every line at once. That scales problems, not solutions. The last 30 days are about locking the gain into daily practice on the pilot line so that when you do scale, you're scaling something that already holds.
The measured OEE and its loss Pareto become the agenda of the daily production meeting, not a monthly report. The shift that owns a loss sees it every morning and is accountable for the action against it.
The faster changeover and the micro-stop fixes get written into standard work, so the gain doesn't depend on which operator or which shift is running — it becomes how the line is run, period.
Train the team to run the measurement, the Pareto, and the improvement cycle themselves. This is the step that converts a time-limited project into a permanent capability instead of one that fades when outside support leaves.
Use the pilot's actual, validated gains — not a vendor estimate — to justify rolling out to the next lines. A business case built on your own numbers is the one that gets approved and repeats.
Across hundreds of lines, plants with the early fundamentals in place typically move OEE from around 45 percent to over 53 percent within 90 days — roughly 34 fewer minutes of downtime per day, about 9 percent faster production, and 8 percent shorter cycle time. In pharma packaging specifically, closing half the gap to top quartile in 90 days is achievable, and most of it in six to nine months, when the intervention is sequenced rather than launched all at once. The gain isn't from working harder; it's from working the real Pareto in the right order.
None of This Touches Your Validated State
An OEE program in pharma has to improve performance without creating a compliance problem, and the two goals are often treated as if they compete. They don't have to. The roadmap is built so the same data that surfaces your losses also carries the audit trail an inspector expects — improvement and compliance running on one system, not two.
Reducing changeover time by resequencing and pre-staging shortens the non-value time around the validated process — it doesn't change the validated steps themselves, so there's nothing to revalidate.
The OEE data carries the tamper-evident electronic records, audit trail, and role-based access that GxP requires, so the performance record is inspection-grade from day one.
Losses are captured with the attributable, contemporaneous, accurate lineage that data-integrity expectations demand — the same properties that make the number trustworthy for improvement make it defensible in an audit.
The measurement that shows a changeover ran long is the same record that proves the line ran in its validated state — so improving OEE and staying compliant stop being competing priorities.
The Platform Built for the Sequence, Not Just the Dashboard
iFactory is designed to run exactly this sequence — measure honestly, target the real Pareto, and sustain the gain — with the GMP data integrity pharma requires carried through every phase. It's the difference between a dashboard that shows numbers and a system that drives the 90-day change.
What Operations Teams Ask About the 90-Day Roadmap
Run the Roadmap That Doesn't Stall at Day 60
iFactory measures your pilot line honestly, ranks the real losses, tracks the leading indicators that keep the program alive, and carries GMP integrity throughout — so 90 days produces a measurable, audit-ready OEE gain you can scale.