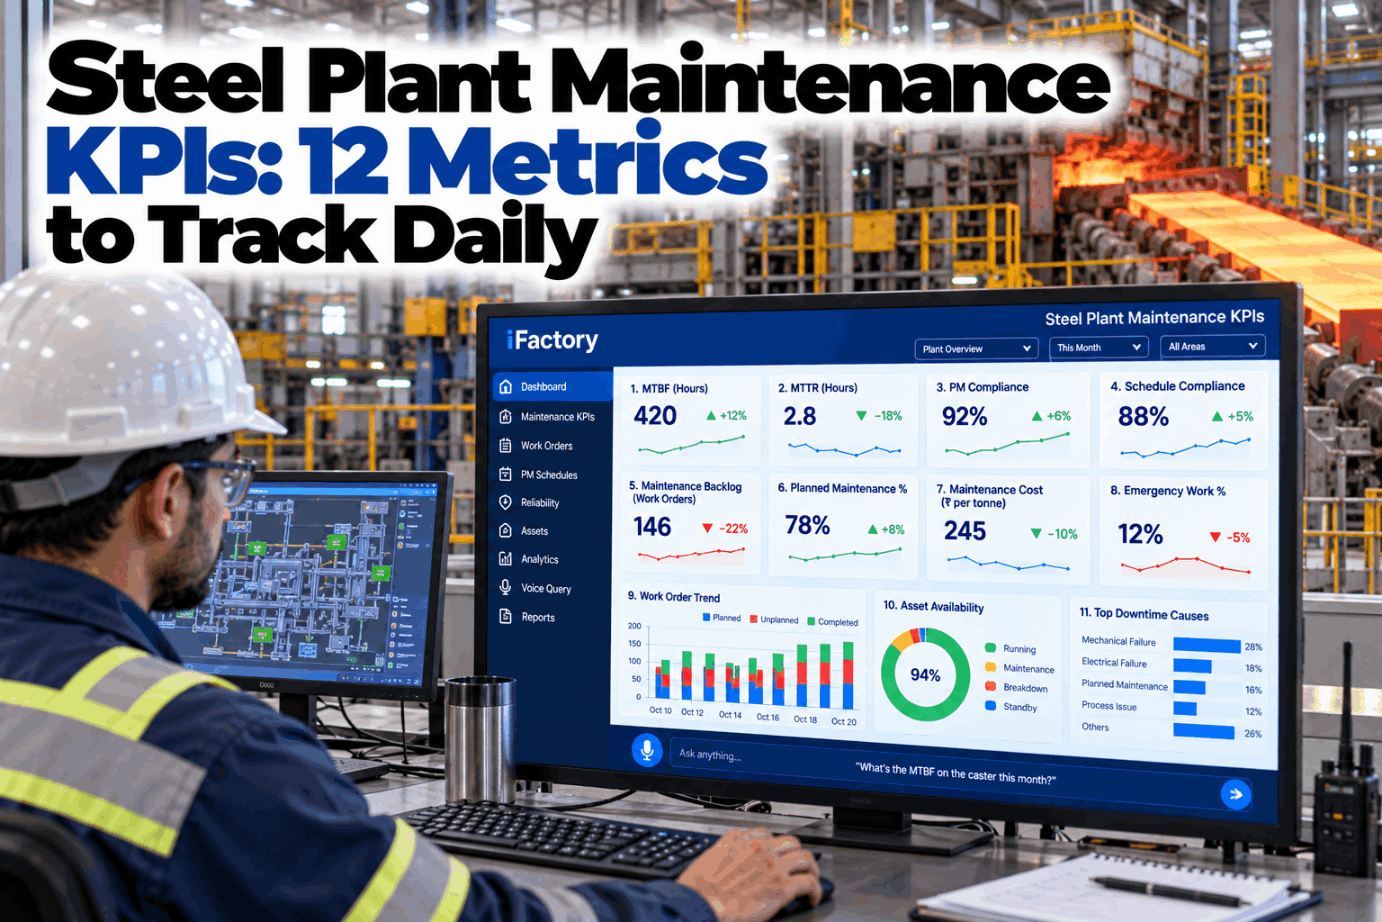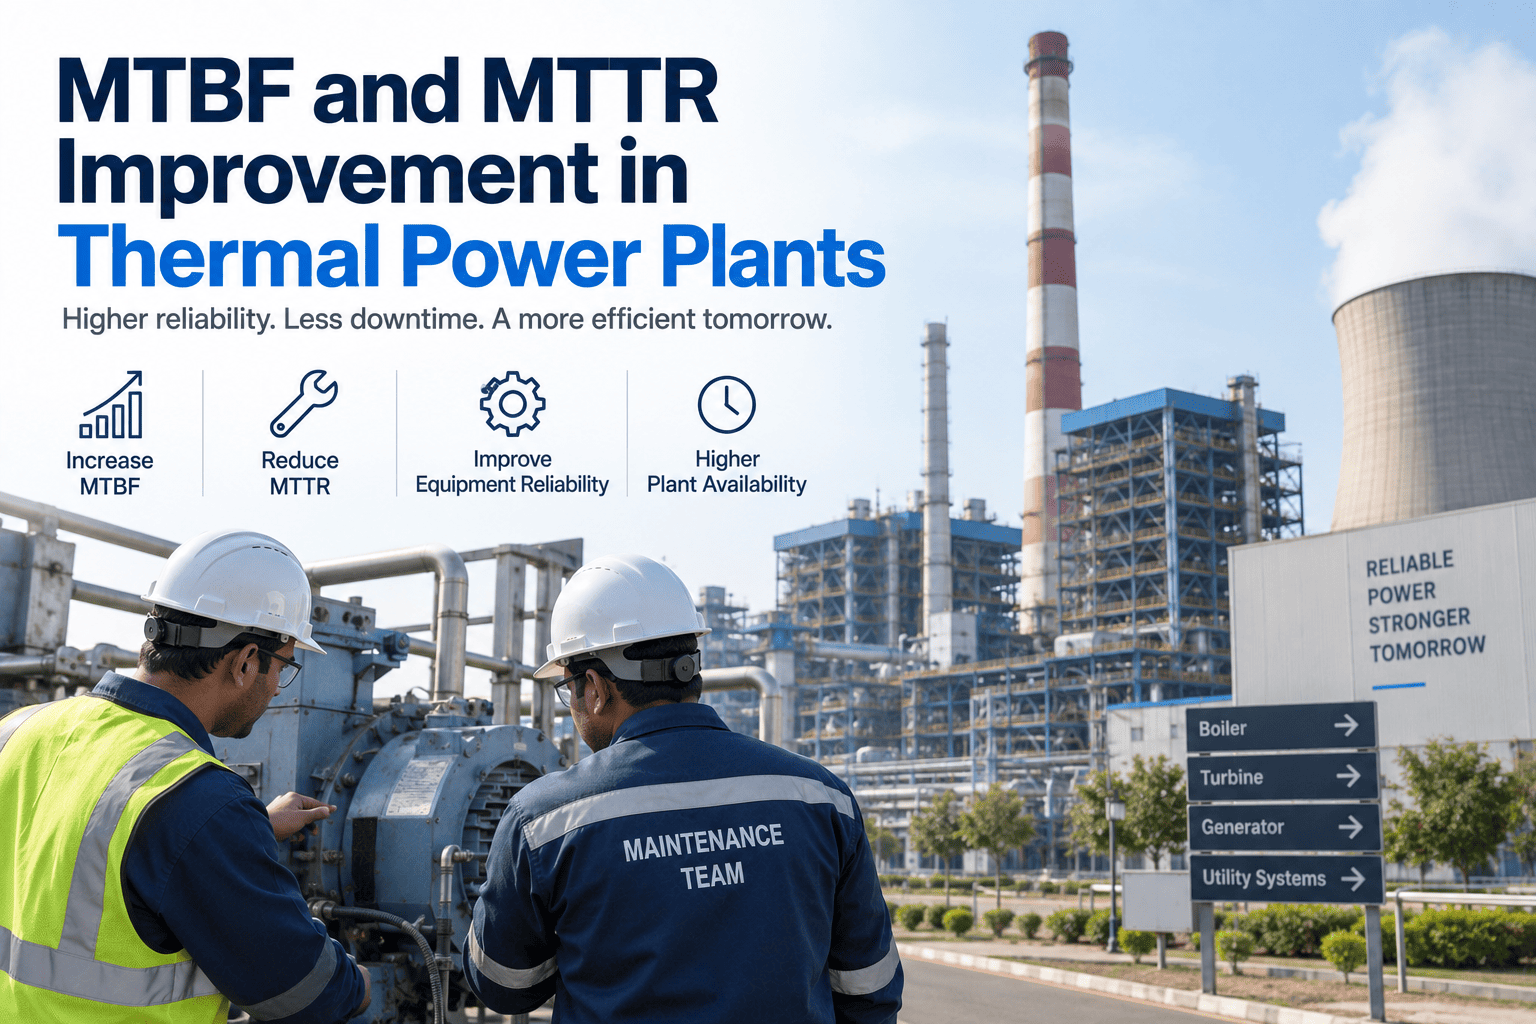
When a plant's MTBF sits below target, everyone on the maintenance team already knows it — not from a report, but from the way the days feel. The radio never stops, the schedule is a suggestion, and the crew spends its shift chasing the failure in front of it instead of preventing the next one. That's firefighting mode, and MTBF is the number that measures it: how long, on average, a turbine or boiler runs before the next unplanned failure. Its twin, MTTR, measures how fast you recover when a failure does hit. The mistake most reliability programs make is chasing one and ignoring the other — the two only pay off when you lift them in parallel. This guide lays out the proven steps to do both across your critical assets. You can book a demo to see both tracked live per asset.
MTBF Is How You Stop Firefighting. MTTR Is How Fast You Recover When You Can't.
Lift the interval between failures and slash the time to repair them in parallel — the two reliability levers that, pulled together, move plant availability and pull your crew out of reaction mode.
One Tells You How Reliably You Run, the Other How Fast You Recover
These two metrics describe a repairable asset's health from opposite ends. MTBF is the average operating time between unplanned failures — how reliable the asset is. MTTR is the average time to restore it once it fails — how maintainable it is. Neither alone tells the whole story, which is exactly why chasing one in isolation is a trap: the number that ownership and the grid actually care about, availability, is built from both together.
Operating hours divided by the number of unplanned failures over that period. Higher is better. A declining MTBF trend is the earliest warning that wear is accelerating — often visible before the failure itself. Applies only to repairable assets and counts only unplanned failures, not planned maintenance.
Total repair time divided by the number of repairs. Lower is better. It captures everything from the moment of failure to restored operation — diagnosis, crew mobilization, parts, the wrench time, and testing. Best-in-class steam-turbine MTTR runs under three hours; many plants sit far above that without knowing why.
Consider two identical assets. Asset A fails rarely — a high MTBF — but each repair drags on for a day because parts aren't stocked and diagnosis is slow. Asset B fails more often, but its repairs take a few hours because the crew is prepared. Run the availability math and Asset B, despite failing more, is more available and produces more. That's the whole argument for pulling both levers: a great MTBF undone by a slow MTTR still leaves the unit down, and a fast MTTR can't rescue an asset that keeps failing. Availability lives in the product of the two.
The Plant Average Hides the Asset That's Actually Killing You
Before improving anything, get the measurement right — and the single biggest measurement mistake is reporting MTBF and MTTR as plant-wide averages. An average smooths over exactly the outlier you need to find. A plant running a healthy 650-hour MTBF overall can have a pump class quietly failing every 180 hours, invisible in the aggregate, dragging reliability and consuming crew time while the headline number looks fine.
Calculate MTBF and MTTR per asset class — turbines, boilers, feed pumps, fans, generators — not as one plant figure. The worst performer is where the highest-return improvement lives, and it only shows up when you stop averaging.
A component that fails often but restarts quickly may matter less than one that fails rarely but takes the whole unit down for days. Weight the ranking by lost generation, not just failure count.
A single MTBF number is a historical average. The value is in the direction — a declining trend on a specific asset is systemic maintenance debt accumulating, and it's your earliest actionable warning.
The honest numbers come from failure and repair timestamps in the CMMS, not spreadsheet estimates. Manual tallying lags and rounds; automated calculation from real timestamps is what makes the metric trustworthy enough to act on.
See MTBF and MTTR by Asset Class, Not a Plant Average
iFactory calculates both metrics per asset from your work-order timestamps and trends them live — so the pump class failing every 180 hours surfaces instead of hiding in the plant number.
Raising MTBF Means Preventing the Failure, Not Surviving It
Every hour you shift from emergency repair to planned, proactive work directly extends the average interval between failures. The single strongest predictor of a high MTBF is the planned maintenance percentage — plants running above 85 percent planned work consistently see MTBF 40 to 60 percent higher than reactive programs. These are the levers that get you there.
When 85 percent of maintenance hours are scheduled and proactive rather than reactive, failures get prevented instead of chased. This one shift is the largest single driver of MTBF, because every emergency you convert to planned work removes a failure from the interval.
Calendar-based PMs miss early-stage failures that don't follow a schedule. Condition monitoring — vibration, thermal, oil analysis — catches degradation before it cascades, acting as an early-warning system that turns a would-be failure into a planned intervention. Facilities making this shift report MTBF gains of 20 to 35 percent on rotating assets in the first year.
Root cause analysis is the highest-leverage MTBF intervention there is, because it stops the same failure from repeating. A failure that recurs three times is three hits to your MTBF; fix the root cause once and the interval extends permanently. Every major failure earns a real investigation, not just a repair.
Two quieter drivers: OEM-quality spares, because cheaper look-alike parts often fail at half the MTBF, and operator training, because a large share of "equipment failures" trace back to operating practice rather than engineering. Both extend the interval without a single new sensor.
Most of Your Repair Time Is Spent Before Anyone Turns a Wrench
Here's the counterintuitive truth about MTTR: the wrench time is rarely the problem. The search-and-gather phase — finding the fault, mobilizing the crew, locating parts and tools — accounts for a huge share of total repair time, by some measures 35 to 45 percent. Compress that pre-repair gap and MTTR drops without the actual repair getting any faster. These are the levers.
The clock starts at failure, not at the first turn of a wrench. Mobile work orders that put the alert, the asset history, and the procedure in the technician's hand shrink the gap between detection and repair start — a realistic target is under 30 minutes from alert to hands-on.
A crew arriving without the right tooling is a 90-minute penalty before any work begins. Work orders that specify the correct parts, torque specs, and safety procedures up front — ideally generated from the condition alert itself — eliminate the search-and-gather phase that eats nearly half of average MTTR.
If MTBF analysis shows a bearing class fails around every 2,000 hours, that spare should be on the shelf before the next failure, not ordered after it. Using failure-interval data to drive the critical-spares list is what turns a multi-day parts wait into a same-shift swap.
Every repair that ran long gets a short failure-mode review. Patterns emerge fast — the recurring diagnostic dead-end, the part that's never in stock, the access that always takes two crews — and each one becomes a permanent MTTR fix rather than a lesson relearned next time.
In a Thermal Plant, Every Hour of Downtime Is Measured in Six Figures
The reason MTBF and MTTR matter more in power generation than almost anywhere else is the cost of the hour they govern. Downtime on a thermal unit runs from tens of thousands to hundreds of thousands of dollars an hour once lost generation and contract penalties are counted — so small movements in either metric compound into large annual numbers.
The Firefighting Plant and the Reliable Plant, on Every KPI
The difference between a reactive and a proactive program isn't philosophy — it's measurable on every number that matters. This is what changes when the two levers get pulled together instead of the crew running from failure to failure.
- Under 85% planned work — most hours are emergencies
- Calendar PMs that miss early degradation
- Same failures recur because root cause is never found
- Crews arrive and then go hunting for parts and tools
- MTBF and MTTR tracked as stale plant-wide averages
- Every event is a scramble measured in six figures
- 85%+ planned work — failures prevented, not chased
- Condition-based PM catching degradation early
- RCA makes each fix permanent, extending the interval
- Pre-staged parts and procedures compress every repair
- Per-asset MTBF and MTTR trended live from timestamps
- Fewer events, each recovered fast and predictably
One System That Lifts MTBF and Cuts MTTR at Once
iFactory works both levers from the same data: it predicts failures early to extend MTBF, and it arms the crew to compress MTTR — with per-asset metrics calculated automatically from your work-order timestamps so you always know which asset to work next.
What Reliability Teams Ask About MTBF and MTTR
Pull Both Levers and Get Your Crew Out of Firefighting Mode
iFactory predicts failures to lift MTBF, arms the crew to slash MTTR, and calculates both per asset from real work-order timestamps — so availability climbs and the radio finally goes quiet.