At 2:14 AM on a Tuesday, the lead operator at a 600 MW combined-cycle plant in the Southeast watches the heat rate tick up — 7,250, then 7,270, then 7,310 Btu/kWh. The compressor discharge pressure has drifted 3 psi from the baseline. The OEE dashboard shows 87% availability, but the plant manager knows the real number is closer to 79% when you factor in the derates and the gradual efficiency bleed that no one logged. The monthly OEE report arrives two weeks late, buried in a SharePoint folder. By then, the pattern is gone. The next performance review kicks the can to Q3. This is the status quo that the next 12 months are designed to break — one measurement, one shift, one turbine at a time.
A 12-Month OEE Roadmap That Doesn't Fade After the Pilot
Most power plant OEE programs deliver a burst of improvement in months 1–6, then plateau. This roadmap — built for plant engineers and operations executives — sustains availability gains and heat rate reductions through month 12 and beyond.
What a Typical OEE Program Looks Like — And What iFactory Changes
The difference between a stalled initiative and a sustained operational excellence program isn't the team's effort. It's the architecture: how data flows, how decisions get made, and who owns the outcome at each phase.
Without iFactory
- OEE data pulled from DCS historian once a week — 7-day lag on every metric
- Availability losses buried in shift logs and emailed spreadsheets
- Performance improvement ideas debated in monthly review meetings
- Heat rate drift detected 3–5 days after it starts
- OEE program momentum fades after month 6 — no sustained discipline
With iFactory
- Real-time OEE dashboard updated every 10 seconds from plant-floor data sources
- Availability losses auto-classified and assigned to the right shift team
- Improvement actions triggered within the same shift — not next month
- Heat rate deviation alerts pushed to operator HMI within 60 seconds
- OEE program tracks a full 12-month roadmap with quarterly ROI gates
What a Stalled OEE Program Costs in Real Terms
Every month that a power plant operates without a disciplined OEE framework, the losses compound. Here's what the data shows for a typical 500–800 MW plant running at 85% capacity factor.
Unplanned derates from unclassified losses
When the DCS alarm floods but no root cause is tagged, operators derate 15–30 MW to stay safe. That's lost capacity you can never recover.
Heat rate creep from delayed detection
A 1% heat rate increase on a 600 MW combined-cycle plant burning gas at $3/MMBtu adds measurable fuel cost every hour it goes uncorrected.
Extended planned outages from poor availability tracking
Without real-time availability data, maintenance windows are based on calendar assumptions instead of actual component wear. Every extra day of outage costs.
Lost labor productivity in monthly OEE reporting
One engineer spends 3–4 days per month pulling data, reconciling spreadsheets, and producing the OEE report that arrives too late to act on.
Regulatory compliance penalties from poor documentation
When NERC or ISO auditors ask for OEE data to prove availability commitments, a fragmented data trail can trigger fines and increased scrutiny.
How iFactory Delivers a 12-Month OEE Trajectory
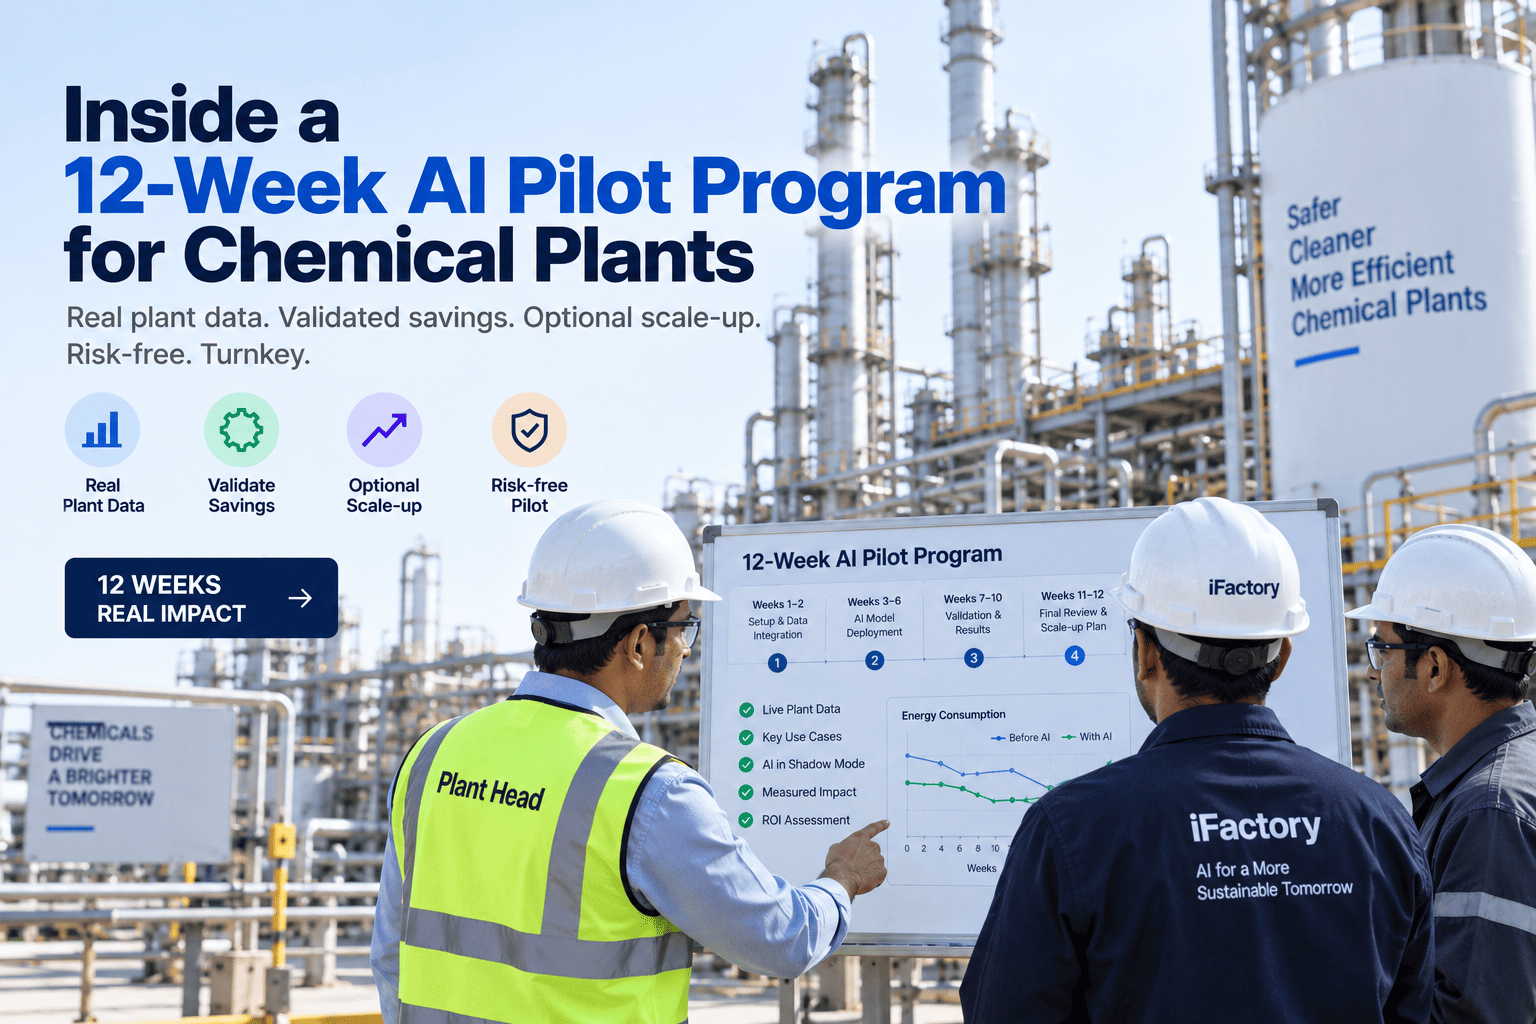
The iFactory platform absorbs the operational role of legacy plant systems and delivers a turnkey OEE program in four concrete phases. Each phase has a measurable output and a decision gate.
Baseline & Connect (Weeks 1–6)
iFactory connects to your DCS, CMMS, and emissions monitoring systems via an on-premise NVIDIA appliance — no cloud, no data egress. Within two weeks, you see your first real-time OEE dashboard with availability, performance, and quality metrics.
Pilot & Calibrate (Weeks 7–12)
We run a focused pilot on one unit or one turbine train. The platform learns normal operating patterns and begins auto-classifying availability losses into planned, unplanned, and external categories. You get your first heat rate deviation alerts in under 60 seconds.
Scale & Standardize (Months 4–8)
With the pilot validated, iFactory scales to all units and balance-of-plant systems. Shift teams receive daily OEE reports with actionable improvement targets. The platform absorbs the data aggregation and reporting workload from legacy systems.
Sustain & Optimize (Months 9–12)
OEE becomes a daily operational discipline. iFactory's predictive models identify emerging availability risks 72 hours before they cause a derate. The platform generates quarterly ROI reports that prove the program's value to the executive team.
What You Get to Make the Roadmap Work
These are the specific platform capabilities that turn a 12-month plan into a measurable result — not features on a spec sheet, but operational tools your team will use every shift.
Real-Time OEE Dashboard
Availability, performance, and quality metrics updated every 10 seconds. No lag, no spreadsheets. Every operator sees the same numbers at the same time.
Loss Classification Engine
Auto-classifies every availability loss into planned, unplanned, or external categories. Eliminates the guesswork from monthly OEE reporting.
Heat Rate Deviation Alerts
Detects heat rate drift within 60 seconds and pushes an alert to the operator HMI. Cuts detection time from days to seconds.
Predictive Availability Risk
Machine learning models trained on your plant's historical data predict availability risks 72 hours in advance. Enables proactive maintenance instead of reactive firefighting.
Most OEE programs plateau at month 6 because the data infrastructure can't keep up. iFactory's on-premise architecture sustains momentum through month 12 and beyond. Book a 30-min walkthrough and we'll show you live on your plant's data.
What's Included in Every iFactory OEE Deployment
We don't hand you a software license and walk away. Every deployment includes these commitments — from the first connection to the 12-month ROI review.
End-to-End Turnkey Deployment
You hand over data-source access. iFactory delivers a working pilot in 6–12 weeks. No integration consulting fees, no multi-vendor coordination.
On-Premise NVIDIA Appliance
Zero cloud dependency. No data egress. The appliance lives on your plant network and connects directly to your DCS, CMMS, and historians.
Pilot-to-ROI in One Quarter
Measurable improvement in availability or heat rate within the first 90 days. If it doesn't work, we help you understand why — and fix it.
24x7 Managed Service
Your plant runs 24/7. So does our support team. If the platform goes down, we're on it before your shift team even notices.
Quarterly ROI Reviews
Every 90 days, we produce a documented ROI report tied to your plant's actual availability and heat rate data. No hypotheticals — just real numbers.
Legacy System Absorption
If you're migrating off SAP MII, ME, or PCo, iFactory absorbs those workloads natively. One platform replaces three.
Frequently Asked Questions About the 12-Month OEE Roadmap
These are the questions we hear most from plant operations leaders evaluating a structured OEE improvement program.
Your 12-Month OEE Roadmap Starts Here
Book a 30-minute walkthrough. We'll connect to your plant's data live, show you the first dashboard in under two weeks, and lay out the exact roadmap for your unit.