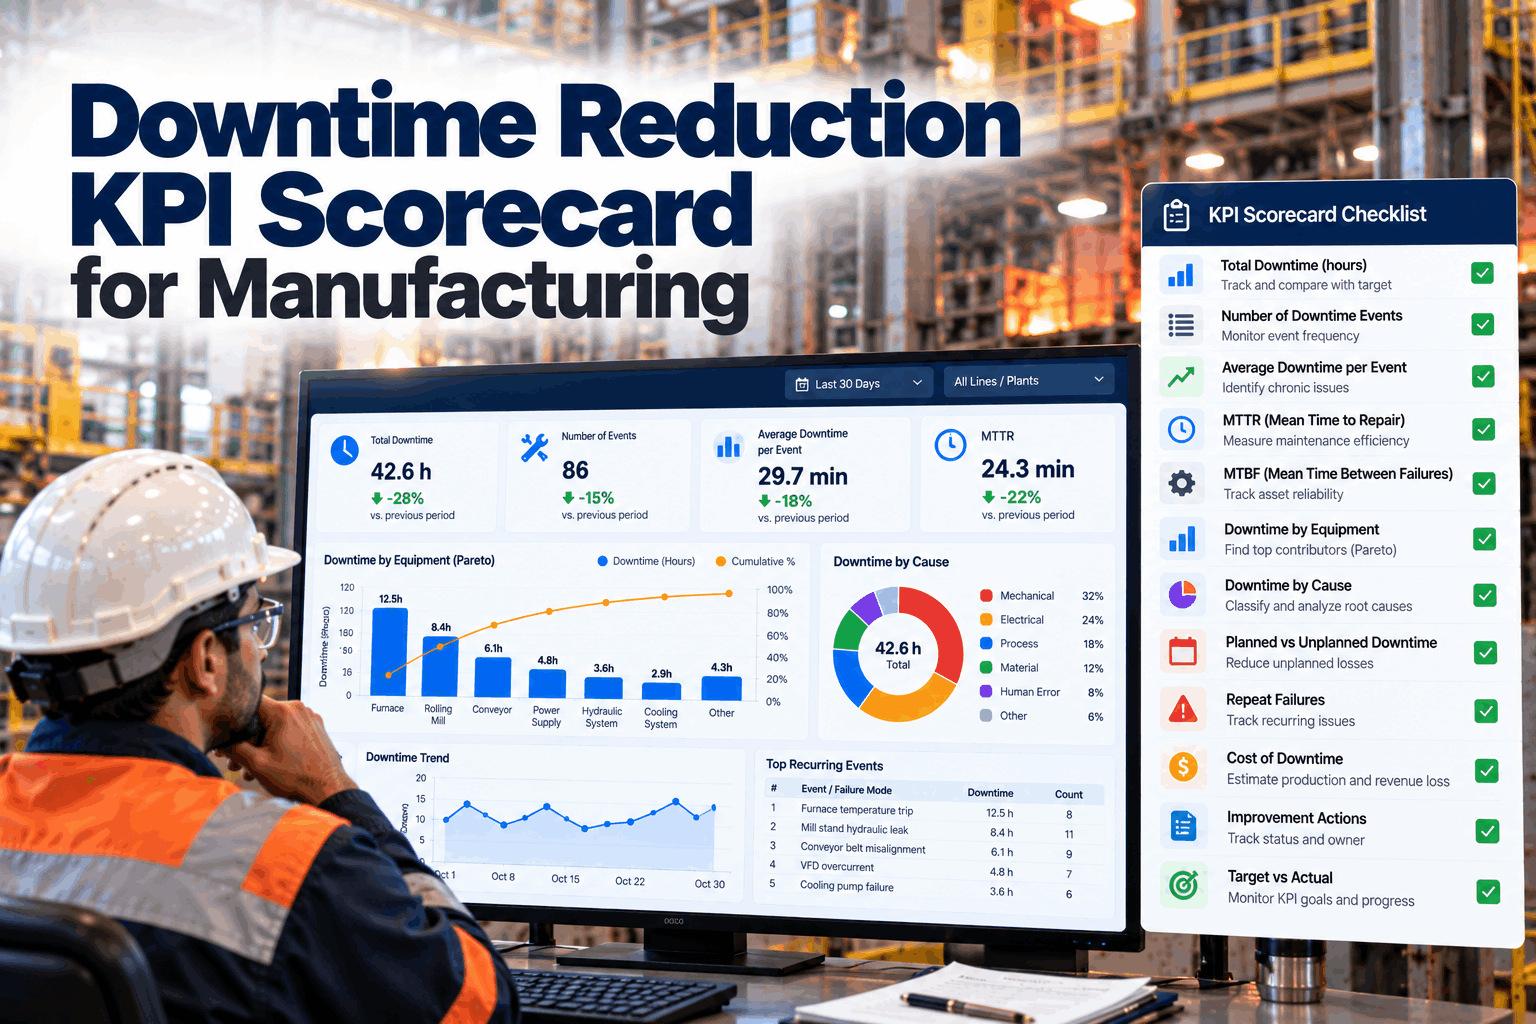
When MTBF is below target on a food or beverage line, the symptom is obvious — line stops keep killing OEE, shift after shift. But the fix isn't, because the most common mistake maintenance teams make is treating MTBF and MTTR as one problem. They're siblings, not synonyms, and they need opposite fixes. MTBF measures reliability — how long an asset runs before it fails, higher is better — so you improve it by preventing failures. MTTR measures maintainability — how fast you recover once it fails, lower is better — so you improve it by responding faster. They combine into the one number your team owns: availability, which equals MTBF over MTBF-plus-MTTR, the availability pillar of OEE. Pull the wrong lever and you burn effort without moving the number. This walks through how to lift MTBF and slash MTTR on your critical F&B assets — and the micro-stop trap that hides a bad OEE behind an acceptable MTBF. You can book a demo to see both on your lines.
RELIABILITY KPIs · FOOD & BEVERAGE · MAINTENANCE TEAM
MTBF and MTTR Are Different Problems — So They Need Different Fixes
MTBF below target means failures; MTTR too high means slow recovery. Lift one by preventing breakdowns, slash the other by responding faster — and watch the availability that drives OEE climb across every shift.
400+ hrs
World-class MTBF for F&B packaging lines
MTBF / (MTBF+MTTR)
The availability formula OEE rests on
~25 hrs/wk
Micro-stop loss a good MTBF can hide
TWO METRICS, ONE RELATIONSHIP
Know Which Number Is Failing You Before You Act
Before touching either metric, you have to read them together, because the combination tells you where the problem actually is. The same OEE hit can come from frequent failures, slow repairs, or both — and each points to a different fix. This is how the two numbers diagnose the problem.
Low MTBF, Good MTTR
Equipment fails often but you recover fast. Downtime per event is short, but the constant interruptions and the labor cost add up. The fix is upstream: attack the root cause of frequent failures, not the repair speed you've already got right.
Good MTBF, High MTTR
Failures are rare, but when one hits, the line is down a long time. The reliability is fine; the recovery is the problem. Focus on parts staging, repair SOPs, and technician readiness — not on preventing failures you rarely have.
Low MTBF and High MTTR
Frequent failures that also take long to fix — availability collapses and OEE tanks. This is the state that triggers capital-replacement conversations, and it needs both levers pulled at once, usually starting with the worst-actor assets.
Availability Ties Them Together
Availability equals MTBF over MTBF-plus-MTTR, and it's the OEE pillar maintenance owns. At 50-hour MTBF and 5-hour MTTR you're at about 91 percent; reaching 95 percent with the same MTTR means nearly doubling MTBF. The math tells you how hard each lever has to work.
LIFTING MTBF
Making Assets Run Longer Between Failures
Improving MTBF is about preventing the failures that are happening — which starts with knowing why they happen and intervening before they recur. On F&B critical assets, a handful of moves reliably extend time between failures. These are the levers, roughly in order of impact.
01
Eliminate the Root Cause of Repeat Failures
The fastest MTBF gains come from the worst-actor assets — the few that generate most of the failures. Root-cause each recurring failure and fix the cause, not the symptom, so it stops coming back. One eliminated repeat failure mode moves MTBF more than a dozen faster repairs.
02 Tune PM Intervals to the Real Wear Cycle
Too-frequent PM wastes budget and can introduce failures; too-lax PM lets assets fail. MTBF trending shows whether an interval can be safely extended or needs tightening, so preventive work matches the actual wear cycle rather than a guessed calendar.
03 Add Predictive Detection on Rotating Assets
Correlating maintenance with real-time vibration and thermal data catches degradation — bearing temperature rise, vibration harmonic shift, motor-current change — before breakdown. Facilities making this shift report MTBF gains of 20 to 35 percent on rotating assets within the first year.
04 Shift Toward Planned Maintenance
Reaching 90-plus-percent planned maintenance — the reactive-to-proactive threshold — is what sustains rising MTBF, because a plant firefighting breakdowns can't get ahead of them. The planned ratio is the leading indicator that MTBF will keep improving.
Find the Worst-Actor Assets Dragging Your MTBF
iFactory calculates MTBF per asset, per line, and per shift, so the few bad actors generating most of your failures surface immediately — and the root-cause and PM-tuning work goes where it actually moves the number.
SLASHING MTTR
Getting the Line Back Up Faster When It Does Stop
MTTR is a different discipline entirely — it's about compressing the time from failure to running again, and almost all of that time is spent not on the actual repair but on everything around it. Attacking those gaps is where MTTR falls fast. These are the levers that shorten recovery.
Stage the Right Spare Parts
A repair that waits on a part isn't a repair, it's a delay. Segmenting MTTR by asset class reveals which spares to stock and where, so the technician has the part in hand instead of the line waiting on a parts-crib gap — often the single biggest chunk of MTTR.
Standard Repair SOPs
A documented, standard procedure for the common failures turns a diagnose-from-scratch scramble into a known sequence, cutting the time from arrival to fix. The repairs you see most often are exactly the ones worth writing down.
Technician Readiness by Shift
MTTR segmented by shift and technician exposes where readiness gaps live — a night shift with slower recovery on a specific asset is a training target. Closing that gap lifts availability on the shifts that were quietly dragging it down.
Faster Detection and Notification
Part of MTTR is the time before anyone knows there's a problem. Automatic fault detection and immediate notification cut the delay between failure and response, so recovery starts sooner even before the wrench turns.
THE F&B TRAP NOBODY LOGS
An Acceptable MTBF Can Hide a Wrecked OEE
Here's the failure mode specific to food and beverage that catches good maintenance teams: micro-stops. On packaging and bottling lines especially, brief stoppages that nobody logs as failures don't hurt MTBF — but they devastate OEE, opening a gap between a metric that looks acceptable and a line that clearly isn't performing. Understanding this is essential to reading your own numbers.
Micro-Stops Are Invisible to MTBF
A jam cleared in thirty seconds rarely gets logged as a failure, so it never counts against MTBF — yet across a week those brief stops can total 25 hours, the equivalent of a full lost shift, and they land squarely on OEE. The gap between an acceptable MTBF and a degraded OEE is usually here.
Washdown Distorts the Failure Count
Sanitation and washdown cycles, and the moisture-related faults around them, distort MTBF unless failure definitions are set correctly — scheduled downtime excluded, real failures counted. A consistent definition across shifts is what makes the metric trustworthy.
The Aggregate Number Hides the Bad Actor
A plant averaging a healthy MTBF can have one asset class — a filler, a specific pump — running at a fraction of it, invisible in the rolled-up figure. Per-asset MTBF is what exposes exactly where the reliability investment pays off.
Count Every Stop Automatically
The root cause of the illusion is manual logging — operators don't record short stops, so failure counts run low and MTBF looks better than reality. Capturing every stop automatically from the line is what makes MTBF reflect what's actually happening.
THE METRICS ARE ONLY AS GOOD AS THE DATA
You Can't Improve What You Don't Capture Cleanly
Both metrics live or die on data quality, and the discipline of capturing failure data clean enough to trust is what separates a reliability program from a wishlist. The math is simple; the data hygiene is the hard part. This is the foundation both metrics rest on.
Real-Time Logging, Not Shift-End Batching
Technicians logging work orders from mobile devices as the work happens — not batch-entering paperwork at shift end — is what makes the timestamps accurate enough to calculate real MTTR. Reconstructed times are guesses; captured times are data.
One Failure Definition, Every Shift
MTBF is only comparable across shifts, lines, and plants if everyone counts a failure the same way and excludes scheduled PM consistently. A single, enforced definition is what lets you benchmark one line against another and trust the result.
Per-Asset, Per-Line, Per-Shift Granularity
Aggregate metrics hide the problems. Calculating both numbers down to the individual asset, line, and shift is what turns a dashboard into a diagnosis — showing exactly which asset on which shift to fix first.
Drill-Down to the Driving Events
A metric you can't trace isn't actionable. Being able to drill from a low MTBF to the specific failure events behind it is what turns the number into a work list rather than a score to feel bad about.
HOW iFACTORY DOES MTBF AND MTTR
Both Metrics, Automatically, Down to the Shift
iFactory calculates MTBF and MTTR automatically from your production and maintenance data, per asset, line, and shift, exposes the micro-stops and worst-actors that aggregate numbers hide, and points the reliability and repair-speed work where it actually lifts availability — so the OEE your team owns climbs on evidence, not guesswork.
1
Both metrics, calculated automatically. MTBF and MTTR are derived from PLC, SCADA, CMMS, and shift-log data with a consistent failure definition and scheduled downtime excluded — no spreadsheets, no manual reconstruction, comparable across every shift and line.
2
Micro-stops and worst-actors surfaced. Every stop is counted automatically, so the micro-stop loss hiding behind an acceptable MTBF and the single asset class dragging the fleet both become visible instead of averaging away.
3
MTBF lifted with PdM and PM tuning. Predictive models catch degradation before breakdown and MTBF trending retunes PM intervals to the real wear cycle, extending time between failures on the rotating assets that drive most F&B downtime.
4
MTTR cut where recovery is slow. MTTR segmented by asset, technician, and shift shows where to stage spares, write SOPs, and close readiness gaps — and the dashboard quantifies exactly how much each move lifts availability and OEE.
1000+
Industrial clients running iFactory across operations
Per shift
MTBF and MTTR down to asset, line, and shift
20-35%
MTBF gain reported on rotating assets in year one
FREQUENTLY ASKED QUESTIONS
What Maintenance Teams Ask About MTBF and MTTR
Should we focus on MTBF or MTTR first?
Read them together first, because the combination tells you which one to attack — going after the wrong one wastes effort. If your MTBF is low but MTTR is good, you're recovering fast from failures that keep happening, so the priority is preventing the failures: root-cause the worst-actor assets and fix the causes, not the repair speed you've already got right. If MTBF is fine but MTTR is high, failures are rare but each one keeps the line down too long, so the priority is recovery speed: parts staging, repair SOPs, and technician readiness, not preventing failures you seldom have. If both are bad — frequent failures that also take long to fix — availability is collapsing and you pull both levers at once, usually starting with the handful of worst-actor assets generating most of the pain. The availability formula quantifies the trade-off: availability equals MTBF divided by MTBF plus MTTR, so you can calculate exactly how much lifting MTBF versus cutting MTTR moves the number for your specific situation. The mistake to avoid is treating them as one initiative; they're different disciplines — reliability engineering versus maintainability — and the data tells you which the plant needs more.
Book a demo to see which lever moves your OEE most.
Why does our MTBF look fine but our OEE is still poor?
Almost always the answer is micro-stops, and it's the classic food-and-beverage trap. MTBF only counts events logged as failures, and brief stoppages — a jam cleared in thirty seconds, a quick sensor fault, a momentary infeed starvation — rarely get logged, so they never count against MTBF. But those micro-stops land directly on OEE through both availability and performance losses, and they add up alarmingly: on a packaging or bottling line they can total around 25 hours a week, the equivalent of a full lost shift, while your MTBF still reads acceptable. That gap between a healthy-looking MTBF and a clearly-underperforming line is the signature of a micro-stop problem, and it's invisible until you count every stop automatically rather than relying on operators to log short ones, which they understandably don't. There's a related distortion specific to F&B: washdown and sanitation cycles and the moisture faults around them can inflate or deflate the failure count unless your failure definition consistently excludes scheduled downtime and counts real failures the same way every shift. And aggregate reporting hides bad actors — a plant averaging a good MTBF can have one filler or pump running at a fraction of it. Fixing the illusion means automatic stop-counting, a consistent failure definition, and per-asset granularity, after which MTBF and OEE start telling the same story.
Support can check your line for the micro-stop gap.
What's a good MTBF target for a food and beverage line?
For packaging lines in food and beverage, world-class MTBF is generally cited around 400-plus hours, but the honest answer is that the right target depends heavily on the asset type, the line speed, and your product and process, so a single number is less useful than a trend and a per-asset view. What matters more than hitting a benchmark is two things: first, that you're measuring consistently enough to compare a line against itself over time and against similar lines elsewhere, because an improving trend on a trustworthy metric beats a flattering absolute number on a shaky one; and second, that you look per asset rather than in aggregate, because a facility averaging a healthy 650-hour MTBF may have a specific pump or filler class running at 180 hours that's invisible in the rolled-up figure and is where the real reliability investment should go. So rather than chasing a universal target, benchmark each equipment class against its own best-performing instance across your lines and shifts, find the top performer, and copy that playbook to the laggards. That approach — comparing the same equipment class across lines and shifts to find the best performer and replicate it — tends to deliver more reliable gains than pursuing an industry-average figure that may not fit your specific assets. The benchmark is a sanity check; the per-asset trend is the actual management tool.
How much of MTTR is actually the repair itself?
Usually surprisingly little — which is exactly why MTTR is so improvable. The time from failure to running again is dominated not by the wrench-turning but by everything around it: the delay before anyone notices the fault, the time to diagnose what's wrong, the wait for the right spare part, and the travel and setup, with the actual hands-on repair often a small fraction of the total. That's good news, because it means you can cut MTTR substantially without anyone repairing faster — you attack the gaps instead. Faster detection and automatic notification compress the time before response even begins. A staged spare part eliminates the parts-crib wait that's frequently the single largest chunk of MTTR. A documented repair SOP for the common failures turns a diagnose-from-scratch scramble into a known sequence. And segmenting MTTR by shift and technician exposes readiness gaps you can close with targeted training, so a slow night shift on a particular asset stops quietly dragging availability. The way to find where your MTTR actually goes is to segment it by asset class and by shift and see which phase dominates, then attack that phase specifically rather than exhorting technicians to hurry. Most plants discover the biggest wins are in parts availability and detection speed, not in the repair work itself.
Do we really need software, or can we track these in spreadsheets?
You can calculate the formulas in a spreadsheet, but you almost certainly can't trust the result, and the untrustworthy data is what makes spreadsheet tracking a dead end. Both metrics depend entirely on data quality: MTBF needs every failure counted consistently with scheduled downtime excluded, and MTTR needs accurate failure and repair timestamps. Spreadsheets fail on both because they rely on manual entry — operators don't log short stops, so failure counts run low and MTBF looks better than reality; and technicians batch-enter paperwork at shift end from memory, so the timestamps that determine MTTR are reconstructed guesses rather than captured data. On top of that, maintaining per-asset, per-line, per-shift granularity by hand across a whole plant is impractical, so spreadsheet programs default to aggregate numbers that hide exactly the bad actors and micro-stop losses you most need to see. A system that captures stops automatically from the line and lets technicians log work orders in real time from mobile devices closes both gaps: every stop is counted, timestamps are accurate, and the metrics are calculated automatically down to the shift with drill-down to the specific events driving them. The math was never the hard part — the data discipline is, and that's what software provides that a spreadsheet structurally can't. Integration is scoped to the PLC, SCADA, and CMMS data you already generate.
Lift MTBF, Slash MTTR, and Watch OEE Climb
iFactory calculates both reliability metrics automatically per asset and shift, surfaces the micro-stops and worst-actors hiding your real performance, and points the prevention and recovery work exactly where it lifts availability — so line stops stop killing your OEE.